

Abstract
Background
Few studies have quantified clinical improvement following minimally invasive lumbar decompression based on predominant back pain or leg pain.
Purpose
To quantify improvement in patient-reported outcomes following minimally invasive lumbar decompression and determine the degree of improvement in back pain, leg pain, and disability in patients who present with predominant back pain or predominant leg pain.
Methods
Patients who underwent primary, one-level minimally invasive lumbar decompression for degenerative pathology were retrospectively reviewed. Comparisons of visual analog scale (VAS) back and leg pain scores, Oswestry Disability Index (ODI) scores, and Short Form-12 (SF-12) mental and physical component scores from pre-operative to 6-week, 12-week, 6-month, and 1-year follow-up. Subgroup analyses were performed for patients with predominant back pain or predominant leg pain.
Results
A total of 102 patients were identified. Scores on VAS back and leg pain, ODI, and SF-12 physical component improved from pre-operative to all post-operative time points. After 1 year, patients reported a 2.8-point (47%) reduction in back pain and a 4-point (61.1%) reduction in leg pain scores; 52 patients with predominant back pain and 50 patients with predominant leg pain reported reductions in pain throughout the year following surgery. In both the back and leg pain cohorts, patients experienced reductions in ODI during the first 6 months and throughout 1-year follow-up, respectively. The majority of patients achieved minimum clinically important difference, regardless of predominant symptom.
Conclusions
Patients reported improvements in back and leg pain following minimally invasive lumbar decompression regardless of predominant presenting symptom; however, patients with predominant leg pain may experience greater improvement than those with predominant back pain.
Electronic supplementary material
The online version of this article (10.1007/s11420-018-09661-z) contains supplementary material, which is available to authorized users.
Keywords: minimally invasive spine surgery, lumbar decompression, patient-reported outcomes, visual analog scale back pain, visual analog scale leg pain, Oswestry Disability Index, minimum clinically important difference
Introduction
An estimated 60 to 80% of the general population will experience low back pain (LBP) at some point in their lives [21, 33]. Of this population, approximately 70% will be diagnosed with an acute muscular or ligamentous strain of the lumbar spine, with nonsurgical management resolving symptoms [21]. In contrast, only 3 to 4% of patients with LBP are diagnosed with symptomatic disk herniation or spinal stenosis resulting in neurologic impingement that requires definitive treatment [5, 6, 20, 21, 33].
The goal of lumbar decompression (LD) is to alleviate symptoms due to neural impingement [30]. Depending on the severity and location of compression, LD aims to relieve pressure on exiting nerve roots through a combination of the following: complete or partial intervertebral disk debulking (discectomy), complete or partial removal of the vertebral facet (facetectomy) or lamina (laminectomy), or widening of the foramen (foraminotomy).
Patients suffering from symptoms of neural compression often present with LBP and radicular leg pain. Conventional wisdom holds that greater improvements are seen in radiculopathy than in LBP following LD. Given this finding, several authors state the ideal candidate for minimally invasive decompression surgery should have unilateral radicular pain radiating into the foot, with leg pain greater than back pain [3, 30].
Minimally invasive surgery (MIS) targets pathologic conditions of the spine through the use of a small incision and a tubular retractor. Prior studies, comparing MIS to open LD based on operative characteristics and patient-reported outcome (PRO) measures, have demonstrated that MIS LD has the potential to reduced iatrogenic soft tissue injury, blood loss, post-operative pain, post-operative opioid consumption, length of hospitalization, and readmission rates compared to the open technique [18, 27, 30, 44]. PROs are used to evaluate clinical outcomes such as treatment response and functional disability following spinal surgery [4]. Despite the prevailing use of these questionnaires, few studies have quantified the degree of back pain, leg pain, and disability improvement a patient can expect over the first post-operative year following MIS LD.
Therefore, the purpose of this study was to (1) quantify the improvement in LBP, leg pain, patient-reported disability, and mental and physical component quality-of-life scores over the first post-operative year following MIS LD and (2) quantify the degree of improvements in LBP, leg pain, and patient-reported disability following MIS LD in patients who present with predominant LBP (pBP) versus predominant leg pain (pLP). We hypothesized that patients would experience significant clinical improvements in PROs at 1-year follow-up in both the pBP and pLP cohorts following MIS LD.
Materials and Methods
Patient Population
A prospectively maintained surgical registry of patients who underwent a primary, one-level MIS LD by a single surgeon at a single academic institution was reviewed. Patients were included if they underwent a discectomy, laminectomy, foraminotomy, facetectomy, or laminoforaminotomy for degenerative spinal pathology. Patients who underwent previous spine surgery; had a previous history of spinal trauma; or had fewer than 6 months of post-operative follow-up, did not have a predominant leg or pain symptom, or had incomplete survey data were excluded from the study. Between 2010 and 2016, a total of 379 patients were identified and 102 met the study criteria and were included in the analysis. All patients achieved at least 6 months of post-operative follow-up, with 68 patients having follow-up for a full year.
Surgical Technique
Following fluoroscopic visualization of the index level of pathology, a unilateral approach was performed via a 2-cm paramedian skin incision. Following dissection to the level of the deep fascia, a series of tubular dilators was used to allow fitting of either a 16-mm or 21-mm nonexpandable tubular retractor. Next, stages of decompression were achieved through laminectomies, facetectomies, and foraminotomies using a high-speed burr (Fig. 4). The ligamentum flavum was then resected with a 3-mm Kerrison rongeur. In patients requiring a discectomy, the traversing nerve root was gently retracted medially and the disk fragment was resected using a pituitary rongeur.
Fig. 4.

Minimally invasive lumbar decompression through a nonexpandable tubular retractor using a high-speed burr.
Demographic and Patient-Reported Outcome Analysis
Patients were analyzed by the following demographic, comorbidity, and peri-operative variables: age, gender, body mass index (BMI), smoking status, and Charlson Comorbidity Index [31]. Patients completed five PRO questionnaires pre-operatively and at all post-operative time points (6 weeks, 12 weeks, 6 months, 1 year): visual analog scale (VAS) score for back pain, VAS score for leg pain, Oswestry Disability Index (ODI) [34], and Short Form-12 Health Survey (SF-12) Mental Component Summary (MCS) and Physical Component Summary (PCS). The VAS utilizes a numerical scale, ranging from 0 (no pain) to 10 (maximum pain), for patients to report region-specific pain. VAS back pain and leg pain scores were assessed at all time points. The ODI is a 10-part questionnaire designed to assess how a patient’s back pain affects their day-to-day function. Each question is scored from 0 to 5, with a maximum score of 50 points reported as a percentage out of 100. A higher score indicates increasing disability [13]. The SF-12 is an abbreviated version of the Short Form-36 Health Survey and can be interpreted in total as a health-related quality-of-life survey or in sections as separate mental and physical component summary scores [43, 51, 52]. Increasing scores on the SF-12 MCS and PCS and decreasing scores on the VAS (back or leg pain) and ODI indicate functional improvements.
Primary analysis was performed as a single cohort. Patients were then stratified into subgroups based on the severity of presenting symptoms. Patients with pre-operative VAS back pain scores greater than or equal to their VAS leg pain scores were stratified into the pBP cohort. Patients with pre-operative VAS back pain scores less than their VAS leg pain scores were stratified into the pLP cohort.
The percentage of patients achieving a minimum clinically important difference (MCID) in scores for VAS back pain, VAS leg pain, and ODI at any post-operative time point was compared between cohorts. MCID was determined if patients reached an average post-operative reduction of 2.3 points for VAS back pain score [34], 5.0 points for VAS leg pain score [38], and 12.8 points for ODI score [11], or experienced a 40% reduction from their respective pre-operative value.
Statistical Analysis
Statistical analysis was performed using Stata/MP® 13.1 for Mac (StataCorp LP, College Station, TX, USA). Baseline patient characteristics were reported using means and standard deviations for continuous variables and percentages for categorical variables. Pairwise comparisons of pre-operative to post-operative VAS back and leg pain, ODI, and SF-12 MCS and PCS scores were performed using paired t tests for each post-operative time point (6 weeks, 12 weeks, 6 months, and 1 year). Analysis of variance (ANOVA) was used to estimate the overall reduction in back and leg pain that patients experienced over the first post-operative year. Subgroup analyses comparing pre-operative to post-operative VAS back pain, VAS leg pain, and ODI scores for patients with pBP or pLP were also performed using paired t tests for each post-operative time point. Pre-operative to post-operative pain and disability score comparisons and percentage of patients achieving MCID by predominant symptom were performed using multivariate linear regression adjusting for pre-operative characteristics such as age, sex, BMI category, smoking status, and comorbidity burden. A p value < 0.05 was used to determine statistical significance and all tests were two-tailed.
Results
Primary Analysis
Table 1 reports baseline patient characteristics. A total of 102 patients who underwent a primary, one-level MIS LD were included in the analysis. The average patient age was 45 years, with 69.6% males. All patients achieved at least 6 months of post-operative follow-up, with 68 patients having follow-up for a full year.
Table 1.
Patient population characteristics
| LD (N = 102) | |
|---|---|
| Age (mean ± SD, years) | 45.0 ± 11.8 |
| Sex (n) | |
| Female | 30.4% (31) |
| Male | 69.6% (71) |
| Body mass index (BMI) (n, kg/m2) | |
| Non-obese (BMI < 30) | 48.0% (49) |
| Obese (BMI ≥ 30) | 52.0% (53) |
| Smoking status (n) | |
| Non-smoker | 78.4% (80) |
| Smoker | 21.6% (22) |
| Comorbidity burden (CCI) | 1.8 ± 1.6 |
| Surgical technique* (n) | |
| Posterior decompression without discectomy | 19.6% (20) |
| Posterior decompression with discectomy | 80.4% (82) |
| Pre-operative VAS back (mean ± SD) | 5.9 ± 2.7 |
| Pre-operative VAS leg (mean ± SD) | 6.5 ± 2.5 |
SD, standard deviation; CCI, Charlson Comorbidity Index; VAS, visual analog scale; LD, lumbar decompression
*Posterior decompression = laminectomy, facetectomy, and foraminotomy
Tables 2 and 3 display improvements in PROs. Patients experienced a 2.8-point (47.0%) reduction in back pain and a 4.0-point (61.1%) reduction in leg pain over the first year, with significant improvements at all post-operative time points (p < 0.05 for each; Fig. 1). Patients experienced a 21.3-point (47.1%) reduction in ODI and a 12.5-point (41.7%) increase in SF-12 PCS over the first year (p < 0.05 for each). ODI and SF-12 PCS demonstrated improvement at all post-operative time points (p < 0.05 for each; Figs. 2 and 3). Patients experienced a 3.1-point (6.3%) increase in SF-12 MCS over the first year (p < 0.05).
Table 2.
Pairwise comparison of post-operative to pre-operative scores*
| Mean ± SE | 95% CI | p value | |
|---|---|---|---|
| VAS back | |||
| Pre-operative | 5.9 ± 0.3 | 5.4–6.4 | – |
| 6 weeks | 3.2 ± 0.3 | 2.6–3.7 | < 0.001 |
| 12 weeks | 3.4 ± 0.4 | 2.6–4.1 | < 0.001 |
| 6 months | 2.7 ± 0.4 | 1.9–3.5 | < 0.001 |
| 1 year | 2.9 ± 0.6 | 1.6–4.2 | < 0.001 |
| VAS leg | |||
| Pre-operative | 6.4 ± 0.2 | 5.9–6.9 | – |
| 6 weeks | 2.8 ± 0.3 | 2.2–3.3 | < 0.001 |
| 12 weeks | 2.4 ± 0.4 | 1.6–3.1 | < 0.001 |
| 6 months | 2.0 ± 0.4 | 1.1–2.9 | < 0.001 |
| 1 year | 2.7 ± 0.6 | 1.5–3.9 | < 0.001 |
| ODI | |||
| Pre-operative | 44.8 ± 1.9 | 41.0–48.6 | – |
| 6 weeks | 25.6 ± 1.8 | 22.0–29.2 | < 0.001 |
| 12 weeks | 24.9 ± 2.7 | 19.5–30.3 | < 0.001 |
| 6 months | 21.1 ± 3.3 | 14.4–27.9 | < 0.001 |
| 1 year | 18.6 ± 4.0 | 10.2–26.9 | 0.001 |
| SF-12 MCS | |||
| Pre-operative | 50.9 ± 1.5 | 48.0–53.8 | – |
| 6 weeks | 52.4 ± 1.8 | 48.7–56.0 | 0.289 |
| 12 weeks | 54.5 ± 1.9 | 50.7–58.3 | 0.051 |
| 6 months | 53.1 ± 2.0 | 49.0–57.3 | 0.391 |
| 1 year | 48.1 ± 3.2 | 41.3–54.9 | 0.401 |
| SF-12 PCS | |||
| Pre-operative | 30.3 ± 1.4 | 27.5–33.0 | – |
| 6 weeks | 38.4 ± 1.7 | 34.9–42.0 | < 0.001 |
| 12 weeks | 43.0 ± 2.4 | 38.0–48.0 | < 0.001 |
| 6 months | 46.2 ± 2.3 | 41.4–51.1 | < 0.001 |
| 1 year | 44.3 ± 2.3 | 39.3–49.2 | < 0.001 |
SE, standard error; CI, confidence interval; VAS, visual analog scale; ODI, Oswestry Disability Index; SF-12, Short Form-12; MCS, mental component summary; PCS, physical component summary
*Italic entries indicate statistical significance
Table 3.
Mean improvement in PROs over the first post-operative year
| Pre-operative score (mean ± SD) | Post-operative score (mean ± SD) | Mean point improvement | Mean percent improvement | p value | |
|---|---|---|---|---|---|
| VAS back pain | 5.9 ± 0.3 | 3.1 ± 0.2 | 2.8 | 47.0% | < 0.001 |
| VAS leg pain | 6.5 ± 0.2 | 2.5 ± 0.2 | 4.0 | 61.1% | < 0.001 |
| ODI | 45.3 ± 1.9 | 24.0 ± 1.3 | 21.3 | 47.1% | < 0.001 |
| SF-12 MCS | 49.3 ± 1.2 | 52.4 ± 1.0 | 3.1 | 6.3% | < 0.001 |
| SF-12 PCS | 29.9 ± 0.9 | 42.4 ± 1.1 | 12.5 | 41.7% | < 0.001 |
PRO, patient-reported outcome; SE, standard deviation; VAS, visual analog scale; ODI, Oswestry Disability Index; SF-12, Short Form-12 Health Survey; MCS, mental component summary; PCS, physical component summary
Fig. 1.
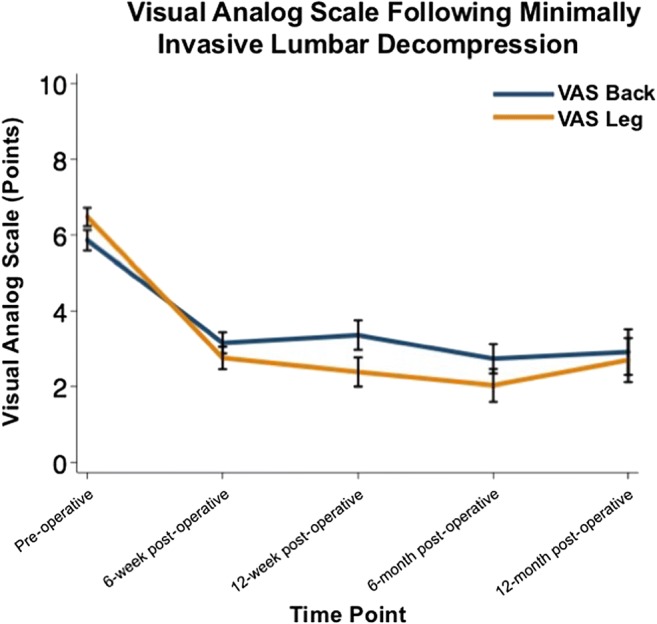
Improvements in visual analog scale (VAS) back and leg pain scores from pre-operative to post-operative visits following minimally invasive lumbar decompression.
Fig. 2.
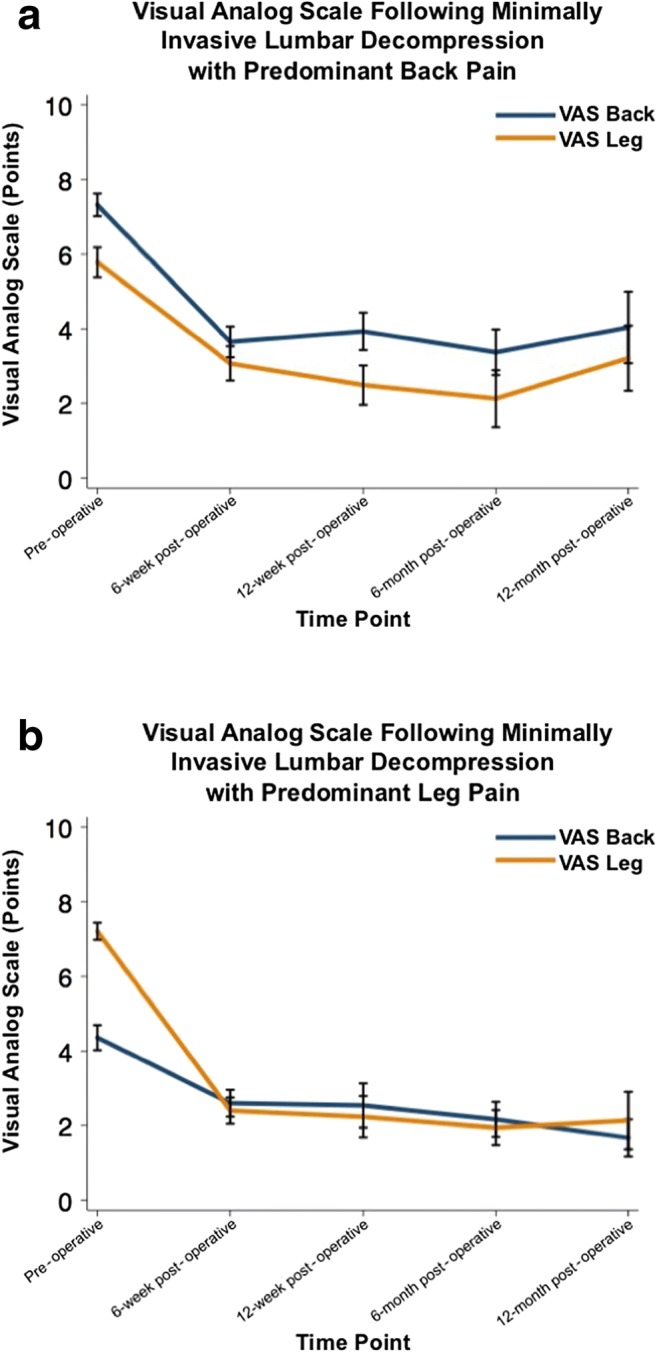
a Improvements in visual analog scale (VAS) back and leg pain scores from pre-operative to post-operative visits following minimally invasive lumbar decompression in patients with predominant back pain. b Improvements in visual analog scale (VAS) back and leg pain scores from pre-operative to post-operative visits following minimally invasive lumbar decompression in patients with predominant leg pain.
Fig. 3.
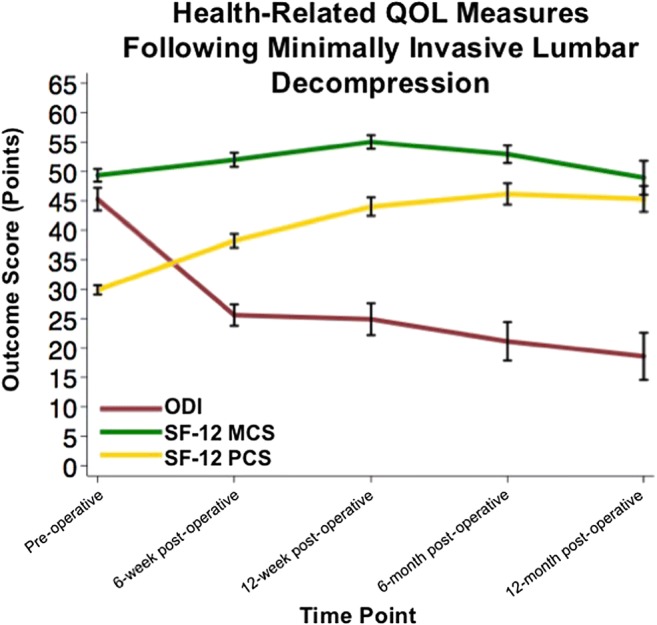
Improvements in Oswestry Disability Index (ODI) [36], Short Form-12 Mental (MCS), and Physical Component Summary (PCS) scores from pre-operative to post-operative visits following minimally invasive lumbar decompression. QOL quality of life
Subgroup Analysis
Table 4 describes baseline patient characteristics by subgroup. Pre-operatively, 52 patients (51.0%) had pBP and 50 patients (49.0%) had pLP. Patients in the pLP cohort were older (47.3 vs. 42.7 years, p = 0.049) and consisted of more females (40.0% vs. 21.2%, p = 0.039) compared to the pBP cohort. Patients with pBP underwent posterior decompression with a discectomy at a similar rate compared to patients with pLP (80.8% vs. 80.0%, p = 0.922). Patients with pBP had a higher pre-operative VAS back pain score (7.3 ± 2.2 vs. 4.4 ± 2.4, p < 0.001) and a lower pre-operative VAS leg pain score (5.8 ± 2.9 vs. 7.2 ± 1.6, p = 0.003).
Table 4.
Patient population characteristics by subgroup
| pBP (n=52) | pLP (n=50) | p value | |
|---|---|---|---|
| Age (mean ± SD, years) | 42.7 ± 12.3 | 47.3 ± 11.0 | 0.049 |
| Sex (n) | 0.039 | ||
| Female | 21.2% (11) | 40.0% (20) | |
| Male | 78.9% (41) | 60.0% (30) | |
| Body mass index (BMI) (n, kg/m2) | 0.115 | ||
| Non-obese (BMI < 30) | 40.4% (21) | 56.0% (28) | |
| Obese (BMI ≥ 30) | 59.6% (31) | 44.0% (22) | |
| Smoking status (n) | 0.390 | ||
| Non-smoker | 75.0% (39) | 82.0% (41) | |
| Smoker | 25.0% (13) | 18.0% (9) | |
| Comorbidity burden (CCI) | 1.6 ± 1.7 | 1.9 ± 1.4 | 0.340 |
| Surgical technique* (n) | 0.922 | ||
| Posterior decompression without discectomy | 19.2% (10) | 20.0% (10) | |
| Posterior decompression with discectomy | 80.8% (42) | 80.0% (40) | |
| Pre-operative VAS back (mean ± SD) | 7.3 ± 2.2 | 4.4 ± 2.4 | < 0.001 |
| Pre-operative VAS leg (mean ± SD) | 5.8 ± 2.9 | 7.2 ± 1.6 | 0.003 |
Italic entries indicate statistical significance
SD, standard deviation; CCI, Charlson Comorbidity Index; VAS, visual analog scale; LD, lumbar decompression; pBP, predominant back pain; pLP, predominant leg pain
*Posterior decompression = laminectomy, facetectomy, and foraminotomy
Tables 5, 6, and 7 display improvements in PROs for each subgroup. Patients with pBP experienced a 3.6-point (49.0%) reduction in back pain and a 3.0-point (52.2%) reduction in leg pain (p < 0.05). Patients with pLP experienced a 2.0-point (45.0%) reduction in back pain and a 5.0-point (68.9%) reduction in leg pain (p < 0.05). Patients with pBP experienced significant reductions in both back and leg pain at 6-week, 12-week, and 6-month follow-up and to the 1-year follow-up for leg pain (p < 0.05; Fig. 2a). Patients with pLP experienced significant reductions in both back and leg pain at all post-operative time points (p < 0.05; Fig. 2b). Patients with pBP experienced greater reductions in back pain at the 6- and 12-week follow-up (6 weeks, − 3.7 vs. – 1.7, p =0.004; 12 weeks, − 3.3 vs. − 1.9, p = 0.047) compared to the pLP cohort. Patients with pLP experienced greater reductions in leg pain at 6-week follow-up (− 4.8 vs. − 2.7, p = 0.026) compared to the pBP cohort. At 1-year follow-up, patients with pBP experienced a 19.2-point (40.4%) reduction in ODI, while patients with pLP experienced a 24.1-point (56.1%) reduction (p < 0.05). Patients with pBP experienced reductions in ODI over the first 6 months, while the pLP cohort exhibited reductions over the year (p < 0.05). Patients with pBP and pLP experienced similar reductions in ODI from baseline over the first year (p > 0.05).
Table 5.
Pairwise comparison of post-operative to pre-operative pain and disability scores by predominant back or leg pain*
| Predominant back pain (n = 52) | Predominant leg pain (n = 50) | |||||
|---|---|---|---|---|---|---|
| Mean ± SE | 95% CI | p value | Mean ± SE | 95% CI | p value | |
| VAS back | ||||||
| Pre-operative | 7.3 ± 0.3 | 6.7–7.9 | – | 4.3 ± 0.3 | 3.6–5.0 | – |
| 6 weeks | 3.6 ± 0.4 | 2.8–4.5 | < 0.001 | 2.6 ± 0.4 | 1.9–3.3 | < 0.001 |
| 12 weeks | 3.9 ± 0.5 | 2.9–4.9 | < 0.001 | 2.5 ± 0.6 | 1.3–3.8 | 0.002 |
| 6 months | 3.4 ± 0.6 | 2.1–4.7 | < 0.001 | 2.2 ± 0.5 | 1.2–3.1 | 0.002 |
| 1 year | 4.0 ± 1.0 | 1.9–6.2 | 0.009 | 1.7 ± 0.5 | 0.5–2.8 | 0.004 |
| VAS leg | ||||||
| Pre-operative | 5.8 ± 0.4 | 5.0–6.6 | – | 7.2 ± 0.2 | 6.7–7.6 | – |
| 6 weeks | 3.1 ± 0.5 | 2.1–4.0 | < 0.001 | 2.4 ± 0.4 | 1.7–3.1 | < 0.001 |
| 12 weeks | 2.5 ± 0.5 | 1.4–3.6 | < 0.001 | 2.2 ± 0.5 | 1.1–3.4 | < 0.001 |
| 6 months | 2.1 ± 0.8 | 0.5–3.7 | 0.002 | 1.9 ± 0.5 | 0.9–3.0 | < 0.001 |
| 1 year | 3.2 ± 0.9 | 1.3–5.2 | 0.063 | 2.1 ± 0.8 | 0.4–3.9 | < 0.001 |
| ODI | ||||||
| Pre-operative | 47.5 ± 2.8 | 41.9–53.1 | – | 41.8 ± 2.5 | 36.7–46.9 | – |
| 6 weeks | 28.8 ± 2.7 | 23.3–34.3 | < 0.001 | 22.0 ± 2.3 | 17.4–26.6 | < 0.001 |
| 12 weeks | 28.3 ± 3.4 | 21.5–35.2 | < 0.001 | 20.0 ± 4.4 | 10.9–29.0 | < 0.001 |
| 6 months | 28.2 ± 5.5 | 16.6–39.8 | 0.004 | 14.4 ± 3.3 | 7.5–21.3 | < 0.001 |
| 1 year | 26.5 ± 6.6 | 11.7–41.3 | 0.137 | 9.9 ± 2.3 | 4.6–15.1 | 0.002 |
SE, standard error; CI, confidence interval; VAS, visual analog scale; ODI, Oswestry Disability Index
*Italic entries indicate statistical significance
Table 6.
Comparison of change from pre-operative to post-operative pain and disability scores by predominant back or leg pain*
| pBP (n = 52) | pLP (n = 50) | p value† | |
|---|---|---|---|
| Change in VAS back ∆ (mean ± SE) | |||
| ∆VAS back at 6 weeks | − 3.7 ± 0.5 | − 1.7 ± 0.4 | 0.004 |
| ∆VAS back at 12 weeks | − 3.3 ± 0.6 | − 1.9 ± 0.6 | 0.047 |
| ∆VAS back at 6 months | − 4.0 ± 0.8 | − 2.1 ± 0.6 | 0.076 |
| ∆VAS back at 1 year | − 3.7 ± 1.1 | − 2.2 ± 0.6 | 0.299 |
| Change in VAS leg ∆ (mean ± SE) | |||
| ∆VAS leg at 6 weeks | − 2.7 ± 0.5 | − 4.8 ± 0.4 | 0.026 |
| ∆VAS leg at 12 weeks | − 3.2 ± 0.7 | − 5.1 ± 0.5 | 0.394 |
| ∆VAS leg at 6 months | − 3.5 ± 0.9 | − 5.2 ± 0.5 | 0.283 |
| ∆VAS leg at 1 year | − 2.6 ± 1.3 | − 4.8 ± 0.7 | 0.491 |
| Change in ODI ∆ (mean ± SE) | |||
| ∆ODI at 6 weeks | − 18.7 ± 3.4 | − 19.8 ± 2.9 | 0.463 |
| ∆ODI at 12 weeks | − 20.2 ± 4.4 | − 25.7 ± 5.4 | 0.917 |
| ∆ODI at 6 months | − 22.0 ± 6.6 | − 31.0 ± 4.3 | 0.410 |
| ∆ODI at 1 year | − 12.4 ± 7.7 | − 26.9 ± 6.1 | 0.355 |
SE, standard error; VAS, visual analog scale; ODI, Oswestry Disability Index; pBP, predominant back pain; pLP, predominant leg pain
*Italic entries indicate statistical significance
†p values calculated using multivariate linear regression adjusted for age, sex, body mass index category, smoking status, and comorbidity burden
∆Change in VAS/ODI = post-operative ODI (6 weeks, 12 weeks, 6 months, 1 year)–pre-operative ODI
Table 7.
Improvement in PROs over the first post-operative year by predominant back pain or leg pain
| Pre-operative score (mean ± SE) | Post-operative score (mean ± SE) | Mean point improvement | Mean percent improvement | p value | |
|---|---|---|---|---|---|
| Predominant back pain | |||||
| VAS back pain | 7.3 ± 0.3 | 3.7 ± 0.3 | 3.6 | 49.0% | < 0.001 |
| VAS leg pain | 5.8 ± 0.4 | 2.8 ± 0.3 | 3.0 | 52.2% | < 0.001 |
| ODI | 47.5 ± 2.8 | 28.3 ± 1.9 | 19.2 | 40.4% | < 0.001 |
| Predominant leg pain | |||||
| VAS back pain | 4.4 ± 0.3 | 2.4 ± 0.2 | 2.0 | 45.0% | < 0.001 |
| VAS leg pain | 7.2 ± 0.2 | 2.2 ± 0.2 | 5.0 | 68.9% | < 0.001 |
| ODI | 42.9 ± 2.5 | 18.8 ± 1.7 | 24.1 | 56.1% | < 0.001 |
PRO, patient-reported outcome; SD, standard deviation; VAS, visual analog scale; ODI, Oswestry Disability Index; SF-12, Short Form-12 Health Survey; MCS, mental component summary; PCS, physical component summary
Minimum Clinically Important Difference
Table 8 displays the percentage of patients achieving MCID for each PRO. There were no differences in the percentage of patients achieving MCID for VAS back pain score (pBP, 65.4% vs. pLP, 60.0%, p = 0.575), VAS leg pain score (pBP, 57.7% vs. pLP, 80.0%, p = 0.087), or ODI score (pBP, 80.8% vs. pLP, 86.0%, p = 0.243) between patients who presented with pBP versus pLP.
Table 8.
Percent of patients who achieved a minimum clinically important difference by subgroup
| pBP (n = 52) | pLP (n = 50) | p value* | |
|---|---|---|---|
| VAS back pain (n) | 94.2% (49) | 98.0% (49) | 0.525 |
| VAS leg pain (n) | 96.2% (50) | 100.0% (50) | 0.441 |
| ODI (n) | 94.2% (49) | 100.0% (50) | 0.224 |
VAS, visual analog scale; ODI, Oswestry Disability Index; pBP, predominant back pain; pLP, predominant leg pain
*p values calculated using multivariate linear regression adjusted for age, sex, body mass index category, smoking status, and comorbidity burden
Discussion
Lumbar decompression is performed to alleviate symptoms caused by neural impingement (Fig. 4) and is thought to improve radicular leg pain more than LBP. Although studies have evaluated PROs following LD [1, 14, 18, 25, 27, 28, 41], few have quantified clinical improvement following MIS LD based on predominant presenting symptom [9, 12, 15]. Therefore, this study sought to quantify the improvement in PROs following MIS LD and determine the degree of improvement in LBP, leg pain, and disability in patients who present with pBP versus pLP. Our results suggest patients experience significant improvements in both back and leg pain following MIS LD. In general, patients experience the majority of their improvement during the first 6 weeks following surgical decompression of an affected nerve root [2, 3, 9, 22, 23]. Over the first year, patients can expect a 47% reduction in their LBP and a 61.1% reduction in their leg pain. Additionally, patients can expect a 47.1% reduction in disability and a 41.7% increase in physical function. This information can provide surgeons guidance in counseling patients on expectations for symptom improvement and return to physical activity following surgery.
This study is not without limitations. Patients were examined with regard to pBP, but whether the pain resulted from central or lateral stenosis was not discussed. However, as the main objective was to determine the difference in LBP and leg pain following MIS LD, this distinction was not essential. Additionally, the assessment of clinical significance was based on reported MCIDs in prior literature. Despite this limitation, the highest MCID observed in the literature was used to limit the risk of inadequate representation.
Our study examined clinical improvement in patients presenting with either pBP or pLP, suggesting greatest improvements in their respective predominant symptom. Similar to our results, Sigmundsson et al. determined that patients with either pBP or pLP experience the greatest relief of their predominant symptom following lumbar decompression or fusion [47]. This was expected, as the location with higher pre-operative pain allows for the greatest potential improvement. Interestingly, in our study, patients with pLP reported greater improvement in leg pain than patients with pBP experienced in back pain. This is likely the result of direct nerve root decompression through interbody placement and restoration of intervertebral height in conjunction with the direct neural decompression at the site of pathology in patients with pLP. Comparatively, pBP is often due to several factors, some of which may not be a target of decompression surgery.
Our results suggest that regardless of presenting symptoms, patients may report significant improvements in disability following MIS LD. In a similar study evaluating outcomes of patients undergoing lumbar decompression, Stienen et al. established that the greatest improvement of back and leg pain is within 6 weeks of surgery, and regardless of predominant symptoms, patients have similar health-related quality-of-life outcomes in the long-term [49]. Interestingly, in our study, patients presenting with pLP experienced greater reductions in disability than those presenting with pBP, though this was not statistically significant. The trend may suggest that leg pain contributes more toward disability than LBP. In theory, a greater number of daily activities may be limited by leg pain that inhibits ambulation, whereas back pain, although bothersome, may be less likely to inhibit these activities. Additionally, patients with back pain may be able to alter movements required to participate in normal daily activities more easily than those with leg pain.
A stronger association between leg pain and disability is further demonstrated in the achievement of MCID between cohorts [4, 7, 8, 34–38, 42]. The majority of patients with pBP or pLP experienced MCIDs in their LBP, leg pain, and disability. Additionally, patients presenting with pLP are more likely to reach MCID for their leg pain and disability compared to patients presenting with pBP. Patients presenting with pBP may be more likely to reach MCID for their back pain than patients presenting with pLP, although these differences did not reach statistical significance. When counseling patients on post-operative expectations, surgeons should convey a realistic degree of improvement following MIS LD.
As the pLP cohort contained a greater percentage of female patients, it is important to analyze the results based on gender [16, 17, 19, 24, 26, 40]. In a retrospective analysis of patients who underwent surgery for lumbar disk herniation, Hakkinen et al. [19] reported females had higher pre-operative VAS back pain and ODI scores, with similar VAS leg pain scores compared to males. Additionally, Hakkinen et al. [19] reported females observed greater reductions in ODI at 6-week follow-up. Alternatively, in a prospective evaluation of patients undergoing lumbar procedures for degenerative disk disease, Gautschi et al. [17] reported females are associated with higher scores on pre-operative VAS back pain, VAS leg pain, and ODI scores compared to males. As with the current study, the authors noted no differences in outcomes by gender at 6-week follow-up. While previous studies may argue a greater percentage of female patients contribute to the difference in leg pain improvement observed between cohorts, the significant back pain improvement in the pBP cohort is not explained by this phenomenon.
Age-related differences have also been examined. Prior studies suggest older age is associated with worse outcomes or has demonstrated no association with outcomes following spinal surgery [29, 32, 45, 48, 50]. In contrast, Cook et al. suggested older age and pLP are predictors for better outcomes [10]. In particular, the authors defined older age as any patient greater than or equal to 52 years old, older than the mean age of both pLP and pBP cohorts. Based on these observations, the outcome differences between cohorts are not likely the result of the pre-operative gender or age differences observed.
The current investigation corroborates the results of several previous studies examining risk factors for poor outcomes following decompression surgery [46]. Kleinstuck et al. [25] demonstrated greater baseline LBP compared to leg pain was the greatest predictor for worse outcomes following decompression. Similarly, the Maine Lumbar Spine Study examined surgical and nonsurgical management of lumbar spinal stenosis; at 4 years post-surgery, 70% of patients experienced improvements in their predominant presenting symptom [3]. However, patients presenting with pBP reported lower rates of satisfaction following surgery compared to those presenting with pLP. Using the Spine Patient Outcomes Research Trial data, Pearson et al. demonstrated greater improvements in leg and back pain, physical function, and disability in patients with pLP compared to those with pBP following decompressive laminectomy [39]. Additionally, in contrast to the current study, the authors of prior studies examined patient populations who underwent an open LD and did not examine the expected extent of LBP or leg pain improvement following surgery.
In conclusion, knowledge of the degree of LBP and leg pain improvement following MIS LD is paramount to counseling a patient on post-operative expectations. Our results suggest that patients experience significant improvements in back and leg pain following MIS LD, regardless of the predominant presenting symptom. Clinically important improvements may be reported in both presenting symptoms; however, a patient with pLP may improve more significantly than a patient with pBP. Patients often experience the majority of their improvement in pain and disability during the first 6 weeks following surgery and can expect a 47% and 61.1% reduction in their VAS back and leg pain scores, respectively, over the first post-operative year. These results may allow surgeons to adequately counsel their patients on the likelihood they will experience a significant reduction in their symptoms following MIS LD.
Electronic supplementary material
(PDF 1224 kb)
(PDF 1224 kb)
(PDF 1224 kb)
(PDF 1224 kb)
(PDF 1224 kb)
(PDF 1224 kb)
(PDF 1225 kb)
Compliance with Ethical Standards
Conflict of Interest
Dustin H. Massel, MD, Dil V. Patel, BS, Philip K. Louie, MD, and Gregory D. Lopez, MD, declare that they have no conflicts of interest. Benjamin C. Mayo, MD, and Daniel D. Bohl, MD, MPH, report grants from the Cervical Spine Research Society, outside the submitted work. Kern Singh, MD, reports royalties from Zimmer, Stryker, Pioneer, Lippincott Williams & Wilkins, Thieme, Jaypee Publishing, and Slack Publishing; stock ownership in Avaz Surgical LLC and Vital 5 LLC; board of director membership and a grant from Cervical Spine Research Society; membership on the board of directors of the International Society for the Advancement of Spine Surgery (ISASS), American Academy of Orthopaedic Surgeons, Scoliosis Research Society, and Vertebral Column of the ISASS, all outside the submitted work.
Human/Animal Rights
All procedures followed were in accordance with the ethical standards of the responsible committee on human experimentation (institutional and national) and with the Helsinki Declaration of 1975, as revised in 2013.
Informed Consent
Informed consent was waived from all patients for being included in this study.
Required Author Forms
Disclosure forms provided by the authors are available with the online version of this article.
Footnotes
Publisher’s Note
Springer Nature remains neutral with regard to jurisdictional claims in published maps and institutional affiliations.
References
- 1.Ang CL, Phak-Boon Tow B, et al. Minimally invasive compared with open lumbar laminotomy: no functional benefits at 6 or 24 months after surgery. Spine J. 2015;15:1705–1712. doi: 10.1016/j.spinee.2013.07.461. [DOI] [PubMed] [Google Scholar]
- 2.Atlas SJ, Deyo RA, Keller RB, et al. The Maine Lumbar Spine Study, Part III. 1-year outcomes of surgical and nonsurgical management of lumbar spinal stenosis. Spine (Phila Pa 1976). 1996;21:1787–1794. [DOI] [PubMed]
- 3.Atlas SJ, Keller RB, Robson D, Deyo RA, Singer DE. Surgical and nonsurgical management of lumbar spinal stenosis: four-year outcomes from the maine lumbar spine study. Spine (Phila Pa 1976). 2000;25:556–562. [DOI] [PubMed]
- 4.Auffinger BM, Lall RR, Dahdaleh NS, et al. Measuring surgical outcomes in cervical spondylotic myelopathy patients undergoing anterior cervical discectomy and fusion: assessment of minimum clinically important difference. PLoS One. 2013;8:e67408. doi: 10.1371/journal.pone.0067408. [DOI] [PMC free article] [PubMed] [Google Scholar]
- 5.Borg-Stein J, Elson L, Brand E. The aging spine in sports. Clin Sports Med. 2012;31:473–486. doi: 10.1016/j.csm.2012.03.002. [DOI] [PubMed] [Google Scholar]
- 6.Burton AK, Clarke RD, McClune TD, Tillotson KM. The natural history of low back pain in adolescents. Spine (Phila Pa 1976). 1996;21:2323–2328. [DOI] [PubMed]
- 7.Carreon LY, Bratcher KR, Canan CE, Burke LO, Djurasovic M, Glassman SD. Differentiating minimum clinically important difference for primary and revision lumbar fusion surgeries. J Neurosurg Spine. 2013;18:102–106. doi: 10.3171/2012.10.SPINE12727. [DOI] [PubMed] [Google Scholar]
- 8.Carreon LY, Glassman SD, Campbell MJ, Anderson PA. Neck Disability Index, short form-36 physical component summary, and pain scales for neck and arm pain: the minimum clinically important difference and substantial clinical benefit after cervical spine fusion. Spine J. 2010;10:469–474. doi: 10.1016/j.spinee.2010.02.007. [DOI] [PubMed] [Google Scholar]
- 9.Choi KC, Kim JS, Kang BU, Lee CD, Lee SH. Changes in back pain after percutaneous endoscopic lumbar discectomy and annuloplasty for lumbar disc herniation: a prospective study. Pain Med. 2011;12:1615–1621. doi: 10.1111/j.1526-4637.2011.01250.x. [DOI] [PubMed] [Google Scholar]
- 10.Cook CE, Frempong-Boadu AK, Radcliff K, Karikari I, Isaacs R. Older age and leg pain are good predictors of pain and disability outcomes in 2710 patients who receive lumbar fusion. HSS J. 2015;11:209215. doi: 10.1007/s11420-015-9456-6. [DOI] [PMC free article] [PubMed] [Google Scholar]
- 11.Copay AG, Glassman SD, Subach BR, Berven S, Schuler TC, Carreon LY. Minimum clinically important difference in lumbar spine surgery patients: a choice of methods using the Oswestry Disability Index, Medical Outcomes Study questionnaire Short Form 36, and pain scales. Spine J. 2008;8:968–974. [DOI] [PubMed]
- 12.Eloqayli H, Al-omari M. Percutaneous discectomy: minimally invasive method for treatment of recurrent lumbar disc herniation. Clin Neurol Neurosurg. 2012;114:871–875. doi: 10.1016/j.clineuro.2012.01.015. [DOI] [PubMed] [Google Scholar]
- 13.Fairbank JC, Pynsent PB: The Oswestry Disability Index. Spine (Phila Pa 1976). 2000;25:2940–2952. [DOI] [PubMed]
- 14.Fritz JM, Delitto A, Welch WC, Erhard RE. Lumbar spinal stenosis: a review of current concepts in evaluation, management, and outcome measurements. Arch Phys Med Rehabil. 1998;79:700–708. [DOI] [PubMed]
- 15.Gadjradj PS, van Tulder MW, Dirven CM, Peul WC, Harhangi BS. Clinical outcomes after percutaneous transforaminal endoscopic discectomy for lumbar disc herniation: a prospective case series. Neurosurg Focus. 2016;40:E3. [DOI] [PubMed]
- 16.Gautschi OP, Corniola MV, Smoll NR, et al. Sex differences in subjective and objective measures of pain, functional impairment, and health-related quality of life in patients with lumbar degenerative disc disease. Pain. 2016;157:1065–1071. doi: 10.1097/j.pain.0000000000000480. [DOI] [PubMed] [Google Scholar]
- 17.Gautschi OP, Smoll NR, Corniola MV, et al. Sex differences in lumbar degenerative disc disease. Clin Neurol Neurosurg. 2016;145:52–57. doi: 10.1016/j.clineuro.2016.04.008. [DOI] [PubMed] [Google Scholar]
- 18.German JW, Adamo MA, Hoppenot RG, Blossom JH, Nagle HA. Perioperative results following lumbar discectomy: comparison of minimally invasive discectomy and standard microdiscectomy. Neurosurg Focus. 2008;25:E20. doi: 10.3171/FOC/2008/25/8/E20. [DOI] [PubMed] [Google Scholar]
- 19.Hakkinen A, Kautiainen H, Jarvenpaa S, Arkela-Kautiainen M, Ylinen J. Changes in the total Oswestry Index and its ten items in females and males pre- and post-surgery for lumbar disc herniation: a 1-year follow-up. Eur Spine J.. 2007;16:347–352. [DOI] [PMC free article] [PubMed]
- 20.Huang P, Anissipour A, McGee W, Lemak L. Return-to-play recommendations after cervical, thoracic, and lumbar spine injuries: a comprehensive review. Sports Health. 2016;8:19–25. doi: 10.1177/1941738115610753. [DOI] [PMC free article] [PubMed] [Google Scholar]
- 21.Jarvik JG, Deyo RA. Diagnostic evaluation of low back pain with emphasis on imaging. Ann Intern Med. 2002;137:586–597. doi: 10.7326/0003-4819-137-7-200210010-00010. [DOI] [PubMed] [Google Scholar]
- 22.Khajavi K, Shen A, Hutchison A. Substantial clinical benefit of minimally invasive lateral interbody fusion for degenerative spondylolisthesis. Eur Spine J. 2015;24 Suppl 3:314–321. [DOI] [PubMed]
- 23.Khajavi K, Shen AY. Two-year radiographic and clinical outcomes of a minimally invasive, lateral, transpsoas approach for anterior lumbar interbody fusion in the treatment of adult degenerative scoliosis. Eur Spine J. 2014;23:1215–1223. [DOI] [PubMed]
- 24.Kim HJ, Suh BG, Lee DB, et al. Gender difference of symptom severity in lumbar spinal stenosis: role of pain sensitivity. Pain Physician. 2013;16:E715–723. [PubMed] [Google Scholar]
- 25.Kleinstuck FS, Grob D, Lattig F, et al. The influence of preoperative back pain on the outcome of lumbar decompression surgery. Spine (Phila Pa 1976). 2009;34:1198–1203. [DOI] [PubMed]
- 26.Konstantinou K, Dunn KM, Ogollah R, Vogel S, Hay EM, ATLAS study research team. Characteristics of patients with low back and leg pain seeking treatment in primary care: baseline results from the ATLAS cohort study. BMC Musculoskelet Disord. 2015;16:332. [DOI] [PMC free article] [PubMed]
- 27.Lee P, Liu JC, Fessler RG. Perioperative results following open and minimally invasive single-level lumbar discectomy. J Clin Neurosci. 2011;18:1667–1670. doi: 10.1016/j.jocn.2011.04.004. [DOI] [PubMed] [Google Scholar]
- 28.Majeed SA, Vikraman CS, Mathew V, Anish TS. Comparison of outcomes between conventional lumbar fenestration discectomy and minimally invasive lumbar discectomy: an observational study with a minimum 2-year follow-up. J Orthop Surg Res. 2013;8:34. doi: 10.1186/1749-799X-8-34. [DOI] [PMC free article] [PubMed] [Google Scholar]
- 29.Mallen CD, Peat G, Thomas E, Dunn KM, Croft PR. Prognostic factors for musculoskeletal pain in primary care: a systematic review. Br J Gen Pract. 2007;57:655–661. [PMC free article] [PubMed] [Google Scholar]
- 30.Mathews HH, Long BH. Minimally invasive techniques for the treatment of intervertebral disk herniation. J Am Acad Orthop Surg. 2002;10:80–85. doi: 10.5435/00124635-200203000-00003. [DOI] [PubMed] [Google Scholar]
- 31.Meucci RD, Fassa AG, Faria NM. Prevalence of chronic low back pain: systematic review. Rev Saude Publica. 2015;49:1. doi: 10.1590/S0034-8910.2015049005874. [DOI] [PMC free article] [PubMed] [Google Scholar]
- 32.Ohtori S, Ito T, Yamashita M, et al. Evaluation of low back pain using the Japanese Orthopaedic Association Back Pain Evaluation Questionnaire for lumbar spinal disease in a multicenter study: differences in scores based on age, sex, and type of disease. J Orthop Sci. 2010;15:86–91. [DOI] [PubMed]
- 33.Olsen TL, Anderson RL, Dearwater SR, et al. The epidemiology of low back pain in an adolescent population. Am J Public Health. 1992;82:606–608. doi: 10.2105/ajph.82.4.606. [DOI] [PMC free article] [PubMed] [Google Scholar]
- 34.Parker SL, Adogwa O, Mendenhall SK, et al. Determination of minimum clinically important difference (MCID) in pain, disability, and quality of life after revision fusion for symptomatic pseudoarthrosis. Spine J. 2012;12:1122–1128. doi: 10.1016/j.spinee.2012.10.006. [DOI] [PubMed] [Google Scholar]
- 35.Parker SL, Adogwa O, Paul AR, et al. Utility of minimum clinically important difference in assessing pain, disability, and health state after transforaminal lumbar interbody fusion for degenerative lumbar spondylolisthesis. J Neurosurg Spine. 2011;14:598–604. doi: 10.3171/2010.12.SPINE10472. [DOI] [PubMed] [Google Scholar]
- 36.Parker SL, Godil SS, Mendenhall SK, Zuckerman SL, Shau DN, McGirt MJ. Two-year comprehensive medical management of degenerative lumbar spine disease (lumbar spondylolisthesis, stenosis, or disc herniation): a value analysis of cost, pain, disability, and quality of life: clinical article. J Neurosurg Spine. 2014;21:143–149. doi: 10.3171/2014.3.SPINE1320. [DOI] [PubMed] [Google Scholar]
- 37.Parker SL, Godil SS, Shau DN, Mendenhall SK, McGirt MJ. Assessment of the minimum clinically important difference in pain, disability, and quality of life after anterior cervical discectomy and fusion: clinical article. J Neurosurg Spine. 2013;18:154–160. doi: 10.3171/2012.10.SPINE12312. [DOI] [PubMed] [Google Scholar]
- 38.Parker SL, Mendenhall SK, Shau DN, et al. Minimum clinically important difference in pain, disability, and quality of life after neural decompression and fusion for same-level recurrent lumbar stenosis: understanding clinical versus statistical significance. J Neurosurg Spine. 2012;16:471–478. doi: 10.3171/2012.1.SPINE11842. [DOI] [PubMed] [Google Scholar]
- 39.Pearson A, Blood E, Lurie J, et al. Predominant leg pain is associated with better surgical outcomes in degenerative spondylolisthesis and spinal stenosis: results from the Spine Patient Outcomes Research Trial (SPORT). Spine (Phila Pa 1976). 2011;36:219–229. [DOI] [PMC free article] [PubMed]
- 40.Phan K, Mobbs RJ. Minimally invasive versus open laminectomy for lumbar stenosis: a systematic review and meta-analysis. Spine (Phila Pa 1976). 2016;41:E91–E100. [DOI] [PubMed]
- 41.Phan K, Thayaparan GK, Mobbs RJ. Anterior lumbar interbody fusion versus transforaminal lumbar interbody fusion—systematic review and meta-analysis. Br J Neurosurg. 2015;29:705–711. doi: 10.3109/02688697.2015.1036838. [DOI] [PubMed] [Google Scholar]
- 42.Pool JJ, Ostelo RW, Hoving JL, Bouter LM, de Vet HC. Minimal clinically important change of the Neck Disability Index and the Numerical Rating Scale for patients with neck pain. Spine (Phila Pa 1976). 2007;32:3047–3051. [DOI] [PubMed]
- 43.Rao PJ, Loganathan A, Yeung V, Mobbs RJ. Outcomes of anterior lumbar interbody fusion surgery based on indication: a prospective study. Neurosurgery. 2015;76:7–23. doi: 10.1227/NEU.0000000000000561. [DOI] [PubMed] [Google Scholar]
- 44.Rasouli MR, Rahimi-Movaghar V, Shokraneh F, Moradi-Lakeh M, Chou R. Minimally invasive discectomy versus microdiscectomy/open discectomy for symptomatic lumbar disc herniation. Cochrane Database Syst Rev. 2014;CD010328. [DOI] [PMC free article] [PubMed]
- 45.Scheer JK, Mundis GM, Klineberg E, et al. Postoperative recovery after adult spinal deformity surgery: comparative analysis of age in 149 patients during 2-year follow-up. Spine (Phila Pa 1976). 2015;40:1505–1515. [DOI] [PubMed]
- 46.Scheer JK, Smith JS, Clark AJ, et al. Comprehensive study of back and leg pain improvements after adult spinal deformity surgery: analysis of 421 patients with 2-year follow-up and of the impact of the surgery on treatment satisfaction. J Neurosurg Spine. 2015;22:540–553. doi: 10.3171/2014.10.SPINE14475. [DOI] [PubMed] [Google Scholar]
- 47.Sigmundsson FG, Jonsson B, Stromqvist B. Outcome of decompression with and without fusion in spinal stenosis with degenerative spondylolisthesis in relation to preoperative pain pattern: a register study of 1,624 patients. Spine J. 2015;15:638–646. doi: 10.1016/j.spinee.2014.11.020. [DOI] [PubMed] [Google Scholar]
- 48.Sobottke R, Herren C, Siewe J, Mannion AF, Roder C, Aghayev E. Predictors of improvement in quality of life and pain relief in lumbar spinal stenosis relative to patient age: a study based on the Spine Tango registry. Eur Spine J. 2017;26:462–472. [DOI] [PubMed]
- 49.Stienen MN, Joswig H, Smoll NR, et al. Short- and long-term outcome of microscopic lumbar spine surgery in patients with predominant back or predominant leg pain. World Neurosurg. 2016;93:458–465. doi: 10.1016/j.wneu.2016.06.120. [DOI] [PubMed] [Google Scholar]
- 50.Than KD, Park P, Fu KM, et al. Clinical and radiographic parameters associated with best versus worst clinical outcomes in minimally invasive spinal deformity surgery. J Neurosurg Spine. 2016;25:21–25. doi: 10.3171/2015.12.SPINE15999. [DOI] [PubMed] [Google Scholar]
- 51.Vilagut G, Forero CG, Pinto-Meza A, et al. The mental component of the short-form 12 health survey (SF-12) as a measure of depressive disorders in the general population: results with three alternative scoring methods. Value Health. 2013;16:564–573. doi: 10.1016/j.jval.2013.01.006. [DOI] [PubMed] [Google Scholar]
- 52.Ware J, Kosinski M, Keller SD. A 12-item Short-Form Health Survey: construction of scales and preliminary tests of reliability and validity. Med Care. 1996;34:220–233. doi: 10.1097/00005650-199603000-00003. [DOI] [PubMed] [Google Scholar]
Associated Data
This section collects any data citations, data availability statements, or supplementary materials included in this article.
Supplementary Materials
(PDF 1224 kb)
(PDF 1224 kb)
(PDF 1224 kb)
(PDF 1224 kb)
(PDF 1224 kb)
(PDF 1224 kb)
(PDF 1225 kb)