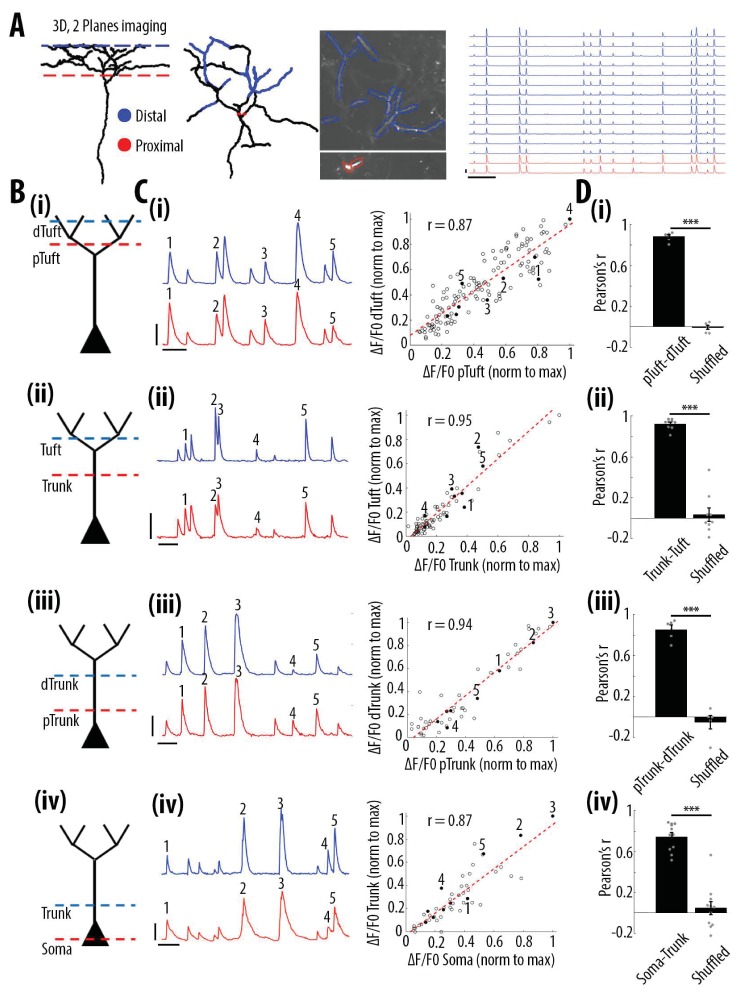
Figure 2. High correlation of calcium transients between neuronal compartments (soma, trunk, apical tuft) of individual layer 5 neurons.
(A) Anatomical reconstruction of an individual GCaMP6s-labeled layer 5 pyramidal neuron imaged at two focal planes semi-simultaneously (red dotted lines, proximal; blue, distal). Left panel, coronal and horizontal views of the same imaged neuron. Right panel, two-photon image of dendritic branches highlighted in red and blue in the horizontal view of the anatomical reconstruction. Example ΔF/F0 traces of highly correlated calcium transients from dendritic branches indicated in red and blue. (B) Schemata of the compartments imaged semi-simultaneously, (i) proximal tuft-distal tuft, (ii) trunk-tuft, (iii), trunk-trunk, (iv) soma-trunk. pTrunk, dTrunk and pTuft, dTuft indicate proximal and distal portions of the trunk and the apical tuft, respectively. (C) Left panel, representative GCaMP6s transients imaged in two neuronal compartments semi-simultaneously as shown in B. Right panel, scatter plot of peak amplitudes of individual calcium transients in proximal and distal compartments imaged semi-simultaneously, in one example individual neuron. Each dot represents a calcium transient. Peak amplitudes were normalized to the maximum amplitude in each compartment. Filled dots correspond to the transients indicated by numbers in the left panel. Red dotted line indicates the best fit (least square). Pearson’s correlation values (r) are indicated for each example pair of neuronal compartments. Scale bars 0.3 ΔF/F0 (normalised to max), 10 s. (D) Pearson’s correlation values for each pair of compartments imaged semi-simultaneously and corresponding shuffled data (Paired t-test, (i)pTuft-dTuft, p=1.6e−6, mean = 0.88; −0.01, sem = 0.02; 0.02, n = 6 pairs; (ii)Trunk-Tuft, p=8e−7, mean = 0.92; 0.04, sem = 0.02; 0.07, n = 9; (iii) pTrunk-dTrunk, p=4.4e−4, mean = 0.85; −0.05, sem = 0.05; 0.07, n = 5; (iv) Soma-Trunk, p=4.4e−6, mean = 0.74; 0.05, sem = 0.04; 0.06, n = 11).


