Summary
Pyrethroid-impregnated bednets have driven significant reductions in malaria morbidity and mortality in Africa since the beginning of the century 1. The intense selection pressure exerted by bednets has precipitated widespread and escalating pyrethroid resistance in African Anopheles populations, threatening to reverse gains made by malaria control 2. Here we show that a leg-enriched sensory appendage protein, SAP2, confers pyrethroid resistance in Anopheles gambiae. SAP2 expression is elevated in insecticide-resistant populations and is further induced upon mosquito contact with pyrethroids. SAP2 silencing fully restores mosquito mortality, whilst its overexpression results in increased resistance, likely due to the high-affinity SAP2 binding to pyrethroid insecticides. Mining of genome sequence data reveals a selective sweep near the SAP2 locus in three West African countries, with the observed increase in haplotype associated SNPs mirroring increasing resistance reported in Burkina Faso. Our study identifies a new insecticide resistance mechanism that is likely highly relevant to malaria control efforts.
Background
Anopheline mosquitoes are the only genus capable of transmitting human malaria. Targeting the mosquito has proven to be the most effective means of reducing the incidence of malaria, and the massive scale up of insecticide-based interventions, most notably long-lasting insecticidal nets (LLINs), has driven the dramatic reductions in malaria cases in Africa in the 21st century 1. However, worryingly, after many years of progress, gains in malaria control are now stalling, with an estimated 219 million cases and 435 000 malaria associated deaths across Africa in 2017 prompting a re-examination of the effectiveness of the primary prevention tools 2. LLINs have proven so effective in preventing malaria because they not only provide personal protection to LLIN users by reducing biting by the night feeding Anopheles mosquitoes, but they also have a community effect, whereby contact with the insecticide decreases the likelihood that mosquitoes will survive long enough for the Plasmodium parasite development and transmission 3. The scale up of LLINs has exerted intense selection pressure on Anopheles vectors to develop resistance to pyrethroids, the insecticide class used to treat all LLINs, and as a result, the community effect of LLINs is being eroded 4. To mitigate against catastrophic failure of insecticide-based vector control tools, the resistance mechanisms must be identified and targeted. Successful management of insecticide resistance has been demonstrated by trials of pyrethroid nets containing the synergist piperonyl butoxide (PBO) 5, a potent inhibitor of metabolic resistance caused by cytochrome P450s, one of the most widespread, and hitherto most potent, resistance mechanisms 6,7. By blocking this resistance mechanism, PBO-pyrethroid nets restore insecticide susceptibility, leading to a reduction in malaria cases in areas where metabolic resistance prevails 5.
Although PBO-pyrethroid nets are now replacing standard pyrethroid-only nets in many sites across Africa 8, not all pyrethroid resistant populations can be effectively targeted by this synergist 8,9 as additional mechanisms are contributing to the resistance phenotype. Recently, using a meta-analysis approach of transcriptomic data from pyrethroid resistant An. gambiae populations from across Africa, we identified multiple new resistance mechanisms, including up-regulation of putative insecticide binding proteins 10. By screening this transcriptomic data from Burkina Faso and Côte d’Ivoire, areas with particularly high pyrethroid resistance and low PBO synergism 9,11, we found that one family of binding proteins, the sensory appendage proteins, were particularly highly overexpressed in these populations (Extended Data Table 1).
Sensory appendage proteins are members of the chemosensory protein (CSP) family, small soluble proteins found only in arthropods 12 that function in the transport of hydrophobic compounds through the sensillum lymph 13. Eight CSP genes are present in the genome of Anopheles gambiae seven of which are clustered on chromosome 3R (Extended Data Figure 1). Four members of this family have previously been expressed in vitro and shown to bind aromatic compounds 14. Members of the CSP family have been shown to be induced by insecticide exposure, for example by avermectin in the silkworm Bombyx mori 15, pyrethroids in the diamondback moth Putella xylostella 16 and noenicitinoids in the whitefly Bemiscia tabaci 17.
CSP expression and localisation
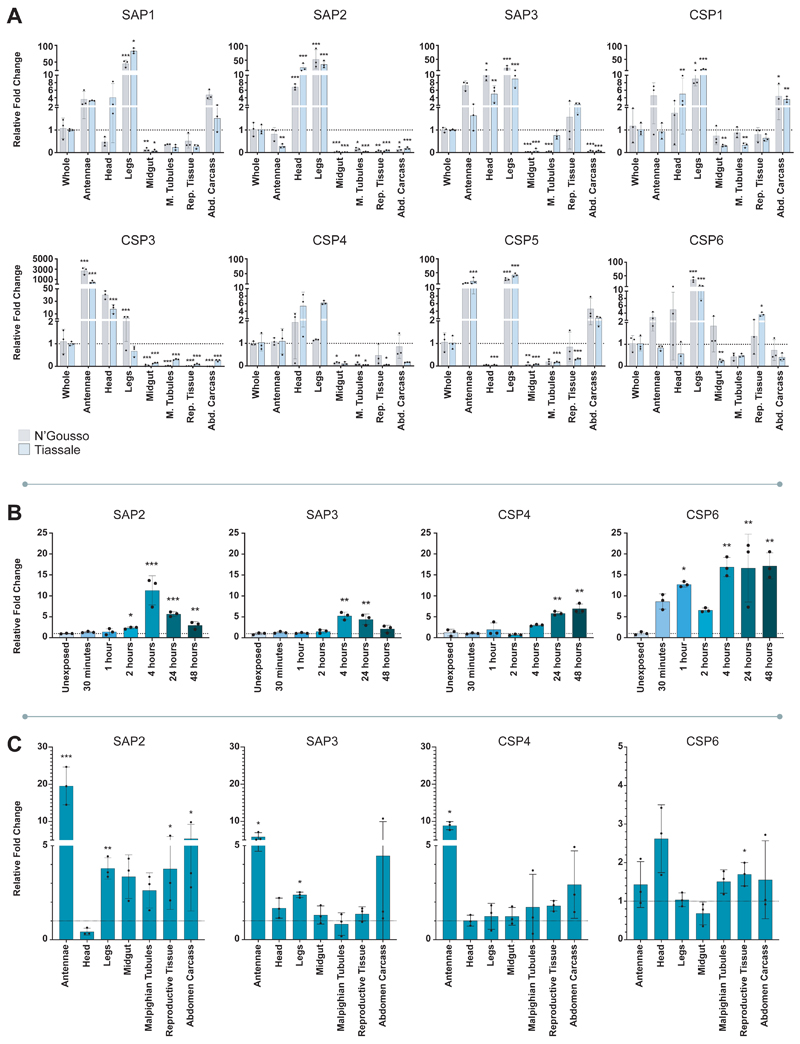
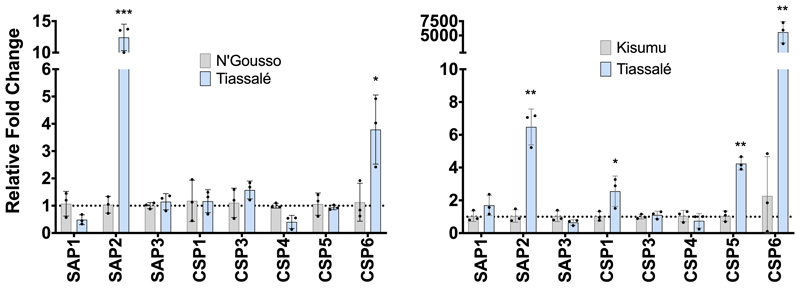
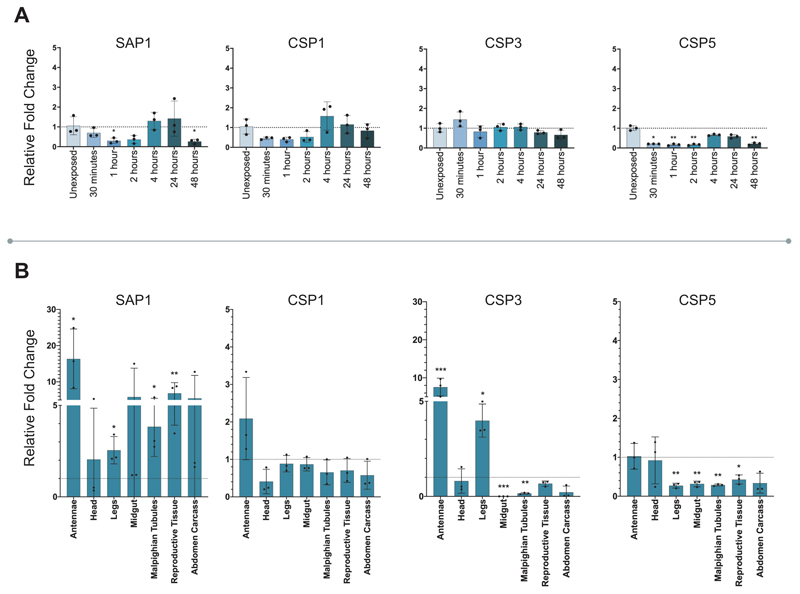
To determine whether elevated CSP expression was associated with pyrethroid resistance in An. gambiae we characterised the expression of all eight members of the family in females of a multi-resistant laboratory colony originally from Côte d’Ivoire (Tiassalé). We observed two CSPs, SAP2 (AGAP008052) and CSP6 (AGAP001303), with significantly higher constitutive expression when compared to two separate susceptible controls (Extended Data Figure 2). We next determined localisation of CSP expression in multiple tissues, including body areas that are the primary points of mosquito contact with LLINs: the legs, head and antennae; the major detoxification tissues: the Malpighian tubules and the midgut; the reproductive tissues; and remaining abdominal carcass (Figure 1A). Six of the eight CSPs, including both SAP2 and CSP6, were enriched in the legs in both Anopheles populations, two of the CSPs were enriched in the head (SAP2 and SAP3 (AGAP008054)); two in the antennae (CSP3 (AGAP008055) and CSP5 (AGAP008058)) and one in the abdomen carcass (CSP1 (AGAP008059)).
Figure 1. CSP expression profiles.
A. Constitutive expression of CSPs in resistant and susceptible strains. mRNA localisation in antennae, head, legs, midgut, Malpighian tubules, reproductive tissue and the remaining abdominal tissues (abdomen carcass) in N’Gousso (grey) and Tiassalé (blue) for each member of the CSP family compared to whole body. B. Induction of CSPs in Tiassalé following pyrethroid exposure. Four CSPs show significant induction of mRNA expression at different time points post-exposure to the pyrethroid insecticide deltamethrin in Tiassalé (results for the non-induced CSPs are shown in Extended Data Figure 3a). C. Tissue-specific profile of CSPs induction in Tiassalé. Tissue-specific induction for the four significantly induced CSPs in the Tiassalé strain, shown 4-hours post deltamethrin exposure, each data point shows exposed compared to unexposed tissues from the same generation (see Extended Data Figure 3b for remaining CSPs). The qPCR data show mean ± standard deviation of three biological replicates. * p ≤ 0.05; ** p ≤ 0.01; *** p ≤ 0.001. Statistical significance was calculated by an ANOVA followed by Dunnett’s post hoc test; where normalisation was not possible, data was analysed using Kruskall-Wallis followed by a Dunn’s post hoc test in A. and B. In C. significance was calculated by a two-tailed t-test; p-values are provided in Supplementary Table 2; n = 3 for each replicate.
We performed a time course to determine whether any of the eight CSPs were induced by exposure to pyrethroids in the resistant strain (Figure 1B; Extended Data Figure 3a) and found that four of the eight CSPs were significantly induced by deltamethrin, the pyrethroid most widely used in LLINs, including the constitutively overexpressed SAP2 and CSP6, in addition to SAP3 and CSP4 (AGAP008062) (Figure 1B). Examining the tissue specificity of the induction 4-hours post-exposure showed SAP2, SAP1 (AGAP008051) and CSP3 as induced in multiple tissues, including the legs, whilst CSP4, CSP6 and CSP1 show induction in a single tissue (Figure 1C; Extended Data Figure 3B).
Evidence CSPs confer resistance
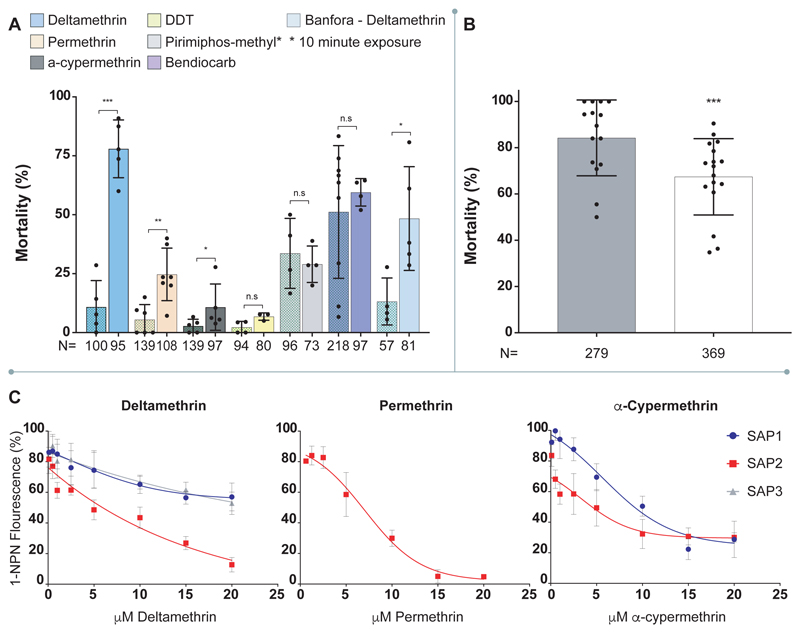
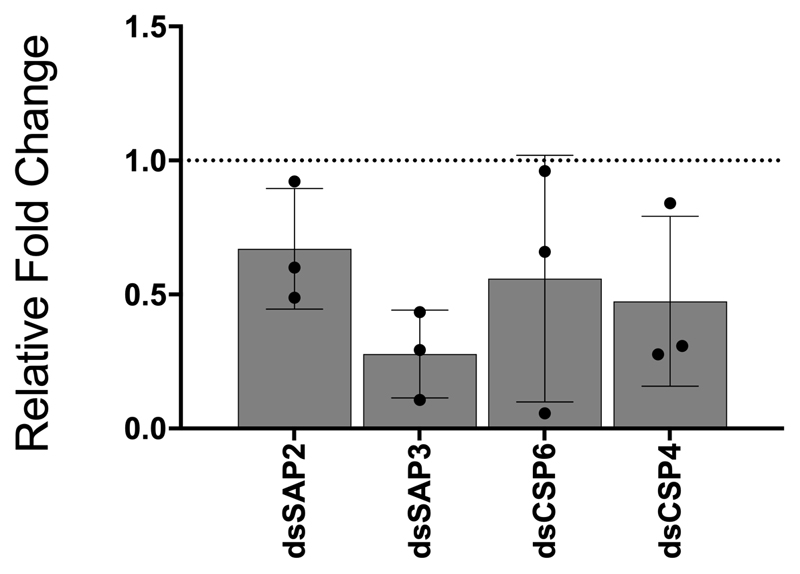
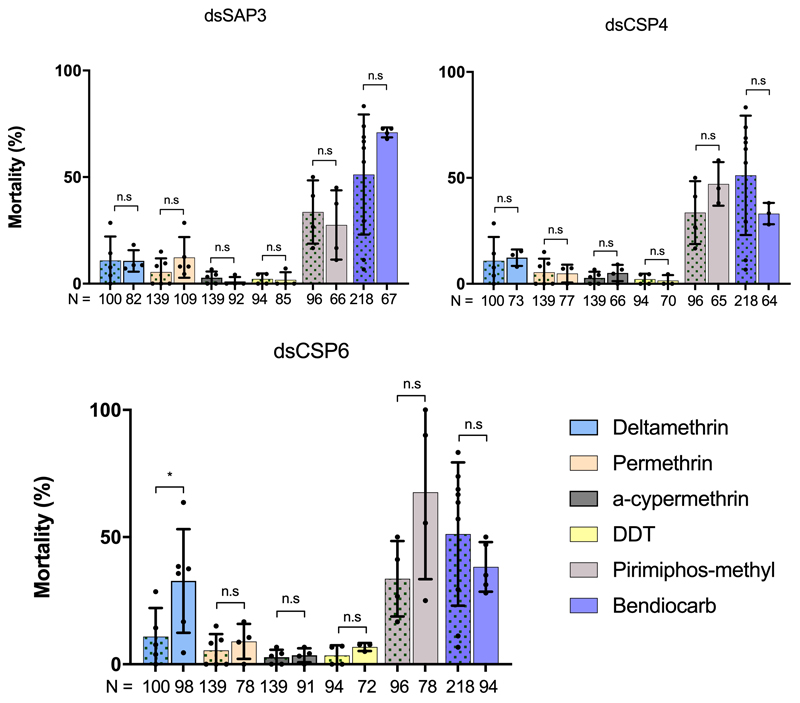
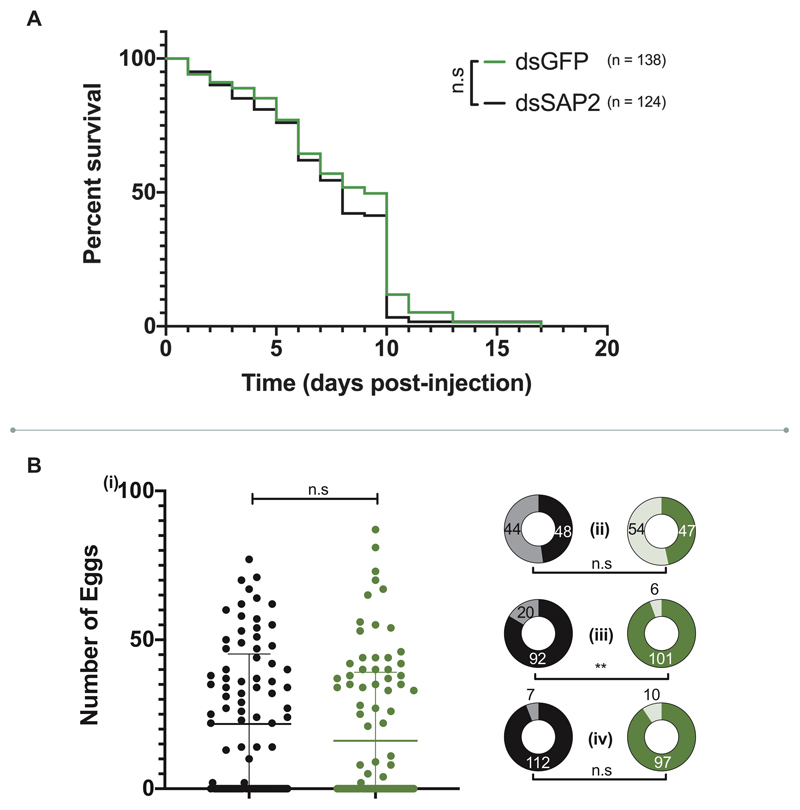
Having established that CSPs are highly overexpressed in the appendages of pyrethroid resistant mosquitoes, and expression of a subset of this family is further induced by insecticide exposure, we next performed RNAi silencing of these CSPs (Extended Data Figure 4) in females from the highly pyrethroid resistant Tiassalé colony before exposing them to a panel of insecticide classes (pyrethroids, carbamates and organophosphates) widely used in public health. Strikingly, SAP2 silencing almost completely restored susceptibility to the pyrethroid deltamethrin, whilst also significantly increasing the susceptibility to the other two pyrethroids permethrin and α-cypermethrin used in these analyses (Figure 2A). No change in mortality was observed after exposure to the other insecticide classes, indicating pyrethroid specificity of the mechanism. We further explored this striking phenotype in a second multi-resistant population from Burkina Faso (Banfora) and again found mortality was significantly restored after exposure to deltamethrin (Figure 2A). Knock down of the other three CSPs had no effect on mortality to any insecticide class, except in the case of CSP6 knockdown which also significantly increased susceptibility to deltamethrin in Tiassalé mosquitoes, although not to the same extent as SAP2 (Extended Data Figure 5). Conversely, over-expression of SAP2 in an insecticide susceptible population (Extended Data Figure 6) significantly increased pyrethroid resistance, directly linking the function of this protein to insecticide resistance (Figure 2B). To check for adverse changes to the life history traits due to disrupting SAP2 expression, we recorded the survivorship, blood feeding ability and egg production in dsSAP2 injected females and found no significant changes compared to a GFP-injected control, indicating the mortality observed is due to a direct effect of SAP2 on the insecticide and not reduced overall fitness (Extended Data Figure 7).
Figure 2. SAP2 mediates resistance to pyrethroid insecticides.
A. Effect of SAP2 knock down on mortality in multi-resistant Anopheles populations in response to a panel of insecticides (rightmost bar) compared to GFP-injected controls (leftmost bar; patterned). Tiassalé: Deltamethrin (blue; nGFP;SAP2 = 5;5); Permethrin (pink; nGFP;SAP2 = 6;7); α-cypermethrin (dark grey; nGFP;SAP2 = 5;5); DDT (yellow; nGFP;SAP2 = 4;3), primiphos-methyl (light grey; nGFP;SAP2 = 4;4) and Bendiocarb (dark blue nGFP;SAP2 = 9;4). Banfora: Deltamethrin (light blue; nGFP;SAP2 = 4;5). N represents the total number of females used across all replicates. B. Transgenic over-expression of SAP2 in susceptible G3 mosquitoes reduces mortality after permethrin exposure. Bars represent control (grey; n = 15) and SAP2 overexpression (white; n = 17). N represents the total number of females used across all replicates. C. Competitive binding assays of the three SAP proteins to three pyrethroid insecticides. Only instances with binding shown; no binding for: SAP3 nor SAP1 with permethrin; SAP3 with α-cypermethrin; any SAP with bendiocarb or pirimiphos-methyl. The data show mean ± standard deviation. * p ≤ 0.05; ** p ≤ 0.01; *** p ≤ 0.001; ns p > 0.05. Statistical significance in 2A and 2B calculated by an ANOVA test followed by a Tukey post hoc test; p-values are provided in Supplementary Table 2
To determine a putative mode of action whereby a chemosensory protein could confer resistance, we next investigated whether these proteins act as pyrethroid binding proteins. We heterologously expressed SAP2 and two closely related CSPs (SAP1 and SAP3) in E. coli and carried out competitive binding assays with the fluorescent marker N-phenyl-1-naphthylamine and a panel of insecticides (Figure 2C). SAP2 bound to all three pyrethroid insecticides tested: deltamethrin (IC50 = 3.99μM); permethrin (IC50 = 4.77μM); and α-cypermethrin (IC50 = 3.74μM) but did not bind pirimiphos-methyl (organophosphate) or bendiocarb (a carbamate). The IC50 values were similar to those found for the most important cytochrome p450s responsible for metabolic clearance of pyrethroid insecticides 6,7 (deltamethrin IC50, CYP6M2; CYP6P3 = 4.24μM; 3.17 μM, permethrin IC50, CYP6M2; CYP6P3 = 8.07μM; 6.77μM 18). The binding of the pyrethroids to SAP2 had significantly higher specificity (pANOVA < 0.0001) than the other SAP proteins; however, both SAP1 and SAP3 bound weakly to deltamethrin (IC50 > 10μM) and SAP1 moderately to α-cypermethrin (IC50 = 9.02μM).
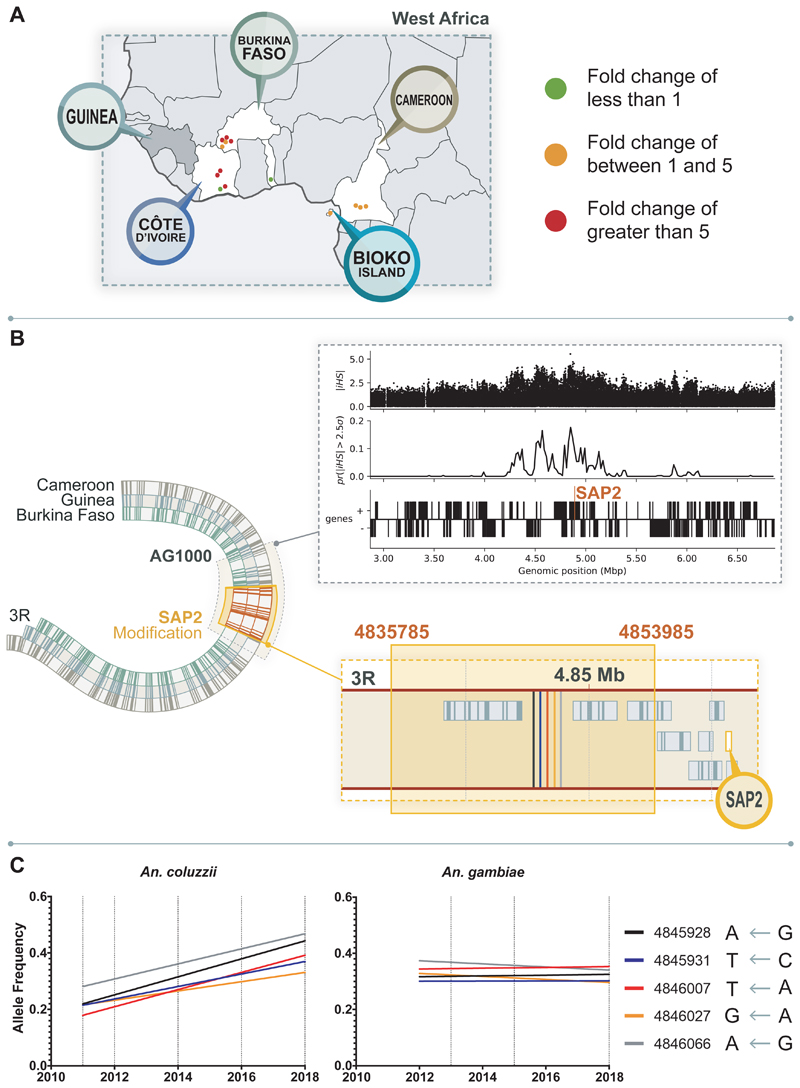
Having established the importance of SAP2 to pyrethroid resistance in a lab setting, and detected the over-expression of this transcript in available transcriptomic data from multiple resistant West African field populations (Figure 3A; Extended Data Table 1), we next looked for any evidence of selection at this locus, utilising data from the An. gambiae 1000 genomes project 19 and further de novo sequencing. We computed the selection statistics iHS 20 and XPEHH 21 from 1142 wild caught An. gambiae 19 in the region surrounding the CSP cluster on chromosome 3R (Figure 3B). Evidence for a selective sweep at this locus was observed in An. gambiae from Guinea and Burkina Faso. The swept haplotype is present at low frequency but there is evidence of haplotype sharing between Guinea, Burkina Faso and Cameroon. We next identified SNPs diagnostic of the derived haplotype in this selective sweep (Figure 3B) and sequenced this region in individual mosquitoes collected from the Banfora region of Burkina Faso from 2011 to 2018. This haplotype was stable in frequency in An. gambiae s.s., indicating that this sweep occurred before the Anopheles 1000 genomes collections in 2012 and pre-dating our collection dates (Figure 3C; Supplementary Table 1). Conversely, An. coluzzii samples collected from 2011 to 2018 showed a large increase in frequency of the SNPs associated with the sweep (Figure 3C; Supplementary Table 1) and this corresponded with a sharp increase in the prevalence of pyrethroid resistance occurring over this time period (Extended Data Figure 8).
Figure 3. SAP2 is up-regulated and under selection in multiple countries across West Africa.
A. Points represent significantly differential expression of SAP2 in pyrethroid resistant mosquitoes in two sister species (An. coluzzii or An. gambiae) compared to susceptible populations (Extended Table 1, from 10). Significant (plimma;BH-corrected10 ≤ 0.05) fold changes are represented by a traffic light system. Countries with SAP2 either (i) significantly up-regulated and/or (ii) involved in the selective sweep are highlighted with a pin. No transcriptomic data is available for Guinea. Map created expressly for this manuscript by Manuela Bernardi. B. Schematic representation of the range of the selective sweep found in Guinea, Burkina Faso and Cameroon with selective sweep found across these regions in the Anopheles 1000 genomes highlighted in grey 19. Observed iHS signal from Guinea is shown as follows, from top to bottom panels: Raw iHS statistics per SNP, normalised by chromosome in allele frequency bins; summarised iHS in windows of 20kbp by proportion of SNPs exceeding 2.5 standard deviations 20; and genes in this region with SAP2 annotated. Highlighted in yellow are the range of the 55 SNPs tagging this haplotype across the three countries. A zoomed in area shows the approximate location of the five haplotype tagging SNPs in proximity to SAP2 (more detail in Extended Data Figure 1A). (C) Fitted trend in frequency of the derived haplotype associated SNPs in field populations from Burkina Faso: (i) An. coluzzii populations collected from Tengrela from 2011 to 2018 and (ii) An. gambiae s.s. samples collected in 2013 and 2015 from Bakaridjan, Burkina Faso and 2018 from Tiefora, Burkina Faso. Dates when samples were sequenced are indicated by a dotted line. SNP data is shown in the legend, including the locus and the alternate allele (left) and PEST allele (right).
Discussion
Our results show that SAP2, a chemosensory protein with no previous known function in insecticide resistance, has a key role in conferring pyrethroid resistance in the An. gambiae species complex via the binding of insecticides at the first point of mosquito contact with bednets. When elevated SAP2 expression was introduced into an otherwise susceptible background, the transgenic line was more resistant to pyrethroids but the phenotype was less dramatic than seen in the SAP2 knock down lines, perhaps indicating that SAP2 acts in conjunction with other resistance mechanism to provide an additive effect. Given its strong binding to pyrethroid insecticides, it is possible that SAP2 acts by sequestering the insecticide directly, thereby either preventing insecticide function on the nervous system or facilitating its detoxification. Crucially, longitudinal sequencing of field samples and available transcriptomic data from wild collections show that this mechanism is being selected for in multiple countries in West Africa, highlighting its relevance in field settings. Nationwide distribution of LLINs has not impacted malaria transmission in Burkina Faso, where cases continue to rise annually 22. Our finding of a potent new mechanism that has rapidly swept across Anopheline populations in this region will help address the contribution of insecticide resistance to the persistence of malaria, while the identification of the corresponding SNPs will facilitate tracking its spread. Finally, the identification of this novel insecticide sequestration mechanism offers the concrete possibility to restore the effectiveness of pyrethroid insecticides in natural mosquito populations through identifying new targets for inhibitors for bed net incorporation, in an analogous manner to the incorporation of PBO into nets, a factor that may prove critical in the path to malaria elimination across Africa.
Methods
Mosquito strains
The populations, each belonging to An. gambiae species complex, used in these experiments were reared and maintained at the Liverpool School of Tropical Medicine (LSTM), under standard insectary conditions at 27°C, 70-80% humidity, under a 12:12 hour photoperiod. Both the Tiassalé (An. gambiae s.l.) strain from Côte D'Ivoire 11, and the Banfora strain (An. coluzzii) from Burkina Faso 24 are insecticide resistant populations and have been maintained under insecticide pressure since colonisation in 2009 and 2014 respectively. The lab susceptible populations N’Gousso (An. coluzzii) 25, Kisumu (An. gambiae s.s.) and G3 (An. gambiae s.l.) originate from Cameroon, Kenya and The Gambia respectively. An. gambiae s.l. here refers to a mixture of An. gambiae and An. coluzzii.
RNAi
PCR was performed on Tiassalé cDNA using Phusion® High-Fidelity DNA Polymerase (Thermo Scientific, UK) following manufacturer’s instructions and primer sets with a T7 docking sequence at the 5' end of both the sense and antisense primers. Primers were designed using NCBI Primer BLAST to produce an asymmetric product with a length of 300-600bp, a GC content of 20-50% and no more than three consecutive equivalent nucleotides (Supplementary Table 3). PCR was performed with the following cycle: three minutes 98°c, 35 cycles of seven seconds at 98°c, 7 seconds at calculated Tm and 10 seconds at 72°c, with a final hold at 72°c for seven minutes. PCR products were purified using a Qiagen QIAquick PCR Purification kit following manufacturer’s instructions. dsRNA was synthesised using a Megascript® T7 Transcription (Ambion, UK) kit, with a 16-hour 37°c incubation, following manufacturer's instructions. The dsRNA was cleaned using a MegaClear® Transcription Clear Up (Ambion, UK) kit, with nuclease free DEPC water, twice heated at 65°c for 10 minutes, to elute the sample. The resultant dsRNA product was analysed using a nanodrop spectrometer (Nanodrop Technologies, UK) and subsequently concentrated to 3μg/μl using a vacuum centrifuge at 37°c. Three-to-five day old, presumed mated, non-blood fed females, were immobilised on a CO2 block and 69nl dsRNA injected directly into the thorax, between the cuticle plates of the abdomen, underneath the wing. As a control, non-endogenous GFP dsRNA was injected at the same amount and concentration.
UAS-SAP2 Plasmid Construction
Due to difficulty in transformation of a UAS-SAP2 construct into E. coli with a complete ORF, a fusion gene was created that was interrupted by a synthetic intron directly after the start codon. Two fragments were amplified separately and fused together through 40bp overlapping nucleotides (20 final nucleotides of synthetic intron and 20 nucleotides downstream the SAP2 start codon). The 5’ fragment containing a start codon, intron and SAP2 overlap was amplified from pSL-attB-Gyp-UAS14i-Cyp6P3-eYFP (Adolfi A. and Lycett G., unpublished). In parallel, SAP2 was amplified from Tiassalé genomic DNA using primers F-TTCTGAATTCCATCATGAAACTGTTCGTCGCC and R-TTCTCTCGAGTTATTCCAGCTTGATG. The 3’ fragment for fusion was amplified from the SAP2 PCR product with the overlapping sequences indicated above. The primers used were F-TTCTGAATTCCATCATGGTAAGTATCAAGGTTACA, R-GCGATGGCGACGAACAGTTTCTGTGGAGAGAAAGGCAAAG and F-CTTTGCCTTTCTCTCCACAGAAACTGTTCGTCGCCATCGC, R-TTCTCTCGAGTTATTCCAGCTTGATG, respectively. The two fragments were fused together by PCR using the outer amplification primers, sub-cloned into pJET1.2 (Thermo Scientific) and inserted into pSL-attB-Gyp-UAS14-eYFP-gyp-attB (Lycett G., unpublished), which carries inverse attB site for RCME flanking, the 3xP3-YFP transformation marker and multiple cloning site through the EcoRI/XhoI restrictions sites, to generate plasmid pUAS-SAP2. Sequence analysis indicated a point mutation within the synthetic intron but outside of the splice and acceptor donor sites.
Transgenic Lines
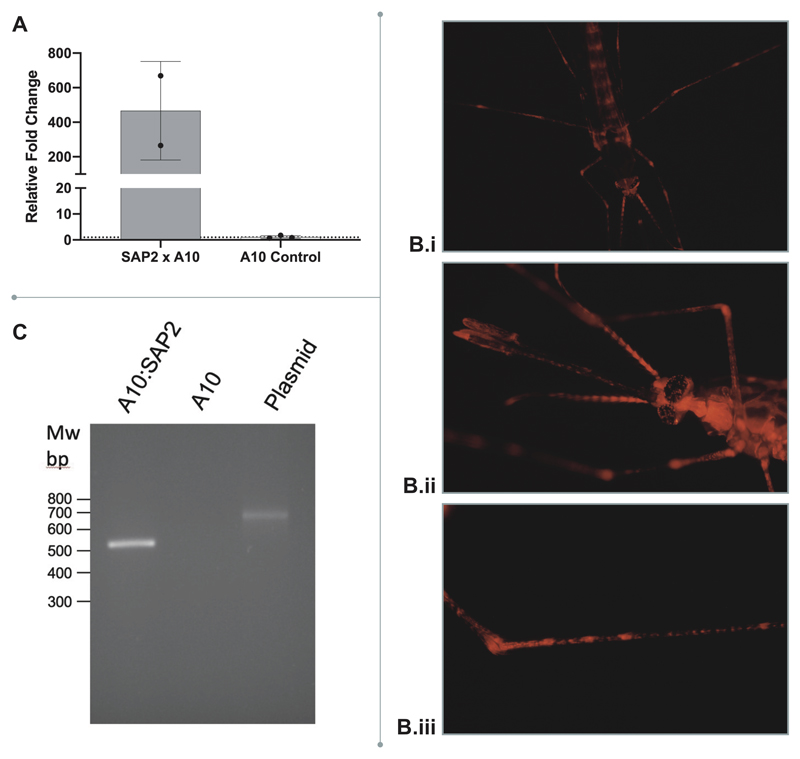
The CFP marked A10 Ubi-GAL4 line 26 was used as the RCME docking line to establish the UAS:SAP2 line. The A10 promoter, polyubiquitin c (PUBc), has been previously characterised, and shows high levels of expression throughout adult male and female mosquitoes26. mCherry under the PUBc promoter in the A10 line has fluorescence in the thorax, non-sclerotised abdomen, appendages (wing veins, antennae, palps, proboscis/labium and legs) 26 (Extended Data Figure 6b). Microinjections were performed on approximately 200 embryos with 350ng/μl of SAP2:UAS responder plasmid and 150ng/μl of phiC31 integrase helper plasmid pKC40 (gift from L. Ringrose, Humboldt University Berlin). 38 F0 L1 larvae transiently expressing the YFP marker were obtained, reared separately and crossed into opposite sex G3. Three YFP positive F1 male adults were identified from screening, that were backcrossed with wild-type G3, and characterised for orientation of exchange cassette through a diagnostic PCR. All males showed identical orientation in the expected genomic site. From these F1 crosses, a single isofemale line was selected, that showed expected 50% YFP inheritance in F2. This line was further characterised after crossing with the parental A10 Ubi-Gal4 driver line for correct splicing of the inserted intron (Extended Data Figure 6c) and for insecticide bioassays.
Bioassays
72-hours post injection, 3-5-day old adult females were exposed to a panel of insecticides using standard insecticide impregnated papers in WHO tubes 27. In each case, 15-30 adult females were exposed to insecticide for 1-hour and then left in a control tube for 24 hours in insectary conditions before mortality was scored (minimum biological replicates = 3; maximum = 17). For each experiment, mosquitoes were simultaneously exposed to untreated control papers. GFP-injected mosquitoes were used as controls for the RNAi bioassays and the GAL4-driver line acted as a control for the bioassays on the transgenic strains. For the induction experiments, no 24-hour recovery period was allowed, and mosquitoes were taken at the time point directly after 1-hour exposure; this experiment was only possible on the resistant population due to mortality in the susceptible control. Bartlett and Shapiro tests were used to confirm homogeneity of variance and normality of data respectively. For non-normal data transformations were performed to achieve normality. Analysis of mortality data was done using an ANOVA test followed by a Tukey post hoc test. Graphs were produced using GraphPad Prism 8.0.2 (La Jolla California USA, www.graphpad.com). Mortalities and significance levels for figure panels are shown in Supplementary Data Table 2.
RNA Extraction
RNA was extracted and purified in each experimental set using an Arcturus PicoPure RNA Isolation Kit (Thermo Fisher, UK) following manufacturer’s instructions. Whole body resistant and susceptible experiments, and RNAi knockdown efficiency checks, used five to seven, 3-5-day old adult female mosquitoes, ground and boiled in extraction buffer. For insecticide induction mosquitoes were snap frozen pre-exposure and at 30 minutes, 1 hour, 2 hours, 4 hours, 24 hours and 48 hours post-deltamethrin exposure of 3-5-day old female mosquitoes and RNA extracted as above. Finally, for tissue experiments; 50-100 3-5-day old females had heads, legs, antennae, midgut, Malpighian tubules, reproductive tissues (and hindgut), along with the remaining abdominal carcass where fat body cells predominate 28, removed with microdissection scissors and tweezers on iced PBS, alongside 5-7 age matched whole females from the same cage. The quality of the RNA was assessed using a nanodrop spectrophotometer (Nanodrop Technologies UK).
qPCR
RNA (1-4μg) from each biological replicate was reverse transcribed using Oligo dT (Invitrogen, UK) and Superscript III (Invitrogen, UK) according to manufacturer’s instructions. Quantitative real-time PCR was performed using SYBR Green Supermix III (Applied Biosystems, UK) using an MX3005 and the associated MxPro software v4.10 (Agilent, UK). Primer Blast (NCBI) was used to design primer pairs. Where possible, primers were designed to span an exon junction (Supplementary Table 3). Each 20μl reaction contained 10μl SYBR Green Supermix, 0.3μM of each primer and 1μl of 2ng/μL cDNA. Standard curves for each primer set were used to calculate efficiency, using five 1:5 dilutions of cDNA to ensure that all primer sets met the MIQE guidelines (90-120%). qPCR was performed with the following conditions: 3 minutes at 95°C, with 40 cycles of 10 seconds at 95°C and 10 seconds at 60°C. Relative expression was normalised against two housekeeping genes: EF (AGAP005128) and S7 (AGAP010592). Analysis was performed on 2ΔΔCt values 29; Bartlett and Shapiro tests were used to confirm homogeneity of variance and normality of data respectively. For non-normal data transformations were performed when possible to achieve normality. Normal data was analysed using an ANOVA followed by Dunnett’s post hoc test, non-normal data was analysed using Kruskall-Wallis followed by a Dunn’s post hoc test. Graphs were produced using GraphPad Prism 8.0.2 (La Jolla California USA, www.graphpad.com). All qPCR analysis had three biological replicates and three technical replicates within each biological replicate, with the exception of the transgenics which had two. Relative fold changes and significance levels for each figure panel are shown in Supplementary Data Table 2; primers are shown in Supplementary Data Table 3 and SAP2 sequences to demonstrate conservation of binding site in Extended Data Figure 9. The PCR for sequencing was performed in two reactions, and sequenced using the primers, Region1-F ‘CACAACGATTCGTGGTCACC’, Region1-R ‘CACTTCACAACTTGCAATGAA’, sequenced using Region1-R and Region2-F ‘TTCATTGCAAGTTGTGAAGTG’, Region2-R ‘GCACCAGCTGATCGTTGA’, sequenced using Region2-F. PCR used Phusion High-Fidelity DNA Polymerase (Thermo Fisher, UK) with a 98°C 30 seconds followed by 40 cycles of 98°C 7 seconds, 64°C for 10 seconds, 72°C for 2 minutes and a final hold of 72°C for ten minutes. Gel extraction used Qiagen Gel Extraction Kit (Qiagen,UK), following manufacturer’s instructions and PCR products were Sanger sequenced at Eurofins Genomics, UK.
SAP constructs
SAP1, SAP2 and SAP3 proteins were expressed in bacteria (SAP1 and SAP3 as N-terminal His-tagged proteins, while SAP2 which is secreted in the periplasmic space, as a C-terminal His-tagged protein). The bacterial expression constructs used for SAP1 and SAP3 expression were generated by directly subcloning the SAP1 and SAP3 ORFs (as EcoRI-NdeI fragments) from the relevant constructs used in Iovinella et al. 14 (kindly provided by Alessandra della Torre, Universita “Sapienza”, Rome, Italy) into pET16bTeV vector in order to generate plasmids pET16TeV.SAP1 and pET16TeV.SAP3 expressing N-terminal His-tagged versions of SAP1 and SAP3 respectively. For SAP2 expression, a stepwise cloning strategy into pET22b vector was employed, as follows: Anopheles gambiae cDNA (made from RNA from N’Gousso strain mosquito heads) was used as a template for PCR amplification of a 384 bp SAP2 ORF with Kapa Taq polymerase (Roche, Switzerland) using primers SAP2F: 5’- ATGAAACTGTTCGTCGCCATC-3’ and SAP2R: 5’- TTATTCCAGCTTGATGCCCTC-3’under the following conditions: 95°C for 5 min and 30 cycles of 95°C for 30 sec, 60°C for 30 sec and 72°C for 30 sec, followed by a final extension step of 72°C for 5 min. The amplified SAP2 ORF was subcloned into pGEM-T-Easy vector (Promega) and sequence verified. Plasmid DNA from a positive pGEM.SAP2 clone was used as template for the amplification of the mature SAP2 ORF (i.e. without the native signal peptide sequence in order to enable cloning in frame to the pET22-encoded bacterial signal peptide), using primers NcoSAP2F: 5’-TAACCATGGCCCAGGAGCAGTACACCACC-3’ (to generate an NcoI site in frame with pelB ORF in pET-22b) and XhoSAP2ΔR: 5’- GTCTCGAGTTCCAGCTTGATGCCCTCCTT-3’ (to remove the termination codon, thus enabling C-terminal His tagging, and also introduce an XhoI site). The amplified product was digested with NcoI and XhoI and subcloned into the relevant cloning sites of pET-22b. The recombinant plasmid pET22.SAP2His was sequence verified and used for periplasmic protein expression.
Protein expression and purification
Expression of SAP1 and SAP3 was carried out in BL21-Codon Plus (DE3) E. coli cells (Agilent, UK) harbouring pET16TeV.SAP1 and pET16TeVSAP3 respectively. A single colony was selected and cultured overnight at 37 °C in 80 ml of terrific broth (TB) containing 100μg/mL ampicillin and 34μgr/mL chloraphenicol. The 80ml overnight bacterial culture was used to inoculate a 4L culture of TB containing 100μg/mL ampicillin and 34μg/ml chloramphenicol. Cells were cultured at 37 °C until OD595 was equal to 0.8. Recombinant protein expression was induced by addition of 0.4mM isopropyl β-thiogalactopyranose (IPTG) and the bacteria were cultured for additional 4 hours at 30 °C. Bacteria were harvested by centrifugation (5000rpm for 30 min) and the pellet was resuspended in 1M NaCl, 50mM Tris-HCl pH 8.0, 0.2mM EDTA, 0.2mM PMSF buffer and sonicated for 30 min at 4°C. Following sonication, a high-speed centrifugation at 20000xg for 30 min at 4°C, was performed, the supernatant collected and processed to the purification step.
The supernatant containing soluble SAP1 or SAP3 was purified by Ni2+ affinity chromatography as follows: a 5.5ml Ni-NTA Agarose column was equilibrated with a buffer containing 1M NaCl, 50mM Tris-HCl pH 8.0 and 5mM imidazole. The supernatant was loaded onto the column and washed with equilibration buffer for 10 column volumes (CV). Another wash for 10 column volumes (CV) was performed with 25mM NaCl, 50mM Tris-HCl pH 8.0, 10% glycerol and 10mM imidazole. Bound protein was eluted with 5 CVs of 50mM Tris pH 8.0, 25mM NaCl, 10% glycerol and 300mM imidazole. Fractions with an absorbance at 595 nm (Bradford assay) greater than 3mg/ml were pooled, concentrated and buffer exchanged into 50mM Tris-HCl pH8.0, 25mM NaCl and 10% glycerol with dialysis membrane (6-8 kD) overnight at 4 °C.
For expression of SAP2, E. coli BL21-Codon Plus (DE3) cells transformed with pET22.SAP2His were cultured overnight at 37°C in 20ml terrific broth (TB) containing 100μg/mL ampicillin and 34μgr/mL chloramphenicol. The 20mL overnight E. coli culture was used to inoculate a 2L culture of TB containing 100μg/mL ampicillin and 34μg/mL chloramphenicol. Cells were cultured at 37°C until OD595 was equal to 0.8. Protein expression was induced by addition of 0.1mM IPTG and cultured for an additional 16 – 18 hours at 25 °C. Cells were harvested by centrifugation (5000 rpm for 30 min) and the periplasmic E. coli fraction was extracted via osmotic shock as described 30. Briefly, harvested cells were suspended in a hypertonic solution of 30mM Tris, 20% w/v sucrose, 1mM EDTA, pH 8.0 (25mL / 1L culture) and incubated for 30 min at 4°C. Then, cells were centrifuged at 20.000 x g at 4°C for 20 min and the supernatant was collected (sup1). Cells were re-suspended in a hypotonic solution of 5mM MgSO4 (25 ml / 1L culture), incubated for 30 min at 4°C and followed by an additional centrifugation at 20000 x g at 4°C for 20 min (sup2). The supernatant (sup2) from the hypotonic solution was used for the purification step.
The periplasmic solution containing secreted SAP2 was purified by Ni2+ affinity chromatography as follows. A 6.5mL Ni-NTA agarose column was equilibrated with 20mM Tris, 300mM NaCl, 40mM imidazole, pH 8.0. The clarified osmotic shock fluid (sup2) was loaded onto the column and washed with equilibration buffer for 15 column volumes (CV). Bound protein was eluted with 5 CVs of 20mM Tris, 300mM NaCl, 500mM imidazole, pH 8.0. Fractions with an absorbance at 59 nm (Bradford assay) greater than 0.5 were pooled, concentrated and buffer exchanged into 50mM Tris-HCl pH 8.0, 25mM NaCl, 10% glycerol with dialysis membrane (6-8kDa MWCO) overnight at 4°C.
1-NPN binding competition assays
The affinity of various insecticides for SAP1, SAP2 and SAP3 was measured indirectly by competitive binding assays, which determined the displacement of the ligands from the SAPs by the fluorescent probe N-phenyl-1-naphthylamine (1-NPN). Purified recombinant SAP proteins were mixed with different concentrations of insecticides (in methanol) and 1-NPN (in methanol) in a final volume of 200μl 20 mM Tris-HCl, pH 8.0, 100mM NaCl (containing 1.5% methanol). The final concentration of recombinant SAP protein and 1-NPN in the assays was 10μM and 5μM respectively. Insecticide concentration ranged from 0.0625-20μM. The probe was excited at 337 nm and emission spectra were recorded between 380nm and 460nm (peak emission in the presence of recombinant SAP is at 386-388nm). Emission spectra were recorded on an Infinite M-200 fluorimeter (Tecan Trading AG, Switzerland) using black 96 well plates (Greiner Bio-One, Austria). Graphs were produced using GraphPad Prism 8.0.2 (La Jolla California USA, www.graphpad.com). A non-linear fit using logged concentrations were used to fit best fit lines and calculate the IC50s. The calculated log IC50s and associated standard errors were used to fit an ANOVA to compare the binding specificity of the 3 proteins.
Microarray Data
Microarray data was retrieved from the IR-TEx Application 10 (https://www.lstmed.ac.uk/projects/ir-tex).
Field Collections
Field collections of An. gambiae s. l. were performed by LSTM colleagues in collaboration with the Centre National de Recherche sur le Paludsime (CNRFP) in Banfora district, Burkina Faso. The mosquitoes used in this study originated from Tengrela, (10°38’7.53”N; 4°48’48.35”W) in 2011, 2012, 2014, 2016 and 2018, Bakaridjan (10°24’26.34”N; 4°33’44.78”W) in 2013 and 2015 and from Tiefora (10°37’54.02”N; 4°33’22.85”W) in 2018. All gDNA extractions were subject to SINE PCR 31 to determine the species of each mosquito before sequencing.
Scan for natural selection
We computed iHS 20 and XPEHH 21 statistics on phased sequences for regions 1.5Mbp upstream and downstream of the chemosensory locus for all available An. gambiae West African mosquito populations found in phase 2 of the Anopheles 1000 Genomes project using scikit-allel v1.1.10 (DOI: 10.5281/zenodo.822784). A peak was apparent in iHS in the Guinean A. gambiae population (highest value at 3R: 4,845,138), and a smaller peak was present in Burkina Faso, a XPEHH peak was present in Cameroon.
Clustering analysis and SNP Panel
We carried out haplotype clustering analysis around the chemosensory locus and identified 13 haplotypes that differed by fewer than 20 SNPs across a window 25kb up and downstream of the limits of SAP2. This is a firm proxy for identity by descent in an organism with pi ~ 0.01 19, indicative of selection acting at this region. These 13 shared haplotypes were observed in Guinea, Burkina Faso and Cameroon.
These 13 haplotypes were used to define 55 SNPs showing high Fst between this cluster and the wild type An. gambiae populations. A SNP panel screen was designed to encompass a range of these SNPs showing the highest delta between wild type and cluster SNPs, primers for the two panels were as follows:: -F: CAAGCATTGCGCCATCGT; -R: GAGAAGATGATACTGAGCGG. PCR was performed on gDNA from individual An. gambiae from Bakaridjan in 2013 (42 individuals) and 2015 (50 individuals) and Tiefora in 2018 (40 individuals). SNP genotypes from genomic sequence data from individual An. coluzzii samples from Tengrela from 2011 (21 individuals), 2012, 2014 and 2016 (72 individuals for each year) was kindly provided by the Broad Institute; the PCR panel was ran on samples from the same site in 2018 (20 samples). The panel was ran using Phusion High-Fidelity DNA Polymerase (Thermo Fisher, UK) following manufacturer’s instructions and the cycles: 98°C for 30 seconds, 35 cycles of: 98°C for 7 seconds, 65°C for 10s, 72°C for 15 seconds and a final 72°C, 15-minute hold. The resultant product was purified using a QiaQuick Gel Extraction Kit (Qiagen, UK) following manufacturer’s instructions and sent for Sanger sequencing at Eurofins Genomics, UK using the reverse primer. SNPs were identified using Benchling [Biology Software] (2019, https://benchling.com) and the resultant change in minor allele frequency calculated and a trendline fitted to each SNP using GraphPad Prism 8.0.2 (La Jolla California USA, www.graphpad.com).
Phylogeny
cDNA sequences for each of the CSPs were retrieved from VectorBase 32 and aligned using Clustal Omega (https://www.ebi.ac.uk/Tools/msa/clustalo/). These data were loaded into Mega 7.0 33 and a maximum likelihood tree with 1000 bootstraps performed.
Extended Data
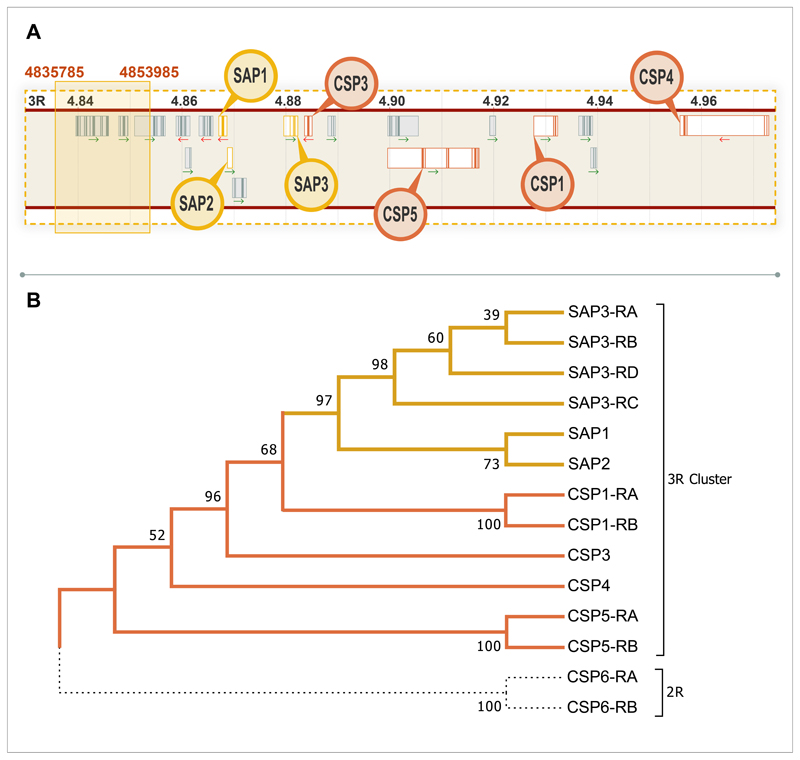
Extended Data Figure 1. Chemosensory protein cluster.
A. Schematic of the region surrounding the shared haplotype block found in the 1000 genomes data with all chemosensory proteins in the cluster highlighted in yellow. Genes displayed in order of appearance, left to right, are as follows: AGAP008046, AGAP013713, AGAP008047, AGAP008048, AGAP008049, AGAP008050, AGAP008051 (SAP1), AGAP008052 (SAP2), AGAP008053, AGAP008054 (SAP3), AGAP008055 (CSP3), AGAP008056, AGAP029127 (CSP5, previously AGAP008058), AGAP008059 (CSP1), AGAP008060, AGAP008061 and AGAP008062 (CSP4). B. cDNA bootstrap consensus tree inferred from 1000 replicates using the maximum likelihood method; the percentage of replicate trees with the associated clustering are shown next to the branches. Yellow indicates the sensory appendage proteins, orange the remaining chemosensory proteins in the 3R cluster and black dotted lines show CSP6, which is located on 2R. Alternative isoforms are represented with -RX, with X proceeding alphabetically dependent on number of splice variants.
Extended Data Figure 2. Overexpression of CSP family in a multi-resistant Anopheles population.
The left panel shows mean relative fold change of each CSP in Tiassalé mosquitoes (blue) compared to the susceptible control N’Gousso (grey) as determined by qPCR, the right panel compared to the susceptible population Kisumu (grey). Points show 3 biological replicates and error bars show standard deviation. * p ≤ 0.05; ** p ≤ 0.01; *** p ≤ 0.001. Statistical significance calculated by an ANOVA followed by Dunnett’s post hoc test; p-values are in Supplementary Table 2.
Extended Data Figure 3. Expression levels of non-induced chemosensory proteins post-deltamethrin exposure in Tiassalé.
A. Expression levels of the remaining four CSPs at various time points post-deltamethrin exposure in the multi-resistant population Tiassalé. B. Tissue specific induction of these four CSPs 4-hours post-deltamethrin exposure. The data show mean of 3 biological replicates ± standard deviation. * p ≤ 0.05; ** p ≤ 0.01; *** p ≤ 0.001. Statistical significance calculated by an ANOVA followed by Dunnett’s post hoc test. If the data was non-normal, data was analysed using Kruskall-Wallis followed by a Dunn’s post hoc test; p-values are in Supplementary Table 2.
Extended Data Figure 4. Efficacy of RNAi.
mRNA knockdown of whole female mosquitoes 72-hours post injection compared to GFP injected controls. Mean of 3 biological replicates and standard deviation shown.
Extended Data Figure 5. Phenotype of other induced CSPs to a panel of insecticides.
Effect of attenuation of (a) dsSAP3 (ndeltamethrin = 4; npermethrin = 5; nα-cypermethrin = 3; nDDT = 3; npirimiphos-methyl = 3; nbendiocarb = 4) (b) dsCSP4 (ndeltamethrin = 3; npermethrin = 3; nα-cypermethrin = 3; nDDT = 3; npirimiphos-methyl = 3; nbendiocarb = 3) and (c) dsCSP6 (ndeltamethrin = 6; npermethrin = 4; nα-cypermethrin = 4; nDDT = 3; npirimiphos-methyl = 4; nbendiocarb = 5) on mortality after insecticide exposure in Tiassalé mosquitoes (right bars) compared to dsGFP injected controls (left bars, green patterned; ndeltamethrin = 5; npermethrin = 5; nα-cypermethrin = 5; nDDT = 4; npirimiphos-methyl = 4; nbendiocarb = 8). Analysis of mortality data was done using an ANOVA test followed by a Tukey post hoc test, n.s indicates a non-significant change in mortality, * p ≤ 0.05. dsCSP6 μmortality = 11.7% to 31.6%, p = 0.0474. N shows number of individual mosquitoes used for phenotyping; points show the number of bioassay replicates per group. Error bars show standard deviation.
Extended Data Figure 6. Characterisation of SAP2 in the transgenic line.
A. Mean mRNA expression of SAP2 overexpression in the SAP2 x A10 transgenic line (n=2) compared to SAP2 in the A10 x G3 control (n = 3). Error bars represent standard deviation and points show each biological replicate. B. mCherry under the Polyubiquitin c A10 promoter demonstrating (i) ubiquitous expression; (ii) expression in the head; (iii) expression in the legs as shown previously by Adolfi et al. 2018; these results were tested across over a hundred independent mosquito screenings. C. Intron splicing confirmed by PCR in A10 x SAP2 and negative control A10 mosquitoes compared to plasmid DNA: pUAS-SAP2. Size of PCR product with and without synthetic intron 647bp and 534bp, respectively. MW: 100bp DNA ladder. 2 samples A10 x SAP2 and 2 control samples A10 (each sample: pool of 5 females, 4 days old, unfed) were tested and repeated in two PCRs.
Extended Data Figure 7. Effect of dsSAP2 injection on Tiassalé fitness.
A. Longevity of dsSAP2 (black) compared to dsGFP controls (green). N shows number of individual mosquitoes used in each group; n.s represents p = 0.113 as calculated by a Mantel-Cox test (two-sided). B. Life history traits in dsSAP2 injected (black) and dsGFP injected (green) females (i) Number of eggs in each group 72-hours post-blood meal, median and interquartile range displayed; (ii) Proportion of females with eggs (Dark shading are females with eggs, light without; p = 0.4382); (iii) Mortality post-blood meal (Dark shading are females alive post-blood meal, light those dead; p = 0.0052); (iv) Blood feeding proportions (Dark shading are blood fed females, light non-blood fed; p = 0.3257); for dsSAP2 injected and dsGFP injected controls (green). Numbers show total individual females in each group. Significance in (i) as calculated by a two tailed Mann-Whitney U test (n.s represents p = 0.0657); (ii), (iii) and (iv) through a chi-squared test. ** p ≤ 0.01.
Extended Data Figure 8. Mortality of An. coluzzii field populations.
Temporal plot of mortality from 2011 to 2018 of An. coluzzii mosquitoes to 0.05% WHO tube deltamethrin exposure, Δ is the posterior median change in mortality from 2011 to 2018, N is number of experiments included (minimum sample size for any given data point = 14), P the posterior probability that resistance (the proportion of posterior samples where the April 2018 mean exceeds the corresponding value in January 2011) has increased over the time period. The blue line indicates the posterior median of a logistic model fit to binomial test results; the two parameters of the logistic function were assigned uninformative (Cauchy(0, 1)) priors. The model was fit using Stan23 using 4 chains and 800 iterations per chain (400 of which were discarded as warm-up in each case); all parameters had Rhat < 1.1 indicating convergence. The shading indicates the 90% predictive interval on the mean. Data and Figure kindly provided by Dr Hyacinthe Toé, Dr Ben Lambert and Dr Thomas Churcher.
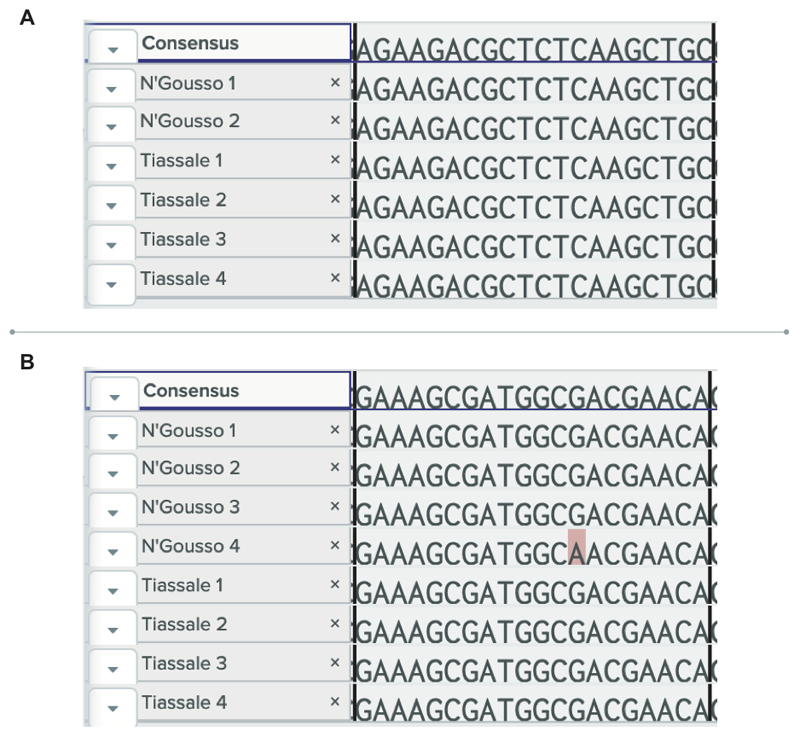
Extended Data Figure 9. Sequencing of SAP2 primer binding sites.
4 N’Gousso individuals and 4 Tiassale individuals were sequenced across the primer binding sites. (a) Complete conservation of sequence was seen in the forward binding site (b) one N’Gousso individual was heterozygous at one base in the centre of the reverse primer binding site.
Extended Data Table 1. Expression of CSP family in Western Africa.
Microarray fold change data from microarray datasets retrieved from IR-TEx10 across Western Africa for An. coluzzii and An. gambiae populations for each member of the CSP family. Highlighted in green are fold changes showing significant overexpression in the respective datasets, and yellow under expression; white backgrounds show no significant change. SAP2 is emboldened. The country of origin, species and exposure status of the resistant population are given below each table, as well as the susceptible population used as a comparator.
| Dataset | Banfora | Tiefora13 | Tiefora14 | Tensrela | VK72011 | VK72012 | VK6 | |
| AGAP008051-RA | SAP1 | 0.827 | 3.320 | 5.414 | 2.229 | 2.006 | 0.370 | 0.402 |
| AGAP008052-RA | SAP2 | 2.218 | 2.947 | 7.912 | 6.102 | 6.322 | 0.953 | 0.949 |
| AGAP008054-RA | SAP3 | 1.040 | 0.882 | 0.736 | 1.052 | 1.729 | 0.858 | 1.329 |
| AGAP008055-RA | CSP3 | 0.960 | 2.516 | 1.994 | 3.086 | 3.866 | 0.914 | 1.419 |
| AGAP008058-RA | CSP5 | 1.060 | 1.252 | 1.824 | 1.074 | 1.231 | 0.649 | 0.997 |
| AGAP008059-RA | CSP1 | 0.506 | 3.628 | 4.146 | 1.738 | 1.247 | 0.466 | 0.877 |
| AGAP008062-RA | CSP4 | 0.921 | 0.992 | 1.024 | 0.948 | 1.048 | 0.985 | 1.162 |
| AGAP001303-RA | CSP6 | 0.869 | 1.772 | 2.118 | 0.961 | 0.704 | 0.463 | 0.782 |
| AGAP001303-RB | CSP6 | 0.864 | 1.821 | 2.164 | 0.969 | 0.711 | 0.444 | 1.195 |
| Country | Burkina Faso | Burkina Faso | Burkina Faso | Burkina Faso | Burkina Faso | Burkina Faso | Burkina Faso | |
| Species | An. coluzzii | An. gambiae | An. gambiae | An. coluzzii | An. coluzzii | An. coluzzii | An. coluzzii | |
| Exposure Status | Unexposed | Unexposed | Unexposed | Unexposed | Deltamethrin | Deltamethrin | Unexposed | |
| Susceptible Comparator | N'Gousso | Kisumu | Kisumu | Mali | Mali | N'Gousso | N'Gousso | |
| Dataset | Bouake | M'Be | Tiassale | TiassaleMali | TiassaleOkyero | Tiassale2011 | Nkolondom | |
| AGAP008051-RA | SAP1 | 1.889 | 1.726 | 4.257 | 1.106 | 0.620 | 0.385 | 1.374 |
| AGAP008052-RA | SAP2 | 10.486 | 8.882 | 51.346 | 1.360 | 0.419 | 0.768 | 1.415 |
| AGAP008054-RA | SAP3 | 2.585 | 1.683 | 5.516 | 0.822 | 0.623 | 0.681 | 1.844 |
| AGAP008055-RA | CSP3 | 1.157 | 1.549 | 1.247 | 1.091 | 0.672 | 0.569 | 2.259 |
| AGAP008058-RA | CSP5 | 0.946 | 1.134 | 1.008 | 1.038 | 0.833 | 0.688 | 1.330 |
| AGAP008059-RA | CSP1 | 1.609 | 1.932 | 2.505 | 1.067 | 0.844 | 0.638 | 1.331 |
| AGAP008062-RA | CSP4 | 0.992 | 0.980 | 0.995 | 1.076 | 0.990 | 1.128 | 1.100 |
| AGAP001303-RA | CSP6 | 0.610 | 0.635 | 0.856 | 0.848 | 1.130 | 0.456 | 2.384 |
| AGAP001303-RB | CSP6 | 0.584 | 0.604 | 0.819 | 0.850 | 1.065 | 0.458 | 2.463 |
| Country | Cote D‘Ivoire | Cote D‘Ivoire | Cote D‘Ivoire | Cote D‘Ivoire | Cote D‘Ivoire | Cote D‘Ivoire | Cameroon | |
| Species | An. coluzzii | An. coluzzii | An. coluzzii | An. coluzzii | An. coluzzii | An. coluzzii | An. gambiae | |
| Exposure Status | Deltamethrin | Deltamethrin | Deltamethrin | Unexposed | Unexposed | Unexposed | DDT | |
| Susceptible Comparator | N'gousso | N'gousso | N'gousso | Mali | Okyero | N'Gousso | Kisumu | |
| Dataset | Garre | Messa | Youande | Bioko | KovieOkyero | KovieMalanville | ||
| AGAP008051-RA | SAP1 | 0.659 | 0.702 | 0.978 | 0.782 | 1.171 | 0.519 | |
| AGAP008052-RA | SAP2 | 3.024 | 1.673 | 2.009 | 4.094 | 0.871 | 0.473 | |
| AGAP008054-RA | SAP3 | 1.480 | 1.842 | 1.412 | 0.962 | 0.605 | 0.065 | |
| AGAP008055-RA | CSP3 | 1.023 | 0.795 | 0.952 | 0.754 | 0.723 | 0.844 | |
| AGAP008058-RA | CSP5 | 0.774 | 0.681 | 1.298 | 0.734 | 0.842 | 0.956 | |
| AGAP008059-RA | CSP1 | 0.481 | 0.492 | 1.297 | 0.472 | 1.535 | 1.293 | |
| AGAP008062-RA | CSP4 | 0.958 | 0.870 | 0.993 | 0.848 | 1.821 | 0.826 | |
| AGAP001303-RA | CSP6 | 0.452 | 0.423 | 1.387 | 0.458 | 1.135 | 0.896 | |
| AGAP001303-RB | CSP6 | 0.450 | 0.393 | 1.431 | 0.435 | 1.232 | 0.908 | |
| Country | Cameroon | Cameroon | Cameroon | Equatorial Guinea | Togo | Togo | ||
| Species | An. coluzzii | An. coluzzii | An. gambiae | An. coluzzii | An. coluzzii | An. coluzzii | ||
| Exposure Status | DDT | DDT | Bendiocarb | Deltamethrin | Unexposed | Unexposed | ||
| Susceptible Comparator | N'Gousso | N'Gousso | N'Gousso | N'gousso | Okyero | Malanville | ||
Supplementary Material
Acknowledgements
Thank you to the following for providing field collections: Dr Nelson Grisales, LSTM (Bakaridjan in 2013 and 2015); Dr Antoine Sanou, Dr Moussa Guelbeogo, CNRFP (Tiefora 2018, Tengrela 2011, 2012, 2014, 2016); Natalie Lissenden, LSTM (Tengrela 2018). We are grateful to Dr Daniel Neafsey and Dr Jacob Tennessen, Broad Institute for sharing Tengrela whole genome sequence data, Dr Immacolata Iovinella, University of Florence for provision of SAP1 and SAP3 plasmids, Manuela Bernardi, LSTM for help with figure preparation and to Faye Brown, Sara Elg, Patricia Pignatelli and Derek Au, LSTM for providing some technical support. We are also grateful to Dr Hyacinthe Toé and Dr Thomas Churcher for supplying both the field data and figure in Extended Data Figure 8. We finally thank Dimitra Tsakireli (IMBB-FORTH) and Evangelia Morou (IMBB-FORTH), for their help for the expression and characterisation of SAP proteins.
Funding
This study was funded by an MRC Skills Development Fellowship (MR/R024839/1) to V.I and a Royal Society Challenge Grant (CH160059) to H.R. Mosquito collections in Burkina Faso were supported by EC FP7 Project grant no: 265660 “AvecNet” and Wellcome Trust Collaborative Award (200222/Z/15/Z).
Footnotes
Author contribution
V.I. and H.R conceived the experimental design. V.I performed: all transcriptomic expression experiments; RNAi and phenotyping; data analysis, PCR and associated sequencing. A.A and G.L produced the transgenic lines and associated phenotypic characterisation. V.D and J.V performed the binding assays and associated protein expression experiments. N.H analysed the 1000 genomes data and produced the haplotype SNP panel. M.M provided all insectary support. V.I and H.R drafted the manuscript.
Data Availability
All data analysed during this current study are available on public repositories and detailed in the present paper, or in the Extended Data files, or are available from the authors upon request.
The authors declare that they have no competing interests.
Reprints and permissions information is available at www.nature.com/reprints.
Contributor Information
V Douris, Foundation for Research and Technology - Hellas (FORTH), Institute of Molecular Biology and Biotechnology, Nikolaou Plastira 100, Vassilika Vouton, GR - 700 13 Heraklion, Crete, Greece.
N J Harding, The Big Data Institute, University of Oxford, Old Road Campus, Oxford, OX37LF.
J Vontas, Foundation for Research and Technology - Hellas (FORTH), Institute of Molecular Biology and Biotechnology, Nikolaou Plastira 100, Vassilika Vouton, GR - 700 13 Heraklion, Crete, Greece; Pesticide Science Laboratory, Department of Crop Science, Agricultural University of Athens, 11855 Athens, Greece.
H Ranson, Vector Biology, Liverpool School of Tropical Medicine, Pembroke Place, Liverpool, L3 5QA, UK.
References
- 1.Bhatt S, et al. The effect of malaria control on Plasmodium falciparum in Africa between 2000 and 2015. Nature. 2015;526:207–211. doi: 10.1038/nature15535. [DOI] [PMC free article] [PubMed] [Google Scholar]
- 2.WHO. World Malaria Report. Geneva: 2018. [Google Scholar]
- 3.Hawley WA, et al. Community-wide effects of permethrin-treated bed nets on child mortality and malaria morbidity in western Kenya. Am J Trop Med Hyg. 2003;68:121–127. [PubMed] [Google Scholar]
- 4.Churcher TS, Lissenden N, Griffin JT, Worrall E, Ranson H. The impact of pyrethroid resistance on the efficacy and effectiveness of bednets for malaria control in Africa. Elife. 2016;5:e16090. doi: 10.7554/eLife.16090. [DOI] [PMC free article] [PubMed] [Google Scholar]
- 5.Protopopoff N, et al. Effectiveness of a long-lasting piperonyl butoxide-treated insecticidal net and indoor residual spray interventions, separately and together, against malaria transmitted by pyrethroid-resistant mosquitoes: a cluster, randomised controlled, two-by-two fact. Lancet. 2018;391:1577–1588. doi: 10.1016/S0140-6736(18)30427-6. [DOI] [PMC free article] [PubMed] [Google Scholar]
- 6.Stevenson BJ, et al. Cytochrome P450 6M2 from the malaria vector Anopheles gambiae metabolizes pyrethroids: Sequential metabolism of deltamethrin revealed. Insect Biochem Mol Biol. 2011;41:492–502. doi: 10.1016/j.ibmb.2011.02.003. [DOI] [PubMed] [Google Scholar]
- 7.Müller P, et al. Field-Caught Permethrin-Resistant Anopheles gambiae Overexpress CYP6P3, a P450 That Metabolises Pyrethroids. PLoS Genet. 2008;4:e1000286. doi: 10.1371/journal.pgen.1000286. [DOI] [PMC free article] [PubMed] [Google Scholar]
- 8.Gleave K, Lissenden N, Richardson M, Ranson H. Piperonyl butoxide (PBO) combined with pyrethroids in long-lasting insecticidal nets (LLINs) to prevent malaria in Africa. Cochrane Database Syst Rev. 2017 doi: 10.1002/14651858.CD012776.pub2. [DOI] [PMC free article] [PubMed] [Google Scholar]
- 9.Toe KH, et al. Do bednets including piperonyl butoxide offer additional protection against populations of Anopheles gambiae sl. that are highly resistant to pyrethroids? An experimental hut evaluation in Burkina Fasov. Med Vet Entomol. 2018 doi: 10.1111/mve.12316. [DOI] [PubMed] [Google Scholar]
- 10.Ingham VA, Wagstaff S, Ranson H. Transcriptomic meta-signatures identified in Anopheles gambiae populations reveal previously undetected insecticide resistance mechanisms. Nat Commun. 2018;9 doi: 10.1038/s41467-018-07615-x. 5282. [DOI] [PMC free article] [PubMed] [Google Scholar]
- 11.Edi CV, et al. CYP6 P450 Enzymes and ACE-1 Duplication Produce Extreme and Multiple Insecticide Resistance in the Malaria Mosquito Anopheles gambiae. PLoS Genet. 2014;10:e1004236. doi: 10.1371/journal.pgen.1004236. [DOI] [PMC free article] [PubMed] [Google Scholar]
- 12.Vieira FG, Rozas J. Comparative genomics of the odorant-binding and chemosensory protein gene families across the Arthropoda: origin and evolutionary history of the chemosensory system. Genome Biol Evol. 2011;3:476–90. doi: 10.1093/gbe/evr033. [DOI] [PMC free article] [PubMed] [Google Scholar]
- 13.Leal WS. Odorant reception in insects: roles of receptors, binding proteins, and degrading enzymes. Annu Rev Entomol. 2013;58:373–391. doi: 10.1146/annurev-ento-120811-153635. [DOI] [PubMed] [Google Scholar]
- 14.Iovinella I, Bozza F, Caputo B, della Torre A, Pelosi P. Ligand-binding study of Anopheles gambiae chemosensory proteins. Chem Senses. 2013;38:409–419. doi: 10.1093/chemse/bjt012. [DOI] [PubMed] [Google Scholar]
- 15.Xuan N, et al. Increased expression of CSP and CYP genes in adult silkworm females exposed to avermectins. Insect Sci. 2015;22:203–219. doi: 10.1111/1744-7917.12116. [DOI] [PubMed] [Google Scholar]
- 16.Bautista MAM, et al. Evidence for trade-offs in detoxification and chemosensation gene signatures in Plutella xylostella. Pest Manag Sci. 2015;71:423–432. doi: 10.1002/ps.3822. [DOI] [PubMed] [Google Scholar]
- 17.Liu GX, et al. Biotype expression and insecticide response of Bemisia tabaci chemosensory protein-1. Arch Insect Biochem Physiol. 2014;85:137–151. doi: 10.1002/arch.21148. [DOI] [PubMed] [Google Scholar]
- 18.Yunta C, et al. Pyriproxyfen is metabolized by P450s associated with pyrethroid resistance in An. gambiae. Insect Biochem Mol Biol. 2016;78:50–57. doi: 10.1016/j.ibmb.2016.09.001. [DOI] [PMC free article] [PubMed] [Google Scholar]
- 19.Consortium, A. gambiae 1000 G. Genetic diversity of the African malaria vector Anopheles gambiae. Nature. 2017;552:96. doi: 10.1038/nature24995. [DOI] [PMC free article] [PubMed] [Google Scholar]
- 20.Voight BF, Kudaravalli S, Wen X, Pritchard JK. A Map of Recent Positive Selection in the Human Genome. PLOS Biol. 2006;4:e72. doi: 10.1371/journal.pbio.0040072. [DOI] [PMC free article] [PubMed] [Google Scholar]
- 21.Sabeti PC, et al. Genome-wide detection and characterization of positive selection in human populations. Nature. 2007;449:913. doi: 10.1038/nature06250. [DOI] [PMC free article] [PubMed] [Google Scholar]
- 22.Pombi M, et al. Unexpectedly high Plasmodium sporozoite rate associated with low human blood index in Anopheles coluzzii from a LLIN-protected village in Burkina Faso. Sci Rep. 2018;8 doi: 10.1038/s41598-018-31117-x. 12806. [DOI] [PMC free article] [PubMed] [Google Scholar]
- 23.Carpenter B, et al. Stan: A probabilistic programming language. J Stat Softw. 2017;76 doi: 10.18637/jss.v076.i01. [DOI] [PMC free article] [PubMed] [Google Scholar]
- 24.Namountougou M, et al. Multiple insecticide resistance in Anopheles gambiae sl populations from Burkina Faso, West Africa. PLoS One. 2012;7:e48412. doi: 10.1371/journal.pone.0048412. [DOI] [PMC free article] [PubMed] [Google Scholar]
- 25.Harris C, et al. Polymorphisms in Anopheles gambiae immune genes associated with natural resistance to Plasmodium falciparum. PLoS Pathog. 2010;6:e1001112. doi: 10.1371/journal.ppat.1001112. [DOI] [PMC free article] [PubMed] [Google Scholar]
- 26.Adolfi A, Pondeville E, Lynd A, Bourgouin C, Lycett GJ. Multi-tissue GAL4-mediated gene expression in all Anopheles gambiae life stages using an endogenous polyubiquitin promoter. Insect Biochem Mol Biol. 2018;96:1–9. doi: 10.1016/j.ibmb.2018.03.005. [DOI] [PubMed] [Google Scholar]
- 27.Organization, W. H. Test procedures for insecticide resistance monitoring in malaria vector mosquitoes. 2016. [Google Scholar]
- 28.Severo MS, et al. Unbiased classification of mosquito blood cells by single-cell genomics and high-content imaging. Proc Natl Acad Sci. 2018;115:E7568–E7577. doi: 10.1073/pnas.1803062115. [DOI] [PMC free article] [PubMed] [Google Scholar]
- 29.Schmittgen TD, Livak KJ. Analyzing real-time PCR data by the comparative CT method. Nat Protoc. 2008;3:1101–1108. doi: 10.1038/nprot.2008.73. [DOI] [PubMed] [Google Scholar]
- 30.Sockolosky JT, Szoka FC. Periplasmic production via the pET expression system of soluble, bioactive human growth hormone. Protein Expr Purif. 2013;87:129–135. doi: 10.1016/j.pep.2012.11.002. [DOI] [PMC free article] [PubMed] [Google Scholar]
- 31.Santolamazza F, et al. Insertion polymorphisms of SINE200 retrotransposons within speciation islands of Anopheles gambiae molecular forms. Malar J. 2008;7:163. doi: 10.1186/1475-2875-7-163. [DOI] [PMC free article] [PubMed] [Google Scholar]
- 32.Giraldo-Calderón GI, et al. VectorBase: an updated bioinformatics resource for invertebrate vectors and other organisms related with human diseases. Nucleic Acids Res. 2014;43:D707–D713. doi: 10.1093/nar/gku1117. [DOI] [PMC free article] [PubMed] [Google Scholar]
- 33.Kumar S, Stecher G, Tamura K. MEGA7: molecular evolutionary genetics analysis version 7.0 for bigger datasets. Mol Biol Evol. 2016;33:1870–1874. doi: 10.1093/molbev/msw054. [DOI] [PMC free article] [PubMed] [Google Scholar]
Associated Data
This section collects any data citations, data availability statements, or supplementary materials included in this article.


