

The viral envelope glycoprotein, known as “Env” in Retroviridae, is found on the virion surface and facilitates virus entry into cells by mediating cell attachment and fusion. Env is a major structural component of retroviruses and is targeted by all arms of the immune response, including adaptive and innate immunity. Less is known about how cell-intrinsic immunity prevents retrovirus replication at the level of individual cells. Here, we show that cellular IFITM3 and IFITM2 inhibit the fusion potential of retroviral virions by inhibiting Env protein via a two-pronged mechanism. IFITM proteins inhibit Env abundance in cells and also impair its function when levels are low. The posttranslational block of retroviral Env function by IFITM proteins is likely to impede both exogenous and endogenous retrovirus replication. In support of a relevant role for IFITM3 in retrovirus control, the retroviral accessory protein glycoGag counteracts IFITM3 function to promote virus infectivity.
KEYWORDS: IFITM, fusion, innate immunity, retroviruses, Env, viral glycoprotein
ABSTRACT
Interferon-induced transmembrane (IFITM) proteins are encoded by many vertebrate species and exhibit antiviral activities against a wide range of viruses. IFITM3, when present in virus-producing cells, reduces the fusion potential of HIV-1 virions, but the mechanism is poorly understood. To define the breadth and mechanistic basis for the antiviral activity of IFITM3, we took advantage of a murine leukemia virus (MLV)-based pseudotyping system. By carefully controlling amounts of IFITM3 and envelope protein (Env) in virus-producing cells, we found that IFITM3 potently inhibits MLV infectivity when Env levels are limiting. Loss of infectivity was associated with defective proteolytic processing of Env and lysosomal degradation of the Env precursor. Ecotropic and xenotropic variants of MLV Env, as well as HIV-1 Env and vesicular stomatitis virus glycoprotein (VSV-G), are sensitive to IFITM3, whereas Ebola glycoprotein is resistant, suggesting that IFITM3 selectively inactivates certain viral glycoproteins. Furthermore, endogenous IFITM3 in human and murine cells negatively regulates MLV Env abundance. However, we found that the negative impact of IFITM3 on virion infectivity is greater than its impact on decreasing Env incorporation, suggesting that IFITM3 may impair Env function, as well as reduce the amount of Env in virions. Finally, we demonstrate that loss of virion infectivity mediated by IFITM3 is reversed by the expression of glycoGag, a murine retrovirus accessory protein previously shown to antagonize the antiviral activity of SERINC proteins. Overall, we show that IFITM3 impairs virion infectivity by regulating Env quantity and function but that enhanced Env expression and glycoGag confer viral resistance to IFITM3.
INTRODUCTION
Mammals encode, as part of their innate immune systems, a number of proteins that interfere with viral infections in a cell-autonomous manner. Several of these are induced by interferon, which promotes an “antiviral state” in cells. In recent years, a number of host proteins have been identified that interfere with the synthesis, trafficking, and/or function of HIV-1 Envelope (Env), the viral glycoprotein that mediates virus attachment and fusion (1, 2). Among them are MARCH8, guanylate-binding proteins (GBP), ERManI, p90K, serine incorporator (SERINC) proteins, and the interferon-induced transmembrane (IFITM) proteins (3–10). The IFITM proteins, IFITM3 in particular, are known for inhibiting the entry of a wide array of viruses into host cells (11), and they also interfere with the fusogenicity of HIV-1 virions when expressed in virus-producing cells (12, 13). In both cases, the mechanisms of action are poorly understood.
While the precise mechanisms by which IFITM proteins decrease the fusogenicity of virions remain unclear, it is clear that Env is the major determinant governing sensitivity to inhibition by IFITM3. For example, certain strains of HIV-1 exhibit resistance to the IFITM3-mediated loss of virion infectivity, and resistance maps to the V3 region of Env (14). Moreover, endogenous IFITM3 colocalizes with HIV-1 Env in infected, primary CD4+ T cells (12). Ectopic IFITM3 has been reported to coimmunoprecipitate with HIV-1 Env in virus-producing 293T cells and to inhibit the proteolytic processing of the Env precursor, gp160, resulting in decreased virion incorporation of the gp120 (surface [SU]) and gp41 (transmembrane [TM]) units (15). However, the processing defect of Env may be cell type dependent because it was apparent in some cells (293T) but not in others (T lymphocytes) (7, 16, 17). Thus, a complete understanding of how IFITM3 impacts Env function is lacking.
The inhibition of virus infectivity by IFITM3 is not restricted to lentiviruses. The infectivities of HIV-based virus-like particles pseudotyped with murine leukemia virus (MLV) Env, vesicular stomatitis virus glycoprotein (VSV-G), and influenza A virus hemagglutinin are impaired by the presence of IFITM3 in virus-producing cells (13, 18). Furthermore, full-length, replication-competent viruses, including MLV, dengue virus, and Ebola virus [EBOV]) are also subject to inhibition of virion infectivity by IFITM3 (19). The breadth exhibited by IFITM3 in its capacity to inhibit virion infectivity suggests that it does so via a general mechanism and not through specific binding of viral glycoproteins.
In the present work, we investigated the effects of IFITM proteins on MLV pseudotypes carrying MLV Env or other viral glycoproteins. We report that the presence of IFITM3 and IFITM2 in virus-producing cells reduces viral infectivity. This reduction is due in part to the redirection of Env precursors to endolysosomes, leading to their degradation, and in part to impairment of the fusogenicity of the Env protein incorporated into virus particles. Surprisingly, these IFITM effects were counteracted by the MLV accessory protein glycoGag. The results provide significant new information on mechanisms of IFITM function.
RESULTS
IFITM3 reduces MLV infectivity by inhibiting Env in virus-producing cells.
To address the impact of IFITM3 on MLV virion infectivity and to identify the mechanisms involved, we produced MLV-based virus-like particles (here referred to as virus) in 293T cells via cotransfection of an MLV Gag-Pol plasmid, an MLV Env plasmid, an expression plasmid for human IFITM3, and an MLV-based luciferase plasmid. Released virions were assessed for infectivity on permissive target cells and characterized by immunoblotting. As shown in Fig. 1A and B, IFITM3 reduced virus-specific infectivity in a dose-dependent manner, with similar effects on viruses carrying ecotropic or xenotropic Env (Fig. 1A and B). Similar restriction was seen for full-length Moloney MLV, in which ecotropic Env was encoded in cis rather than on a separate plasmid (see Fig. S1A in the supplemental material).
FIG 1.

IFITM2 and IFITM3 inhibit MLV infectivity and decrease Env levels in virus-producing cells. (A) 293T were cotransfected with env-deficient MLV (2.5 μg), pBabeLuc (0.6 μg), ecotropic Env (0.5 μg), and empty pCMV6 or pCMV6-IFITM3 (0.03, 0.09, 0.27, or 0.81 μg). (B) Same as in panel A, except that xenotropic Env was used. (C) 293T were cotransfected with env-deficient MLV (2.5 μg), pBabeLuc (0.6 μg), ecotropic Env (0.5 or 0.1 μg), and empty pCMV6 or pCMV6-IFITM3 (0.27 μg). (D) Same as in panel C, except that xenotropic Env (0.5 or 0.1 μg) was used. (E) 293T cells were cotransfected with env-deficient MLV, ecotropic Env (0.1 μg), and empty pCMV6, pCMV6-IFITM1, pCMV6-IFITM2, pCMV6-IFITM3, or pQCXIP-FLAG-mIfitm3 (0.81 μg). (F) Same as in panel E, except xenotropic Env (0.1 μg) was used. The specific infectivities of viruses produced by transfected cells were measured as described in Materials and Methods; the specific infectivity of virus produced with empty vector was set to 100%. Numbers next to blots indicate molecular weight standards in kilodaltons or specific proteins, when indicated. Data represent averages of three to five independent experiments; for each experiment, infectivities were measured in triplicate and averaged. Statistical analysis for panels A, B, E, and F was performed using one-way ANOVA. Statistical analysis for panels C and D was performed using the Student t test. An asterisk marks a statistically significant difference from empty vector or from the paired condition indicated. Error bars represent standard deviations. *, P < 0.05; **, P < 0.0005.
Restriction of Moloney MLV infectivity by IFITM3 results from defect in virus entry. (A) 293T were cotransfected with Moloney MLV (2.5 μg), pBabeLuc (0.6 μg), and empty pCMV6 or pCMV6-IFITM3 (0.27, 0.81, or 2.4 μg) and virus-containing supernatants were used to infect HT1080/mCAT1 cells. Infection was measured by luciferase assay at 48 h postinfection. Virus-containing supernatants were filtered and ultracentrifuged through 20% sucrose, and SDS-PAGE and Western blotting were performed. (B) Virus was produced in 293T via transient transfection of Moloney MLV without glycoGag (2.5 μg), a plasmid encoding Gag-Cre (0.5 μg), and empty pCMV6 or pCMV6-IFITM3 (0.27 or 0.81 μg). Virus-containing supernatants were harvested at 48 and 72 h posttransfection, combined, and filtered through 0.45-μm-pore size filters. The entry capability of this virus was measured as described in Materials and Methods. (C) 293T cells serving as donor cells were transfected with R+ or R– ecotropic Env (1.2 μg), pCMV-IFITM3 (0.03, 0.09, 0.27, or 0.81 μg) and DSP1-7 (0.2 μg). 293T cells serving as target cells were transfected DSP8-11 (0.2 μg) and pcDNA-mCAT1 (2.4 μg). About 24 h posttransfection, producer cells were detached, and 50 μl of the cell suspension was transferred to a 96-well plate in triplicate. At 48 h posttransfection, target cells were incubated with 60 μM Enduren (Promega) and detached, and 50 μl of the cell suspension was mixed with producer cells resulting in a 30 μM final concentration of Enduren. Luciferase activity was measured 2 h after mixing producer and target cells. (D) Immunoblotting of gp70 and gp85 from Fig. 1C and D was quantified using LiCor Odyssey and ImageStudioLite. Data from “HI ENV” and “LO ENV” conditions from three separate blots are presented as gp70/gp85 ratio, with the ratio of virus produced with empty vector set to 100. (E) 293T cells were transfected with pCMV6-IFITM3 (0.27 μg) alone or pCMV6-IFITM3 and env-deficient MLV (2.5 μg). Supernatants were harvested from transfected cells at 48 h posttransfection, filtered, ultracentrifuged through 20% sucrose, and subjected to SDS-PAGE and Western blotting. (F) Virus produced with xenotropic Env (0.5 μg), empty pCMV6 or pCMV6-IFITM3 (0.27 μg) was used to challenge 293T cells stably expressing empty pQCXIP or pQXCIP-IFITM3, and the luciferase activity was measured at 48 h postinfection. 293T-Empty and 293T-FLAG-IFITM3 cell lines were stained with anti-FLAG, and the expression levels were assessed by flow cytometry. Data represent the average of three independent experiments; for each experiment, infectivities were measured in triplicate and averaged. Statistical analysis in panels A, B, and C was performed using one-way ANOVA. Statistical analysis in panels D and F was performed using the Student t test. *, P < 0.05; **, P < 0.0005. ns, not statistically significant. Download FIG S1, PDF file, 1.6 MB (1.7MB, pdf) .
This is a work of the U.S. Government and is not subject to copyright protection in the United States. Foreign copyrights may apply.
As one approach to identifying the step(s) in the infection process that is sensitive to inhibition by IFITM3, we tested the ability of viruses to enter new host cells using an assay that quantifies the delivery of Cre recombinase packaged into virions (20). The results showed that the loss in infectivity in virions produced in IFITM3-containing cells was closely correlated with their ability to enter cells; this has been previously shown with HIV-1 (12, 13) (Fig. S1B).
Like all retroviral Env proteins, MLV Env is cleaved by a furin-like cellular protease into the SU and the TM units as it is trafficked to the cell surface. However, the MLV TM is cleaved again near its C terminus during maturation of the released virus. This truncation of TM appears to activate the membrane-fusing potential of the Env complex; one manifestation of this potential is the ability of the truncated Env to induce fusion between cells expressing this protein and cells expressing the surface receptor for the virus (21, 22). We also found that IFITM3 inhibited cell-cell fusion mediated by this truncated (“R-”) Env (Fig. S1C). Taken together, the results in Fig. S1B and C suggest that IFITM3 blocks retroviral infectivity by interfering with the ability of viral Env to induce membrane fusion, as required for successful infection of new target cells.
In the initial experiments presented in Fig. 1A and B, we produced MLV in the presence of various amounts of IFITM3 expression plasmid. To further explore the relationship between IFITM3 and virus entry, we produced MLV with or without IFITM3 in the presence of various levels of Env. Interestingly, we found that reducing the amount of Env dramatically increased the sensitivity of virus to inhibition by IFITM3 (Fig. 1C and D). These results indicate that the effect of IFITM3 on retroviral infectivity is most potent when Env levels are limiting. Immunoblotting of these samples showed that inhibition of MLV infectivity by IFITM3 was associated with a reduction in Env proteins in cells and in virions produced by these cells (Fig. 1C and D). These results demonstrate that one effect of IFITM3 expression is to decrease the level of Env protein in cells.
However, quantitative comparisons showed that the reduction in virion-associated Env does not fully explain the loss of infectivity imparted by IFITM3. For example, virus produced with 0.5 μg of ecotropic Env plasmid (“HI ENV”) in the presence of IFITM3 (red bar, second lane) contains significantly more Env protein than virus produced with 0.1 μg of Env plasmid (“LO ENV”) in the absence of IFITM3 (blue bar, third lane), and yet the former is no more infectious than the latter (Fig. 1C). Similarly, virus produced with 0.5 μg of xenotropic Env plasmid (“HI ENV”) in the presence of IFITM3 (red bar, second lane) contains more Env protein than virus produced with 0.1 μg of Env plasmid (“LO ENV”) in the absence of IFITM3 (blue bar, third lane), and yet the former is less infectious than the latter (Fig. 1D). Thus, the inhibition of virion infectivity by IFITM3 does not result solely from a decrease in virus-associated Env. It appears that IFITM3 exerts two inhibitory effects: a reduction of Env protein available for incorporation into assembling virions and a reduction of the fusogenic capacity of virions made with the Env that remains.
Further examination of the immunoblots also revealed that IFITM3 expression resulted in an apparent Env processing defect, such that the amount of Env precursor gp85, relative to that of its cleavage product gp70 (SU), was greater in IFITM3-containing cells than in the control cells (Fig. 1C and D). Quantification of multiple immunoblots indicated that IFITM3 lowers the gp70/gp85 ratio of both ecotropic and xenotropic Env (Fig. S1D).
IFITM3 is a known resident of extracellular vesicles (23, 24) but is also a bona fide virion-associated protein (12, 13, 19, 25). IFITM3 was readily detectable in virus-containing supernatants (Fig. 1C and D), and IFITM3 levels were far higher in pellets from supernatants which contained virus than in those that did not (Fig. S1E). Nonetheless, in contrast to Env, the quantity of IFITM3 in supernatants did not clearly correlate with loss of virion infectivity (Fig. 1C and D).
Since the first antiviral function ascribed to the IFITM proteins was that of protecting naive target cells from virus infections, we challenged cells stably expressing IFITM3 with MLV pseudotyped with xenotropic Env. While IFITM3 in virus-producing cells strongly inhibited infection, IFITM3 in target cells did not significantly inhibit infection (Fig. S1F).
We also tested whether the ability to inhibit MLV infectivity was shared among related IFITM proteins. Human IFITM2, but not IFITM1, restricted MLV infectivity to a similar degree as human IFITM3, and murine Ifitm3 also performed this function albeit to a slightly lesser extent (Fig. 1E and F). Restriction by each IFITM homolog was associated with a loss of Env from virions, consistent with the idea that quantitative regulation of Env is a contributor to the restriction phenotype.
We also performed analogous experiments on particles with HIV-1 cores and HIV-1 Env. Just as with MLV, restriction of HIV-1 infectivity by IFITM3 was maximal when small amounts of HIV-1 Env were used to pseudotype particles (Fig. 2). Furthermore, levels of gp120 (SU) and gp41 (TM) in supernatants were modestly diminished in the presence of IFITM3 (Fig. 2).
FIG 2.
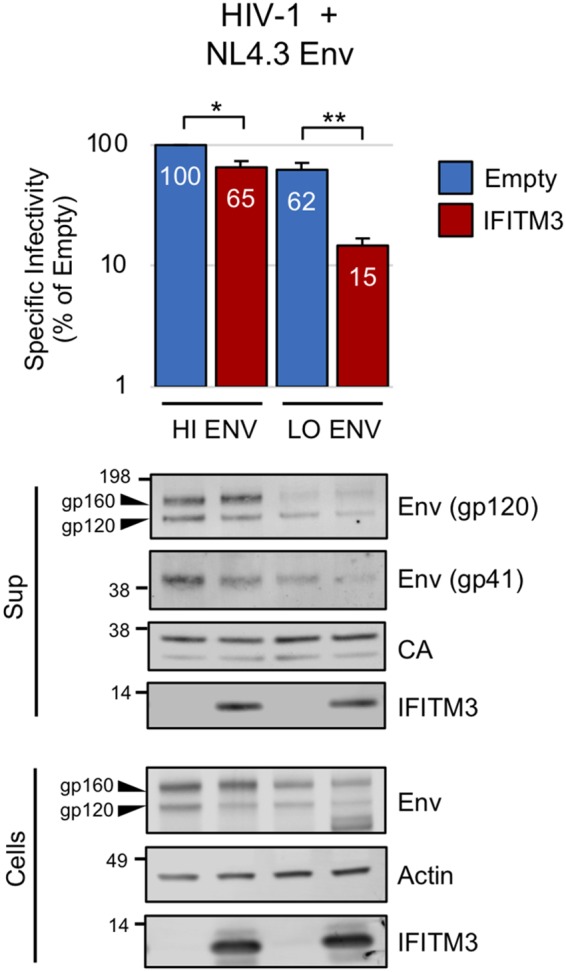
IFITM3 inhibits HIV-1 infectivity when HIV-1 Env levels are limiting. 293T cells were cotransfected with env-deficient HIV-1 NL4.3 Luc (2.5 μg), pIII-NL-Env (0.5 or 0.1 μg), and empty pCMV6 or pCMV6-IFITM3 (0.27 μg). The specific infectivities of viruses produced by transfected cells were measured as described in Materials and Methods. Numbers next to blots indicate molecular weight standards in kilodaltons or specific proteins, when indicated. Data represent the averages of three independent experiments; for each experiment, infectivities were measured in triplicate and averaged. Statistical analysis was performed with the Student t test. *, P < 0.05; **, P < 0.0005.
IFITM3 inhibits infectivity driven by VSV-G but not EBOV GP.
It was also of interest to assess the breadth of the antiviral activity of IFITM3. We therefore tested MLV particles carrying nonretroviral glycoproteins VSV-G and EBOV glycoprotein (EBOV GP). In our initial experiments, we saw no reduction in the infectivity of these particles by IFITM3 (Fig. 3A and B). However, when we reduced the amounts of VSV-G and EBOV GP plasmids in the transfections, we found that the VSV-G pseudotype was rendered sensitive to IFITM3 (Fig. 3C). As observed with MLV Env, inhibition of VSV-G-mediated infectivity at low doses of VSV-G was accompanied by a reduction in the level of VSV-G incorporation (Fig. 3C). In contrast, IFITM3 showed no ability to inactivate EBOV GP, even when transfection of less EBOV GP plasmid resulted in decreased infectivity (Fig. 3D). It should be noted that a prior report indicated that intact, replication-competent EBOV was impaired in infectivity by IFITM3 (19); our disparate observations could be reconciled if EBOV proteins other than GP contribute to sensitivity to IFITM3.
FIG 3.

IFITM3 inhibits infectivity mediated by VSV-G but not EBOV GP. (A) 293T cells were cotransfected with env-deficient MLV (2.5 μg), pBabeLuc (0.6 μg), VSV-G (0.2 μg), and empty pCMV6 or pCMV6-IFITM3 (0.03, 0.09, 0.27, or 0.81 μg). (B) Same as in panel A, except that EBOV GP (0.2 μg) was used. (C) 293T were cotransfected with env-deficient MLV (2.5 μg), pBabeLuc (0.6 μg), VSV-G (0.04 or 0.008 μg), and empty pCMV6 or pCMV6-IFITM3 (0.27 μg). (D) Same as in panel C, except that EBOV GP (0.2, 0.04, or 0.008 μg) was used. A second image of supernatants is provided under high contrast settings to visualize intermediate amounts of EBOV GP. The specific infectivities of viruses produced by transfected cells were measured as described in Materials and Methods. Data represent the averages of three independent experiments; for each experiment, infectivities were measured in triplicate and averaged. Statistical analysis for panels A and B was performed using one-way ANOVA. Statistical analysis for panels C and D was performed using the Student t test. *, P < 0.05; **, P < 0.0005.
IFITM3 interferes with Env trafficking and promotes its degradation in endolysosomes.
The data presented above show that expression of IFITM3 together with viral Gag, Pol, and Env proteins leads to a reduction in the level of Env in cells (and in virions). To simplify our analysis, we also tested the effect of IFITM3 on Env levels in the absence of other viral constituents. As shown in Fig. 4A, the IFITM3 expression plasmid drastically reduced the level of ecotropic Env protein in cells in cotransfected cells. Interestingly, the levels of two cellular glycoproteins, EGFR and IGF-1R, were unaffected (Fig. 4A). These results suggest that IFITM3 selectively reduces the quantity of viral glycoproteins without generally impacting cellular glycoproteins.
FIG 4.

IFITM3 interferes with Env trafficking and promotes its degradation in endolysosomes. (A) 293T cells were transfected with ecotropic Env (0.5 μg) alone or ecotropic Env and pCMV6-IFITM3 (0.27 μg). Transfected cells were lysed at 72 h posttransfection and subjected to SDS-PAGE and Western blotting. (B) 293T cells were transfected with ecotropic Env (1.3 μg) alone, ecotropic Env R469A (1.3 μg) alone, ecotropic Env and pCMV6-IFITM3 (0.20 μg), or not transfected (NT). Cells were lysed 48 h posttransfection. Under the conditions indicated, bafilomycin A1 (1 or 5 μM) was added for a period of 8 h prior to lysing cells. SDS-PAGE and Western blotting was performed. (C) 293T cells were transfected with ecotropic Env-EGFP (0.1 μg) alone or ecotropic Env-EGFP and pCMV6-IFITM3 (0.02 μg). Cells were labeled with LAMP1-RFP using the Cell Bright-Lyso reagent approximately 16 h prior to imaging. Living cells were imaged at 48 h posttransfection. Mander’s coefficients were calculated to determine the proportion of Env-EGFP colocalizing with LAMP1-RFP in the absence (0.20 ± 0.06) or presence of IFITM3 (0.48 ± 0.03). Scale bar, 10 μm. The Western blot analysis and fluorescence images are representative of three independent experiments.
Two major routes of intracellular protein degradation are the endolysosomal and proteasomal pathways. To determine whether one of these was involved in the loss of viral glycoprotein from cells expressing IFITM3, we tested the effect of bafilomycin A1 (BafA1), which inhibits endolysosomal acidification, and of MG132, a proteasome inhibitor. As shown in Fig. 4B, BafA1 rescues Env protein from IFITM3-induced loss, while MG132 had no effect (Fig. S2A). However, the Env protein detected in the presence of BafA1 also migrated more slowly in SDS-PAGE than the gp70 (SU) in control cells. In fact, it exhibited the same mobility as the gp85 precursor, as shown by comparison to an Env mutant defective for furin-mediated processing (R469A) (Fig. 4B). Taken together, these results suggest that IFITM3 interferes with furin-catalyzed processing of the Env precursor, followed by its degradation in endolysosomes.
Loss of Env from IFITM3-expressing cells results from lysosomal degradation and not proteasomal degradation. (A) 293T cells were transfected with ecotropic Env (1.3 μg) alone, ecotropic Env and pCMV6-IFITM3 (0.20 μg), or nontransfected (NT). Cells were lysed at 48 h posttransfection. Under the conditions indicated, MG132 (1 or 5 μM) was added for a period of 8 h prior to lysing cells. SDS-PAGE and western blotting was performed. (B) 293T cells were transfected with ecotropic Env-EGFP (0.1 μg) alone or ecotropic Env-EGFP and pCMV6-IFITM3 (0.02 μg). LysoTracker Deep Red reagent was added to living cells at 50 nM 15 min prior to imaging. Living cells were imaged at 48 h posttransfection. Scale bar, 10 μm. Western blot analysis and fluorescence images are representative of three independent experiments. Download FIG S2, PDF file, 2.7 MB (2.8MB, pdf) .
This is a work of the U.S. Government and is not subject to copyright protection in the United States. Foreign copyrights may apply.
It was also of interest to visualize the effects of IFITM3 on Env protein localization in living cells. For this purpose, we used an MLV Env protein that contains EGFP, but retains full functionality (26). We localized endolysosomes both with LAMP1-RFP and with LysoTracker. As shown in Fig. 4C, the Env protein exhibited extensive plasma membrane localization and was also present in perinuclear regions. In contrast, in the presence of IFITM3, the Env signal was absent from the plasma membrane and instead accumulated in LAMP1-positive endolysosomes. Similar colocalization between Env and LysoTracker is shown in Fig. S2B. It is interesting to note that the antiviral function of IFITM3 in target cells involves the apparent degradation of incoming virions in endolysosomes as well (27, 28). We calculated Mander’s coefficients to quantify the proportion of Env-GFP colocalizing with LAMP1-RFP in the absence (0.20 ± 0.06) or presence (0.48 ± 0.03) of IFITM3. We also visualized a fluorescently tagged version of IFITM3 (IFITM3-mCherry) and Env-EGFP and found that the two signals partially colocalized in vesicular structures that are likely endolysosomes (Video S1).
Together, our findings demonstrate that ectopic IFITM3 interferes with MLV Env processing and trafficking and leads to Env degradation in endolysosomes, resulting in a paucity of Env incorporation into virions.
Endogenous IFITM3 negatively regulates Env protein accumulation.
While the data presented so far illustrate the impacts of ectopic IFITM3 on MLV Env, it was unknown whether endogenous IFITM3 in human or murine cells restricts Env accumulation. When we transfected equal amounts of ecotropic Env plasmid into HeLa and HeLa IFITM3 knockout (KO) cells, we found that more Env protein was present in the KO cells (Fig. 5A). When human IFITM3 was reintroduced into IFITM3 KO cells, Env detection was suppressed. Similar results were obtained with xenotropic Env (Fig. S3A). We also tested the possibility that transfection was more efficient in the KO cells than in the control cells by transfecting a Gaussia luciferase expression vector; as shown in Fig. S3B, Gaussia luciferase production was not markedly affected by IFITM3 KO.
FIG 5.

Endogenous IFITM3 negatively regulates Env protein accumulation. (A) HeLa or HeLa IFITM3 KO cells were transfected with Gaussia luciferase (0.001 μg), ecotropic Env (1.2 or 0.5 μg), or ecotropic Env and pCMV6-IFITM3 (0.25 μg). Transfected cells were lysed at 48 h posttransfection and subjected to SDS-PAGE and Western blotting. (B) HeLa cells were transfected with ecotropic Env (1.2 μg) and 20 or 40 nM IFITM3 siRNA or 40 nM control siRNA using Lipofectamine 2000. Transfected cells were lysed at 48 h posttransfection and subjected to SDS-PAGE and Western blotting. (C) MEFs and IfitmDel MEFs were transfected with ecotropic Env-EGFP (0.15 μg) or ecotropic Env-EGFP and pQCXIP-Ifitm3 (0.05 μg). Living cells were imaged at 48 h posttransfection. Under the conditions indicated, bafilomycin A1 (1 μM) was added for 8 h prior to imaging. Scale bar, 10 μm. The Western blot analysis and immunofluorescence images are representative of three independent experiments.
Endogenous IFITM3 reduces Env protein levels. (A) HeLa or HeLa IFITM3 KO were transfected with Gaussia luciferase, xenotropic Env (1.2 or 0.5 μg), or xenotropic Env and pCMV6-IFITM3 (0.25 μg). Transfected cells were lysed at 48 h posttransfection and subjected to SDS-PAGE and Western blotting. (B) Gaussia luciferase measurements were made in transfected HeLa and HeLa IFITM3 KO cells at 48 h posttransfection. (C) MEF WT and MEF IfitmDel were lysed and subjected to SDS-PAGE and Western blotting. (D) MEF WT or MEF IfitmDel were transfected with pcDNA-EGFP (2.5 μg) or pCD-Env-EGFP (2.5 μg) and GFP+ cells were quantified by flow cytometry at 24 hours posttransfection and analyzed according to %GFP+ cells and mean fluorescence intensity (MFI) of GFP+ cells. Western blot analysis and Gaussia luciferase assay data in transfected HeLa cells are representative of three independent experiments. Flow cytometry data tracking EGFP and Env-EGFP levels in transfected MEF represent the averages of three independent experiments. Statistical analysis in panels B and D was performed with the Student t test. *, P < 0.05. Download FIG S3, PDF file, 1.0 MB (1MB, pdf) .
This is a work of the U.S. Government and is not subject to copyright protection in the United States. Foreign copyrights may apply.
In an additional test of the idea that endogenous IFITM3 reduces Env protein levels, we used RNAi-mediated knockdown of IFITM3 to suppress IFITM3 expression. As shown in Fig. 5B, Env plasmid transfection into cells treated with IFITM3 small interfering RNA (siRNA) led to an increase in intracellular Env levels relative to cells treated with control siRNA.
We also took advantage of the availability of mouse embryonic fibroblasts (MEFs) from mice in which the Ifitm locus had been ablated (IfitmDel mice) to visualize the effects of murine Ifitm proteins on viral Env quantity and localization. We confirmed by immunoblotting that murine Ifitm3 is undetectable in IfitmDel cells (Fig. S3C). The Env-EGFP plasmid was transfected into MEF wild type (WT) and MEF IfitmDel and, as shown in Fig. 5C, the Env-EGFP signal exhibited greater intensity and a greater extent of apparent cell surface localization in MEF IfitmDel cells than in MEF WT cells, as determined by both confocal microscopy and flow cytometric analysis (Fig. 5C and see Fig. S3D in the supplemental material). Introduction of murine Ifitm3 into IfitmDel cells reduced overall Env-EGFP detection, and treatment with BafA1 led to the partial recovery of intracellular Env-EGFP signal (Fig. 5C). In contrast, expression of a construct encoding EGFP alone was comparable between the MEF WT and MEF IfitmDel (Fig. S3D). These results suggest that endogenous human and murine IFITM3/Ifitm3 are both negative regulators of MLV Env proteins.
GlycoGag rescues retroviral infectivity in the presence of IFITM3.
In inhibiting HIV-1 infectivity when expressed in virus-producing cells, the IFITM proteins resemble members of another family of transmembrane proteins known as SERINC (4, 5). Moreover, it was found that Nef of HIV-1, S2 of EIAV, and glycosylated Gag (glycoGag) of MLV all antagonize the antiviral function of SERINC3 and SERINC5 (4, 5, 20, 29). Importantly, a glycoGag-negative MLV clone was used in our experiments described above. To examine the effects of glycoGag on IFITM3 activity, we compared the antiviral restriction activities of IFITM3 and SERINC5 against MLV pseudotyped with xenotropic and ecotropic Env. In these experiments, MLV clones were used in which the glycoGag coding region had either been destroyed or remained intact (20). Ectopic expression of IFITM3 and SERINC5 restricted infectivity driven by xenotropic Env by 20- and 50-fold, respectively (Fig. 6A). We were unable to detect ectopic SERINC5 produced under these conditions by Western blotting (Fig. S4A). Unlike IFITM3, SERINC5 did not affect Env levels (Fig. 6A). As previously described (20), in cis expression of glycoGag partially rescued the virus infectivity defect imposed by SERINC5. Unexpectedly, the loss of infectivity imparted by IFITM3 was also partially rescued by glycoGag (Fig. 6A). In contrast, the infectivity of virus produced with ecotropic Env or VSV-G was restricted by IFITM3, but glycoGag did not augment infectivity in either case (Fig. S4B and C). These results suggest that the influence of glycoGag on virion infectivity is viral glycoprotein dependent.
FIG 6.
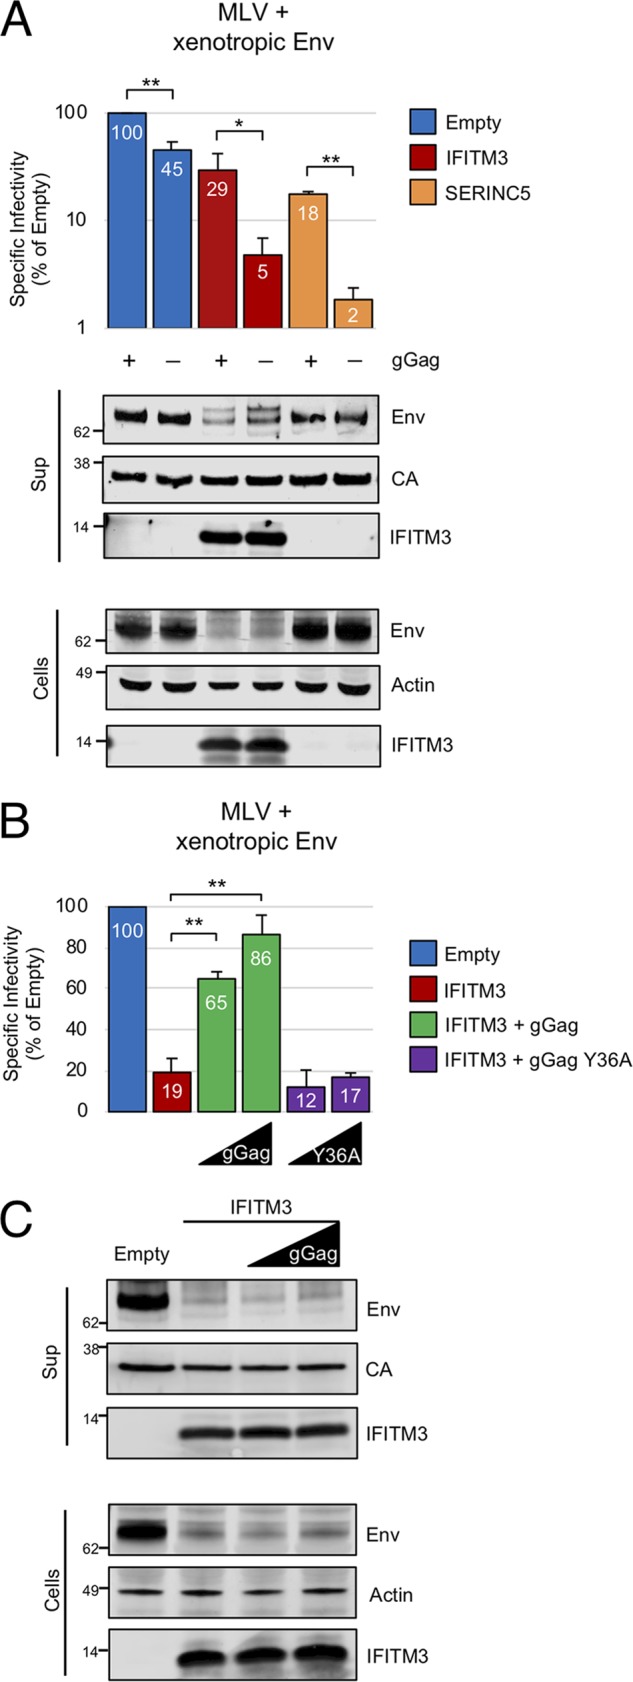
glycoGag rescues retroviral infectivity in the presence of IFITM3. (A) 293T were cotransfected with env-deficient MLV encoding or not encoding glycoGag (2.5 μg), pBabeLuc (0.6 μg), xenotropic Env (0.5 μg), and empty pCMV6, pCMV6-IFITM3 (0.83 μg), or pBJ5-SERINC5 (0.093 μg). (B) 293T were cotransfected with env-deficient MLV (2.5 μg), pBabeLuc (0.6 μg), xenotropic Env (0.5 μg), and empty pCMV6, pCMV6-IFITM3 (0.27 μg). Under the indicated conditions, pCMV-glycoGag-myc of pCMV-glycoGag Y36A-myc (0.01 or 0.03 μg) were included. The specific infectivities of viruses produced by transfected cells were measured as described in Materials and Methods. (C) Transfected cells were lysed at 72 h posttransfection, and virus-containing supernatants from 48 and 72 h posttransfection were filtered, ultracentrifuged through 20% sucrose. Then, SDS-PAGE and Western blotting were performed. The data represent the averages of three independent experiments; for each experiment, infectivities were measured in triplicate and averaged. Statistical analysis in panel A was performed with the Student t test. Statistical analysis in panel B was performed using one-way ANOVA. *, P < 0.05; **, P < 0.0005.
MLV glycoGag overcomes IFITM3-mediated restriction in a viral glycoprotein-dependent manner. (A) Cell lysates from Fig. 6A were migrated by SDS-PAGE, and Western blotting was performed with anti-SERINC5. Ectopic SERINC5 produced from the 0.093-μg amount of pBJ-SERINC5 used in Fig. 6A could not be detected above levels of endogenous SERINC5. Lysates from cells transfected with 2.0 μg of pBJ-SERINC5 are provided for comparison. (B) 293T cells were cotransfected with env-deficient MLV encoding or not encoding glycoGag (2.5 μg), pBabeLuc (0.6 μg), ecotropic Env (0.5 μg), and empty pCMV6, pCMV6-IFITM3 (0.83 μg), or pBJ5-SERINC5 (0.093 μg) and virus-containing supernatants were used to infect HT1080/mCAT1 cells. Infection was measured by luciferase assay at 48 h postinfection. Data represent the averages of three independent experiments; for each experiment, infectivities were measured in triplicate and averaged. Transfected cells were lysed at 72 h posttransfection, and virus-containing supernatants from 48 and 72 h posttransfection were filtered, ultracentrifuged through 20% sucrose, and analyzed by SDS-PAGE and Western blotting. (C) Same as in panel B, except VSV-G (0.2 μg) was used instead. (D) 293T cells were transfected with the indicated amounts of pCMV-glycoGag-myc; the cells were lysed at 48 h posttransfection, and SDS-PAGE and Western blotting were performed. The amounts of pCMV-glycoGag-myc used in Fig. 6B (0.01 or 0.03 μg) are undetectable. Statistical analysis in panels B and C was performed with the Student t test. *, P < 0.05. Download FIG S4, PDF file, 0.2 MB (160KB, pdf) .
This is a work of the U.S. Government and is not subject to copyright protection in the United States. Foreign copyrights may apply.
We also tested whether glycoGag supplied in trans was capable of overcoming restriction by IFITM3. We previously found that a limited quantity of glycoGag protein is needed to rescue MLV infectivity in the presence of SERINC5 and that larger amounts of glycoGag are detrimental to virion infectivity (20). Here, small quantities of glycoGag, which were undetectable by Western blotting (Fig. S4D), largely restored infectivity in the presence of IFITM3 (Fig. 6B). In contrast, glycoGag mutated in its AP-2 recognition motif (Y36A) did not, suggesting that endocytosis of glycoGag is necessary for its ability to counteract the effects of IFITM3 (Fig. 6B). Intriguingly, immunoblotting revealed that glycoGag did not alter the levels of Env or IFITM3 (Fig. 6C). These data represent the first demonstration of a viral accessory protein conferring resistance to an IFITM protein. Moreover, the fact that glycoGag expression confers resistance to IFITM3 without affecting Env quantity suggests that glycoGag blocks a cryptic function of IFITM3 which impairs the fusogenic potential of virions.
DISCUSSION
Much of our understanding of the interplay between retroviruses and host immunity derives from the study of primate lentiviruses, namely, HIV-1 and its ancestor, SIV (30–33). In addition, the coevolution of MLV and mice over millions of years has been used to reveal mechanisms of host control of exogenous and endogenous viral forms (34, 35). Here, we used MLV to dissect the antiviral mechanism of IFITM3 and to discover modes of viral evasion.
We found that IFITM3 inhibits the proteolytic processing of the MLV Env precursor, resulting in decreased glycoprotein incorporation into virions. In addition, IFITM3 directs Env toward lysosomes for proteolytic degradation, which is likely a feature of how IFITM3 inhibits HIV-1 Env and VSV-G as well. Therefore, we have shown that IFITM3 negatively regulates several retroviral and nonretroviral glycoproteins, revealing that this function is not specific to HIV-1 Env and thus unlikely to result from a specific IFITM3-Env interaction. Rather, IFITM3 may reroute viral glycoprotein traffic in a nonspecific manner via its ability to impact vesicular trafficking and fusion events. We believe that IFITM3 shunts Env away from the secretory pathway at a stage prior to the trans-Golgi network (TGN), where cleavage by a furin-like protease occurs. Blotting of Env mutated in the furin recognition site (R469A) revealed a slow-migrating molecular species that is likely Env modified with complex carbohydrates, a transient decoration that is applied during passage through the Golgi compartment. However, no such bands were detected on Env expressed in the presence of IFITM3, suggesting that IFITM3 results in Env trafficking away from the Golgi compartment where complex carbohydrates are added (Fig. 4B). Therefore, our results may suggest that IFITM3 reroutes Env from the endoplasmic reticulum or from an early Golgi compartment toward endolysosomes, preventing an encounter with furin in the TGN and thus giving rise to the observed processing defect.
Our data also show that inhibition of virus infectivity by IFITM3 does not solely result from reductions in Env quantity. By experimentally limiting viral glycoprotein incorporation into virions, we show that the impact of IFITM3 on virion infectivity is greater than the impact of reducing viral glycoprotein incorporation. These data suggest that Env function itself may be targeted by IFITM3, and certain possibilities include the inhibition of Env trimer formation, the inhibition of trimer mobility or trimer clustering in virions, or the inhibition of membrane fusion activity. The quantitative and qualitative impacts of IFITM3 on Env may represent a two-pronged approach that allows IFITM3 to more potently inhibit virion infectivity, since the reduction of Env protein levels sensitizes virus to the effect of IFITM3 on Env function.
We also found that viruses incorporating greater amounts of Env are less sensitive to restriction by IFITM3 in virus-producing cells. Intriguingly, IFITM proteins can also restrict lentiviral infections when they are present in target cells, rather than virus-producing cells, and the extent of lentiviral Env incorporation into virions is also a determinant of this restriction (36). The link between virion-associated Env and sensitivity to IFITM proteins is further supported by a recent publication. Sharma et al. discovered that the use of Env variants which are adapted to macaque lymphocytes confers chimeric SIV-HIV (SHIV) with resistance to macaque IFITM proteins. Importantly, SHIV encoding macaque-adapted Env were distinguished by two features: (i) they incorporated much higher levels of Env, and (ii) they incorporated much less IFITM3 compared to their nonadapted counterparts (25).
Overall, these results suggest that IFITM3 regulates both the abundance of Env and its function in virions, revealing an additional layer of innate protection likely to be important for the suppression of exogenous and endogenous retroviruses in multiple species. Our demonstration that endogenous Ifitm proteins in murine cells inhibit the accumulation of MLV Env suggest that they may be constituents of the cell-intrinsic machinery that suppresses endogenous retroviruses (37). Indeed, it was recently reported that IFITM proteins inhibit the activity of Syncytin proteins, which are encoded by endogenous retroviral env genes and have been coopted by host cells to mediate placental trophoblast fusion (38, 39).
Of all the cellular antiviral proteins targeting Env function, SERINC3/5 may be of particular importance because it is counteracted by retroviral accessory proteins Nef (HIV-1), glycoGag (MLV), and S2 (EIAV). Here, we present evidence that IFITM3 function is also overcome by glycoGag. This represents the first description of a viral auxiliary protein capable of overcoming IFITM3 and restoring virion infectivity. Our data suggest that glycoGag does not alter levels of IFITM3 or Env, hinting that it counteracts the effect of IFITM3 on Env function. Since glycoGag was previously shown to antagonize SERINC5, our data raise the intriguing possibility that IFITM3 function is linked to that of SERINC5. It has been reported that glycoGag and Nef reduce SERINC5 expression by directing it to endolysosomes for degradation (40, 41). Furthermore, glycoGag requires an AP-2-binding site to overcome the effects of both SERINC5 (42) and IFITM3, indicating that internalization of glycoGag is important for its function. Important future work will probe the functional interdependence between IFITM proteins and SERINC family members in virus restriction.
MATERIALS AND METHODS
Cell lines and plasmids.
All cell lines were cultured in Dulbecco modified Eagle medium containing 10% fetal calf serum and 1% penicillin-streptomycin (Thermo Fisher). 293T and HeLa cells were obtained from ATCC (CRL-3216 and CCL-2, respectively). IFITM3 KO HeLa cells were generated by CRISPR/Cas9 and described previously (43). 293T/mCAT1 cells were generated with pcDNA-MCAT1 (a gift from Lorraine Albritton) (44). HT1080/mCAT1 cells were described previously (20). MEFs and IfitmDel MEFs were kindly provided by Michael S. Diamond (Washington University) (45, 46). pCMV6-XL5 encoding untagged human IFITM1, IFITM2, or IFITM3 was purchased from Origene (SC117830, SC124192, and SC112616). pQCXIP encoding FLAG-Ifitm3 was obtained from Chen Liang (McGill University). The following plasmids used in this study have been described previously: plasmids encoding env-deficient Moloney MLV Gag-Pol with or without glycoGag (20), pCMV-glycoGag-myc and pCMV-glycoGag Y36A-myc (20), a plasmid encoding HIV-1 NL4.3 lacking vpr and containing luciferase in place of env (a gift from Vineet KewalRamani and Alok Mulky), pBabeLuc (47), pCD-Env encoding ecotropic Env (48), pCMV-Xenogp85 expressing xenotropic Env (a gift from Heinrich G. Gottlinger [University of Massachusetts]), pIII-NL encoding HIV-1 NL4.3 Env (a gift from Eric O. Freed), pCMV-VSV-G encoding the vesicular stomatitis virus G protein (Addgene, catalog no. 8454), pCAGGS-EboGPz encoding Ebolavirus Zaire glycoprotein (a gift from Paul Bates [University of Pennsylvania]) (49), pBJ5-SERINC5 (5), and a plasmid encoding MLV Gag-Cre fusion protein (20). pCD-Env-EGFP encoding GFP-tagged ecotropic Env was created by inserting EGFP into pCD-Env between residues 265 and 273 as outlined previously (26). The plasmids used for the Double Split Protein-based cell fusion assay (pDSP 1-7 and pDSP 8-11) were a gift from Zene Matsuda (University of Tokyo) (50). IFITM3-mCherry (amino-terminal tag) was produced by Genecopoeia. A plasmid encoding Gaussia luciferase was a gift from Stanislas Kaczmarczyk, and pcDNA-EGFP was obtained from Addgene (catalog no. 13031).
Virus production and infectivity assay.
Virus was produced in 293T via transient transfection with Mirus TransIT-293. Briefly, 400,000 293T cells were seeded in a 6-cm dish. For MLV-based pseudotype production, cells were cotransfected with a plasmid encoding env-deficient MLV Gag-Pol with or without glycoGag (2.5 μg), a glycoprotein expression plasmid (various amounts), pBabeLuc (0.6 μg), and pUC-CMV as a filler plasmid to bring the total DNA amount to 5 μg per transfection. Depending on the experiment, transfections also included various amounts of pCMV6-IFITM1, pCMV6-IFITM2, pCMV6-IFITM3, pQCXIP-Ifitm3 (murine), or pBJ5-SERINC5. For HIV-1-based pseudotype production, cells were cotransfected with pNL4.3 Luc (2.5 μg), pIII-NL-Env (variable amounts), and pUC-CMV as a filler plasmid to bring total DNA amount to 5 μg per transfection. Virus-containing supernatants were harvested at 48 and 72 h posttransfection, combined, and filtered through 0.45-μm-pore size filters. For infectivity measurements, HT1080/mCAT1 cells (for MLV pseudotypes) and TZM.bl (HIV-1 pseudotypes) were used as target cells and seeded in 6-well plates at 100,000 cells per well. The following day, cells were infected with 0.5 ml of the virus-containing supernatant and firefly luciferase activity was measured in cell lysates at approximately 48 h postinfection. Luciferase assays were performed using luciferase assay system (Promega) according to the manufacturer’s protocol. Firefly luciferase assay output was normalized to the amount of input virus as determined by quantitative anti-CA immunoblotting of the filtered, virus-containing supernatant following ultracentrifugation through 20% sucrose. The normalized luciferase assay output was designated as “specific infectivity.”
Virus entry assay.
Virus was produced in 293T via transient transfection of Moloney MLV without glycoGag (2.5 μg), a plasmid encoding Gag-Cre (0.5 μg), and empty pCMV6 or pCMV6-IFITM3 (0.27 or 0.81 μg). Virus-containing supernatants were harvested at 48 and 72 h posttransfection, combined, filtered through 0.45-μm-pore size filters, and used to infect HT1080/mCAT1 cells stably expressing a Cre-dependent luciferase cassette known as p231 (20). Virus entry into cells was determined by luciferase assay of infected cells at 48 h after virus addition. Firefly luciferase assay output was normalized to the amount of input virus as determined by quantitative anti-CA immunoblotting of the filtered, virus-containing supernatant following ultracentrifugation through 20% sucrose. The normalized luciferase assay output was designated as “specific entry.”
Western blot analysis.
Cells were lysed in a cocktail of 1× NuPAGE LDS sample buffer (Thermo Fisher), 1× NuPAGE Sample reducing agent (Thermo Fisher), and 1× EDTA-free HALT protease inhibitor (Thermo Fisher). Cell lysates were homogenized by sonication and stored at –80°C. Virions for Western blot analyses were concentrated by ultracentrifugation (25,000 × g, at 4°C for 1h) through a cushion of 20% sucrose prepared in TNE buffer (10 mM Tris-HCl [pH 7.5], 100 mM NaCl, 1 mM EDTA). Sucrose-purified virus was resuspended with 1× NuPAGE LDS sample buffer supplemented with 1× NuPAGE sample reducing agent. Cell lysates and virions were heated at 90°C for 3 min and electrophoresed on NuPAGE 4 to 12% Bis-Tris polyacrylamide gels (Thermo Fisher), followed by transfer to Immobilon-FL polyvinylidene difluoride membrane (Millipore). Membranes were blocked in a 1:1 mixture of Odyssey blocking buffer (Li-Cor) and phosphate-buffered saline and probed with the following primary antibodies: goat anti-gp70 (a gift from Christine A. Kozak and Stephen Oroszlan [51]), rabbit anti-p30 (a gift from Stephen Orozlan), sheep anti-gp120b (NIH AIDS Reagent Resource, catalog no. 288), human anti-gp41 (NIH AIDS Reagent Resource, catalog no. 1475), mouse anti-p24 CA (NIH AIDS Reagent Resource, catalog no. 3537), rabbit anti-IFITM3 (Abcam, ab109429 [EPR5242]), mouse anti-IFITM2/3 (Proteintech, 66081-1-Ig), mouse anti-IFITM1 (Proteintech, 60074-1-Ig), rabbit anti-Fragilis (Abcam, ab15592, for detection of murine Ifitm3), rabbit anti-SERINC5 (Abcam, ab204400), mouse anti-FLAG M2 (Sigma, F1804), mouse anti-myc 9E10 (Sigma, M4439), rabbit anti-VSV-G (BioLegend, 903901), mouse anti-Ebola GP (clone 6D8, a gift from Rajini Mudhasini, USAMRIID), mouse anti-IGFR-1b (Santa Cruz Biotechnology, sc-390130), mouse anti-EGFR (Abcam, ab32077), and mouse anti-actin (Santa Cruz Biotechnology, C4 sc-47778). Secondary antibodies conjugated to DyLight 800 or 680 (Li-Cor) and the Li-Cor Odyssey imaging system were used to reveal specific protein detection. Images were analyzed and assembled using ImageStudioLite (Li-Cor).
Envelope protein production in IFITM-deficient cells.
Wild-type or IFITM3 KO HeLa cells (43) were seeded in 12-well plates at 300,000 cells per well and transfected with pCD-Env (1.2 or 0.5 μg) or pCMV-Xenogp85 (1.2 or 0.5 μg) using Lipofectamine 2000 (Thermo Fisher). Cotransfection of pCD-Env plasmid (1.4 μg) and negative-control siRNA (Ambion, Silencer Select, Negative Control no. 1) or siRNA against IFITM3 (Ambion, Silencer Select, s195035) using Lipofectamine 2000 was performed in HeLa cells seeded in 12-well plates at 300,000 cells per well. Cells were collected at 48 h posttransfection, lysed, and subjected to SDS-PAGE as described above. MEFs and IfitmDel MEFs were seeded in Lab-Tek II chamber slides (Thermo Fisher) at 15,000 cells per chamber and transfected with pCD-Env-EGFP (0.1 μg), with or without pQCXIP-FLAG-mIfitm3 (0.02 μg), using Lipofectamine 2000. At 48 h posttransfection, living cells were imaged using a TCS SP8 confocal laser scanning microscope (Leica). Twelve-bit images with a 1,024 × 1,024 field size were acquired at 100× oil immersion magnification, and Z-stack images were produced using ImageJ (Fiji).
Fluorescence confocal microscopy.
293T cells were seeded in Ibidi mu-slide eight-well chambers at 15,000 cells per chamber and transfected with pCD-Env-EGFP (0.1 μg), with or without pCMV6-IFITM3 (0.02 μg) or IFITM3-mCherry (0.02 μg) using Mirus LT1. At 32 h posttransfection, 25 μl of Cell Light Lyso-RFP (Thermo Fisher) was added to cells, followed by incubation overnight. At 48 h posttransfection, living cells were imaged using a TCS SP8 confocal laser scanning microscope (Leica). LysoTracker Deep Red (Life Technologies) was diluted to 50 nM in DMEM containing 10% fetal bovine serum and used to stain living, transfected cells for 15 min prior to immediate imaging. Twelve-bit images with a 1,024 × 1,024 field size were acquired at 100× oil immersion magnification, and images were produced as averaged Z-stacks from three to four consecutive medial sections using Fiji (ImageJ). Images labeled as “3D” were produced as complete Z-stacks from all sections using Imaris (Bitplane).
Bafilomycin A1 or MG132 treatment of Envelope protein-producing cells.
293T cells were seeded in 12-well plates at 200,000 cells per well. The following day, the cells were transfected with pCD-Env plasmid (1.3 μg) or pCD-Env plasmid and pCMV6-IFITM3 (0.20 μg) using Mirus TransIT-293 transfection reagent. At 48 h posttransfection, the cells were treated with 1 or 5 μM bafilomycin A1 (Sigma) or MG132 (Sigma) for 8 h. Subsequently, the cells were resuspended in 100 μl of 1× radioimmunoprecipitation assay buffer (Thermo Fisher) containing HALT protease inhibitor (Thermo Fisher) and sonicated. Lysates were mixed with equal volume of 1× NuPAGE LDS sample buffer with 1× NuPAGE sample reducing agent and processed for Western blot analysis as described above.
Cell-cell fusion assay.
Cell-cell fusion assays were performed using the double split protein system, as previously described (50), with some modifications. 293T cells were seeded in six-well plates at 300,000 cells per well and transfected with Mirus TransIT-293. Cells regarded as producer cells, expressing ecotropic glycoprotein with or without IFITM3, were transfected with pCD-Env (1.2 μg), pCMV-IFITM3 (0.84 μg or 3-fold dilutions thereof), and plasmid expressing DSP1-7 (0.2 μg). Cells regarded as targets were transfected with plasmid expressing DSP8-11 (0.2 μg) and pcDNA-mCAT1 (2.4 μg). At about 24 h posttransfection, producer cells were detached, and 50 μl of the cell suspension was transferred to a 96-well plate in triplicate. At 48 h posttransfection, target cells were incubated with 60 μM Enduren (Promega) and detached, and 50 μl of the cell suspension was mixed with producer cells, resulting in a 30 μM final concentration of Enduren. The luciferase activity was measured 2 h after mixing producer and target cells.
Virus challenge of IFITM3-positive cells.
Empty pQCXIP (Empty) or pQCXIP-FLAG-IFITM3 were transfected into 293T cells with Mirus TransIT-LT1. Stably expressing cells were created following selection with puromycin for more than 2 weeks. Cells were challenged with MLV pseudotyped with xenotropic Env produced in the presence or absence of IFITM3 and infection was quantified by measuring firefly luciferase activity at approximately 48 h postinfection (as described above).
Statistical analysis.
The Student t test or a one-way analysis of variance (ANOVA) was used for determination of statistically significant differences. The specific test used is indicated in each figure legend. In most cases, only comparisons yielding a statistically significant difference are called out in the figure (*, P < 0.05; **, P < 0.0005).
Z-stack of Env-EGFP and IFITM3-mCherry in transfected cells. 293T cells were transfected with ecotropic Env-GFP (0.1 μg) alone or ecotropic Env-GFP and IFITM3-mCherry (0.02 μg). Cell Bright-Lyso reagent was added to cells approximately 16 h prior to imaging to label cells with LAMP1-RFP. Living cells were imaged at 48 h posttransfection. Download VIDEO S1, AVI file, 2.8 MB (2.9MB, avi) .
This is a work of the U.S. Government and is not subject to copyright protection in the United States. Foreign copyrights may apply.
ACKNOWLEDGMENTS
We thank the Optical Microscopy and Image Analysis Lab at the National Cancer Institute for their assistance in image acquisition, Demetria Harvin and Peter Lai for technical assistance, and Eric O. Freed for providing critical feedback.
Footnotes
This article is a direct contribution from Alan Rein, a Fellow of the American Academy of Microbiology, who arranged for and secured reviews by Amit Sharma, Ohio State University, and Welkin Johnson, Boston College.
Citation Ahi YS, Yimer D, Shi G, Majdoul S, Rahman K, Rein A, Compton AA. 2020. IFITM3 reduces retroviral envelope abundance and function and is counteracted by glycoGag. mBio 11:e03088-19. https://doi.org/10.1128/mBio.03088-19.
REFERENCES
- 1.Beitari S, Wang Y, Liu S-L, Liang C. 2019. HIV-1 Envelope glycoprotein at the interface of host restriction and virus evasion. Viruses 11:311–316. doi: 10.3390/v11040311. [DOI] [PMC free article] [PubMed] [Google Scholar]
- 2.Compton AA, Schwartz O. 2017. They might be giants: does syncytium formation sink or spread HIV infection? PLoS Pathog 13:e1006099. doi: 10.1371/journal.ppat.1006099. [DOI] [PMC free article] [PubMed] [Google Scholar]
- 3.Braun E, Hotter D, Koepke L, Zech F, Gross R, Sparrer KMJ, Müller JA, Pfaller CK, Heusinger E, Wombacher R, Sutter K, Dittmer U, Winkler M, Simmons G, Jakobsen MR, Conzelmann K-K, Pöhlmann S, Münch J, Fackler OT, Kirchhoff F, Sauter D. 2019. Guanylate-binding proteins 2 and 5 exert broad antiviral activity by inhibiting furin-mediated processing of viral Envelope proteins. Cell Rep 27:2092–2104.e2010. doi: 10.1016/j.celrep.2019.04.063. [DOI] [PubMed] [Google Scholar]
- 4.Rosa A, Chande A, Ziglio S, De Sanctis V, Bertorelli R, Goh SL, McCauley SM, Nowosielska A, Antonarakis SE, Luban J, Santoni FA, Pizzato M. 2015. HIV-1 Nef promotes infection by excluding SERINC5 from virion incorporation. Nature 526:212–217. doi: 10.1038/nature15399. [DOI] [PMC free article] [PubMed] [Google Scholar]
- 5.Usami Y, Wu Y, Göttlinger HG. 2015. SERINC3 and SERINC5 restrict HIV-1 infectivity and are counteracted by Nef. Nature 526:218–223. doi: 10.1038/nature15400. [DOI] [PMC free article] [PubMed] [Google Scholar]
- 6.Goffinet C. 2016. Cellular antiviral factors that target particle infectivity of HIV-1. Curr HIV Res 14:211–216. doi: 10.2174/1570162x14666151216145521. [DOI] [PMC free article] [PubMed] [Google Scholar]
- 7.Shi G, Schwartz O, Compton AA. 2017. More than meets the I: the diverse antiviral and cellular functions of interferon-induced transmembrane proteins. Retrovirology 14:11. doi: 10.1186/s12977-017-0377-y. [DOI] [PMC free article] [PubMed] [Google Scholar]
- 8.Sood C, Marin M, Chande A, Pizzato M, Melikyan GB. 2017. SERINC5 protein inhibits HIV-1 fusion pore formation by promoting functional inactivation of envelope glycoproteins. J Biol Chem 292:6014–6026. doi: 10.1074/jbc.M117.777714. [DOI] [PMC free article] [PubMed] [Google Scholar]
- 9.Tada T, Zhang Y, Koyama T, Tobiume M, Tsunetsugu-Yokota Y, Yamaoka S, Fujita H, Tokunaga K. 2015. MARCH8 inhibits HIV-1 infection by reducing virion incorporation of envelope glycoproteins. Nat Med 21:1502–1507. doi: 10.1038/nm.3956. [DOI] [PubMed] [Google Scholar]
- 10.Wei W, Yu XF. 2016. HIV-1 Envelope under attack. Trends Microbiol 24:164–166. doi: 10.1016/j.tim.2016.01.004. [DOI] [PubMed] [Google Scholar]
- 11.Perreira JM, Chin CR, Feeley EM, Brass AL. 2013. IFITMs restrict the replication of multiple pathogenic viruses. J Mol Biol 425:4937–4955. doi: 10.1016/j.jmb.2013.09.024. [DOI] [PMC free article] [PubMed] [Google Scholar]
- 12.Compton AA, Bruel T, Porrot F, Mallet A, Sachse M, Euvrard M, Liang C, Casartelli N, Schwartz O. 2014. IFITM proteins incorporated into HIV-1 virions impair viral fusion and spread. Cell Host Microbe 16:736–747. doi: 10.1016/j.chom.2014.11.001. [DOI] [PMC free article] [PubMed] [Google Scholar]
- 13.Tartour K, Appourchaux R, Gaillard J, Nguyen X-N, Durand S, Turpin J, Beaumont E, Roch E, Berger G, Mahieux R, Brand D, Roingeard P, Cimarelli A. 2014. IFITM proteins are incorporated onto HIV-1 virion particles and negatively imprint their infectivity. Retrovirology 11:103. doi: 10.1186/s12977-014-0103-y. [DOI] [PMC free article] [PubMed] [Google Scholar]
- 14.Wang Y, Pan Q, Ding S, Wang Z, Yu J, Finzi A, Liu S-L, Liang C. 2017. The V3 loop of HIV-1 Env determines viral susceptibility to IFITM3 impairment of viral infectivity. J Virol 91:e02441-16. doi: 10.1128/JVI.02441-16. [DOI] [PMC free article] [PubMed] [Google Scholar]
- 15.Yu J, Li M, Wilkins J, Ding S, Swartz TH, Esposito AM, Zheng Y-M, Freed EO, Liang C, Chen BK, Liu S-L. 2015. IFITM proteins restrict HIV-1 infection by antagonizing the Envelope glycoprotein. Cell Rep 13:145–113. doi: 10.1016/j.celrep.2015.08.055. [DOI] [PMC free article] [PubMed] [Google Scholar]
- 16.Jakobsdottir GM, Iliopoulou M, Nolan R, Alvarez L, Compton AA, Padilla-Parra S. 2017. On the whereabouts of HIV-1 cellular entry and its fusion ports. Trends Mol Med 23:932–913. doi: 10.1016/j.molmed.2017.08.005. [DOI] [PubMed] [Google Scholar]
- 17.Compton AA, Roy N, Porrot F, Billet A, Casartelli N, Yount JS, Liang C, Schwartz O. 2016. Natural mutations in IFITM3 modulate posttranslational regulation and toggle antiviral specificity. EMBO Rep 17:1657–1671. doi: 10.15252/embr.201642771. [DOI] [PMC free article] [PubMed] [Google Scholar]
- 18.Suddala KC, Lee CC, Meraner P, Marin M, Markosyan RM, Desai TM, Cohen FS, Brass AL, Melikyan GB. 2019. Interferon-induced transmembrane protein 3 blocks fusion of sensitive but not resistant viruses by partitioning into virus-carrying endosomes. PLoS Pathog 15:e1007532. doi: 10.1371/journal.ppat.1007532. [DOI] [PMC free article] [PubMed] [Google Scholar]
- 19.Tartour K, Nguyen X-N, Appourchaux R, Assil S, Barateau V, Bloyet L-M, Burlaud Gaillard J, Confort M-P, Escudero-Perez B, Gruffat H, Hong SS, Moroso M, Reynard O, Reynard S, Decembre E, Ftaich N, Rossi A, Wu N, Arnaud F, Baize S, Dreux M, Gerlier D, Paranhos-Baccala G, Volchkov V, Roingeard P, Cimarelli A. 2017. Interference with the production of infectious viral particles and bimodal inhibition of replication are broadly conserved antiviral properties of IFITMs. PLoS Pathog 13:e1006610–e1006630. doi: 10.1371/journal.ppat.1006610. [DOI] [PMC free article] [PubMed] [Google Scholar]
- 20.Ahi YS, Zhang S, Thappeta Y, Denman A, Feizpour A, Gummuluru S, Reinhard B, Muriaux D, Fivash MJ, Rein A. 2016. Functional interplay between murine leukemia virus Glycogag, Serinc5, and surface glycoprotein governs virus entry, with opposite effects on gammaretroviral and ebolavirus glycoproteins. mBio 7:e01985-16. [DOI] [PMC free article] [PubMed] [Google Scholar]
- 21.Rein A, Mirro J, Haynes JG, Ernst SM, Nagashima K. 1994. Function of the cytoplasmic domain of a retroviral transmembrane protein: p15E-p2E cleavage activates the membrane fusion capability of the murine leukemia virus Env protein. J Virol 68:1773–1781. [DOI] [PMC free article] [PubMed] [Google Scholar]
- 22.Ragheb JA, Anderson WF. 1994. pH-independent murine leukemia virus ecotropic envelope-mediated cell fusion: implications for the role of the R peptide and p12E TM in viral entry. J Virol 68:3220–3231. [DOI] [PMC free article] [PubMed] [Google Scholar]
- 23.Baglio SR, van Eijndhoven MAJ, Koppers-Lalic D, Berenguer J, Lougheed SM, Gibbs S, Léveillé N, Rinkel R, Hopmans ES, Swaminathan S, Verkuijlen SA, Scheffer GL, van Kuppeveld FJ, de Gruijl TD, Bultink IE, Jordanova ES, Hackenberg M, Piersma SR, Knol JC, Voskuyl AE, Wurdinger T, Jiménez CR, Middeldorp JM, Pegtel DM. 2016. Sensing of latent EBV infection through exosomal transfer of 5′pppRNA. Proc Natl Acad Sci U S A 113: E587–96. doi: 10.1073/pnas.1518130113. [DOI] [PMC free article] [PubMed] [Google Scholar]
- 24.Zhu X, He Z, Yuan J, Wen W, Huang X, Hu Y, Lin C, Pan J, Li R, Deng H, Liao S, Zhou R, Wu J, Li J, Li M. 2015. IFITM3‐containing exosome as a novel mediator for antiviral response in dengue virus infection. Cell Microbiol 17:105–118. doi: 10.1111/cmi.12339. [DOI] [PMC free article] [PubMed] [Google Scholar]
- 25.Sharma A, McLaughlin RN, Basom RS, Kikawa C, OhAinle M, Yount JS, Emerman M, Overbaugh J. 2019. Macaque interferon-induced transmembrane proteins limit replication of SHIV strains in an Envelope-dependent manner. PLoS Pathog 15:e1007925. doi: 10.1371/journal.ppat.1007925. [DOI] [PMC free article] [PubMed] [Google Scholar]
- 26.Erlwein O, Buchholz CJ, Schnierle BS. 2003. The proline-rich region of the ecotropic Moloney murine leukaemia virus envelope protein tolerates the insertion of the green fluorescent protein and allows the generation of replication-competent virus. J Gen Virol 84:369–373. doi: 10.1099/vir.0.18761-0. [DOI] [PubMed] [Google Scholar]
- 27.Spence JS, He R, Hoffmann H-H, Das T, Thinon E, Rice CM, Peng T, Chandran K, Hang HC. 2018. IFITM3 directly engages and shuttles incoming virus particles to lysosomes. Nat Chem Biol 1:1–15. doi: 10.1038/s41589-018-0213-2. [DOI] [PMC free article] [PubMed] [Google Scholar]
- 28.Feeley EM, Sims JS, John SP, Chin CR, Pertel T, Chen L-M, Gaiha GD, Ryan BJ, Donis RO, Elledge SJ, Brass AL. 2011. IFITM3 inhibits influenza A virus infection by preventing cytosolic entry. PLoS Pathog 7:e1002337. doi: 10.1371/journal.ppat.1002337. [DOI] [PMC free article] [PubMed] [Google Scholar]
- 29.Chande A, Cuccurullo EC, Rosa A, Ziglio S, Carpenter S, Pizzato M. 2016. S2 from equine infectious anemia virus is an infectivity factor which counteracts the retroviral inhibitors SERINC5 and SERINC3. Proc Natl Acad Sci U S A 113:13197–13202. doi: 10.1073/pnas.1612044113. [DOI] [PMC free article] [PubMed] [Google Scholar]
- 30.Compton AA, Malik HS, Emerman M. 2013. Host gene evolution traces the evolutionary history of ancient primate lentiviruses. Philos Trans R Soc Lond B Biol Sci 368:20120496–20120496. doi: 10.1098/rstb.2012.0496. [DOI] [PMC free article] [PubMed] [Google Scholar]
- 31.Malim MH, Emerman M. 2008. HIV-1 accessory proteins: ensuring viral survival in a hostile environment. Cell Host Microbe 3:388–398. doi: 10.1016/j.chom.2008.04.008. [DOI] [PubMed] [Google Scholar]
- 32.Daugherty MD, Malik HS. 2012. Rules of engagement: molecular insights from host-virus arms races. Annu Rev Genet 46:677–700. doi: 10.1146/annurev-genet-110711-155522. [DOI] [PubMed] [Google Scholar]
- 33.McCarthy KR, Johnson WE. 2014. Plastic proteins and monkey blocks: how lentiviruses evolved to replicate in the presence of primate restriction factors. PLoS Pathog 10:e1004017. doi: 10.1371/journal.ppat.1004017. [DOI] [PMC free article] [PubMed] [Google Scholar]
- 34.Kozak CA. 2013. Evolution of different antiviral strategies in wild mouse populations exposed to different gammaretroviruses. Curr Opin Virol 3:657–663. doi: 10.1016/j.coviro.2013.08.001. [DOI] [PMC free article] [PubMed] [Google Scholar]
- 35.Stoye JP. 2012. Studies of endogenous retroviruses reveal a continuing evolutionary saga. Nat Rev Microbiol 10:395–406. doi: 10.1038/nrmicro2783. [DOI] [PubMed] [Google Scholar]
- 36.Wrensch F, Hoffmann M, Gärtner S, Nehlmeier I, Winkler M, Pöhlmann S. 2017. Virion background and efficiency of virion incorporation determine susceptibility of simian immunodeficiency virus Env-driven viral entry to inhibition by IFITM proteins. J Virol 91:e01488-16. doi: 10.1128/JVI.01488-16. [DOI] [PMC free article] [PubMed] [Google Scholar]
- 37.Wolf D, Goff SP. 2008. Host restriction factors blocking retroviral replication. Annu Rev Genet 42:143–163. doi: 10.1146/annurev.genet.42.110807.091704. [DOI] [PMC free article] [PubMed] [Google Scholar]
- 38.Buchrieser J, Degrelle SA, Couderc T, Nevers Q, Disson O, Manet C, Donahue DA, Porrot F, Hillion K-H, Perthame E, Arroyo MV, Souquere S, Ruigrok K, Dupressoir A, Heidmann T, Montagutelli X, Fournier T, Lecuit M, Schwartz O. 2019. IFITM proteins inhibit placental syncytiotrophoblast formation and promote fetal demise. Science 365:176–180. doi: 10.1126/science.aaw7733. [DOI] [PubMed] [Google Scholar]
- 39.Zani A, Zhang L, McMichael TM, Kenney AD, Chemudupati M, Kwiek JJ, Liu S-L, Yount JS. 2019. Interferon-induced transmembrane proteins inhibit cell fusion mediated by trophoblast syncytins. J Biol Chem pii:jbc.AC119.010611. doi: 10.1074/jbc.AC119.010611. [DOI] [PMC free article] [PubMed] [Google Scholar]
- 40.Li S, Ahmad I, Shi J, Wang B, Yu C, Zhang L, Zheng Y-H. 2019. Murine leukemia virus glycosylated Gag reduces murine SERINC5 protein expression at steady-state levels via the endosome/lysosome pathway to counteract SERINC5 antiretroviral activity. J Virol 93:35776–35715. doi: 10.1128/JVI.01651-18. [DOI] [PMC free article] [PubMed] [Google Scholar]
- 41.Shi J, Xiong R, Zhou T, Su P, Zhang X, Qiu X, Li H, Li S, Yu C, Wang B, Ding C, Smithgall TE, Zheng Y-H. 2018. HIV-1 Nef antagonizes SERINC5 restriction by downregulation of SERINC5 via the endosome/lysosome system. J Virol 92:e00196-18. doi: 10.1128/JVI.00196-18. [DOI] [PMC free article] [PubMed] [Google Scholar]
- 42.Usami Y, Popov S, Göttlinger HG. 2014. The Nef-like effect of murine leukemia virus glycosylated Gag on HIV-1 infectivity is mediated by its cytoplasmic domain and depends on the AP-2 adaptor complex. J Virol 88:3443–3454. doi: 10.1128/JVI.01933-13. [DOI] [PMC free article] [PubMed] [Google Scholar]
- 43.Shi G, Ozog S, Torbett BE, Compton AA. 2018. mTOR inhibitors lower an intrinsic barrier to virus infection mediated by IFITM3. Proc Natl Acad Sci U S A 115:E10069–E10078. doi: 10.1073/pnas.1811892115. [DOI] [PMC free article] [PubMed] [Google Scholar]
- 44.Albritton LM, Tseng L, Scadden D, Cunningham JM. 1989. A putative murine ecotropic retrovirus receptor gene encodes a multiple membrane-spanning protein and confers susceptibility to virus infection. Cell 57:659–666. doi: 10.1016/0092-8674(89)90134-7. [DOI] [PubMed] [Google Scholar]
- 45.Lange UC, Adams DJ, Lee C, Barton S, Schneider R, Bradley A, Surani MA. 2008. Normal germ line establishment in mice carrying a deletion of the IFITM/fragilis gene family cluster. Mol Cell Biol 28:4688–4696. doi: 10.1128/MCB.00272-08. [DOI] [PMC free article] [PubMed] [Google Scholar]
- 46.Gorman MJ, Poddar S, Farzan M, Diamond MS. 2016. The interferon-stimulated gene ifitm3 restricts West Nile virus infection and pathogenesis. J Virol 90:8212–8225. doi: 10.1128/JVI.00581-16. [DOI] [PMC free article] [PubMed] [Google Scholar]
- 47.Rulli SJ, Muriaux D, Nagashima K, Mirro J, Oshima M, Baumann JG, Rein A. 2006. Rein A: mutant murine leukemia virus Gag proteins lacking proline at the N terminus of the capsid domain block infectivity in virions containing wild-type Gag. Virology 347:364–371. doi: 10.1016/j.virol.2005.12.012. [DOI] [PubMed] [Google Scholar]
- 48.Wilson C, Reitz MS, Okayama H, Eiden MV. 1989. Formation of infectious hybrid virions with gibbon ape leukemia virus and human T-cell leukemia virus retroviral envelope glycoproteins and the gag and pol proteins of Moloney murine leukemia virus. J Virol 63:2374–2378. [DOI] [PMC free article] [PubMed] [Google Scholar]
- 49.Wool-Lewis RJ, Bates P. 1998. Characterization of Ebola virus entry by using pseudotyped viruses: identification of receptor-deficient cell lines. J Virol 72:3155–3160. [DOI] [PMC free article] [PubMed] [Google Scholar]
- 50.Kondo N, Miyauchi K, Meng F, Iwamoto A, Matsuda Z. 2010. Conformational changes of the HIV-1 envelope protein during membrane fusion are inhibited by the replacement of its membrane-spanning domain. J Biol Chem 285:14681–14688. doi: 10.1074/jbc.M109.067090. [DOI] [PMC free article] [PubMed] [Google Scholar]
- 51.Marquardt H, Gilden RV, Oroszlan S. 1977. Envelope glycoproteins of Rauscher murine leukemia virus: isolation and chemical characterization. Biochemistry 16:710–717. doi: 10.1021/bi00623a024. [DOI] [PubMed] [Google Scholar]
Associated Data
This section collects any data citations, data availability statements, or supplementary materials included in this article.
Supplementary Materials
Restriction of Moloney MLV infectivity by IFITM3 results from defect in virus entry. (A) 293T were cotransfected with Moloney MLV (2.5 μg), pBabeLuc (0.6 μg), and empty pCMV6 or pCMV6-IFITM3 (0.27, 0.81, or 2.4 μg) and virus-containing supernatants were used to infect HT1080/mCAT1 cells. Infection was measured by luciferase assay at 48 h postinfection. Virus-containing supernatants were filtered and ultracentrifuged through 20% sucrose, and SDS-PAGE and Western blotting were performed. (B) Virus was produced in 293T via transient transfection of Moloney MLV without glycoGag (2.5 μg), a plasmid encoding Gag-Cre (0.5 μg), and empty pCMV6 or pCMV6-IFITM3 (0.27 or 0.81 μg). Virus-containing supernatants were harvested at 48 and 72 h posttransfection, combined, and filtered through 0.45-μm-pore size filters. The entry capability of this virus was measured as described in Materials and Methods. (C) 293T cells serving as donor cells were transfected with R+ or R– ecotropic Env (1.2 μg), pCMV-IFITM3 (0.03, 0.09, 0.27, or 0.81 μg) and DSP1-7 (0.2 μg). 293T cells serving as target cells were transfected DSP8-11 (0.2 μg) and pcDNA-mCAT1 (2.4 μg). About 24 h posttransfection, producer cells were detached, and 50 μl of the cell suspension was transferred to a 96-well plate in triplicate. At 48 h posttransfection, target cells were incubated with 60 μM Enduren (Promega) and detached, and 50 μl of the cell suspension was mixed with producer cells resulting in a 30 μM final concentration of Enduren. Luciferase activity was measured 2 h after mixing producer and target cells. (D) Immunoblotting of gp70 and gp85 from Fig. 1C and D was quantified using LiCor Odyssey and ImageStudioLite. Data from “HI ENV” and “LO ENV” conditions from three separate blots are presented as gp70/gp85 ratio, with the ratio of virus produced with empty vector set to 100. (E) 293T cells were transfected with pCMV6-IFITM3 (0.27 μg) alone or pCMV6-IFITM3 and env-deficient MLV (2.5 μg). Supernatants were harvested from transfected cells at 48 h posttransfection, filtered, ultracentrifuged through 20% sucrose, and subjected to SDS-PAGE and Western blotting. (F) Virus produced with xenotropic Env (0.5 μg), empty pCMV6 or pCMV6-IFITM3 (0.27 μg) was used to challenge 293T cells stably expressing empty pQCXIP or pQXCIP-IFITM3, and the luciferase activity was measured at 48 h postinfection. 293T-Empty and 293T-FLAG-IFITM3 cell lines were stained with anti-FLAG, and the expression levels were assessed by flow cytometry. Data represent the average of three independent experiments; for each experiment, infectivities were measured in triplicate and averaged. Statistical analysis in panels A, B, and C was performed using one-way ANOVA. Statistical analysis in panels D and F was performed using the Student t test. *, P < 0.05; **, P < 0.0005. ns, not statistically significant. Download FIG S1, PDF file, 1.6 MB (1.7MB, pdf) .
This is a work of the U.S. Government and is not subject to copyright protection in the United States. Foreign copyrights may apply.
Loss of Env from IFITM3-expressing cells results from lysosomal degradation and not proteasomal degradation. (A) 293T cells were transfected with ecotropic Env (1.3 μg) alone, ecotropic Env and pCMV6-IFITM3 (0.20 μg), or nontransfected (NT). Cells were lysed at 48 h posttransfection. Under the conditions indicated, MG132 (1 or 5 μM) was added for a period of 8 h prior to lysing cells. SDS-PAGE and western blotting was performed. (B) 293T cells were transfected with ecotropic Env-EGFP (0.1 μg) alone or ecotropic Env-EGFP and pCMV6-IFITM3 (0.02 μg). LysoTracker Deep Red reagent was added to living cells at 50 nM 15 min prior to imaging. Living cells were imaged at 48 h posttransfection. Scale bar, 10 μm. Western blot analysis and fluorescence images are representative of three independent experiments. Download FIG S2, PDF file, 2.7 MB (2.8MB, pdf) .
This is a work of the U.S. Government and is not subject to copyright protection in the United States. Foreign copyrights may apply.
Endogenous IFITM3 reduces Env protein levels. (A) HeLa or HeLa IFITM3 KO were transfected with Gaussia luciferase, xenotropic Env (1.2 or 0.5 μg), or xenotropic Env and pCMV6-IFITM3 (0.25 μg). Transfected cells were lysed at 48 h posttransfection and subjected to SDS-PAGE and Western blotting. (B) Gaussia luciferase measurements were made in transfected HeLa and HeLa IFITM3 KO cells at 48 h posttransfection. (C) MEF WT and MEF IfitmDel were lysed and subjected to SDS-PAGE and Western blotting. (D) MEF WT or MEF IfitmDel were transfected with pcDNA-EGFP (2.5 μg) or pCD-Env-EGFP (2.5 μg) and GFP+ cells were quantified by flow cytometry at 24 hours posttransfection and analyzed according to %GFP+ cells and mean fluorescence intensity (MFI) of GFP+ cells. Western blot analysis and Gaussia luciferase assay data in transfected HeLa cells are representative of three independent experiments. Flow cytometry data tracking EGFP and Env-EGFP levels in transfected MEF represent the averages of three independent experiments. Statistical analysis in panels B and D was performed with the Student t test. *, P < 0.05. Download FIG S3, PDF file, 1.0 MB (1MB, pdf) .
This is a work of the U.S. Government and is not subject to copyright protection in the United States. Foreign copyrights may apply.
MLV glycoGag overcomes IFITM3-mediated restriction in a viral glycoprotein-dependent manner. (A) Cell lysates from Fig. 6A were migrated by SDS-PAGE, and Western blotting was performed with anti-SERINC5. Ectopic SERINC5 produced from the 0.093-μg amount of pBJ-SERINC5 used in Fig. 6A could not be detected above levels of endogenous SERINC5. Lysates from cells transfected with 2.0 μg of pBJ-SERINC5 are provided for comparison. (B) 293T cells were cotransfected with env-deficient MLV encoding or not encoding glycoGag (2.5 μg), pBabeLuc (0.6 μg), ecotropic Env (0.5 μg), and empty pCMV6, pCMV6-IFITM3 (0.83 μg), or pBJ5-SERINC5 (0.093 μg) and virus-containing supernatants were used to infect HT1080/mCAT1 cells. Infection was measured by luciferase assay at 48 h postinfection. Data represent the averages of three independent experiments; for each experiment, infectivities were measured in triplicate and averaged. Transfected cells were lysed at 72 h posttransfection, and virus-containing supernatants from 48 and 72 h posttransfection were filtered, ultracentrifuged through 20% sucrose, and analyzed by SDS-PAGE and Western blotting. (C) Same as in panel B, except VSV-G (0.2 μg) was used instead. (D) 293T cells were transfected with the indicated amounts of pCMV-glycoGag-myc; the cells were lysed at 48 h posttransfection, and SDS-PAGE and Western blotting were performed. The amounts of pCMV-glycoGag-myc used in Fig. 6B (0.01 or 0.03 μg) are undetectable. Statistical analysis in panels B and C was performed with the Student t test. *, P < 0.05. Download FIG S4, PDF file, 0.2 MB (160KB, pdf) .
This is a work of the U.S. Government and is not subject to copyright protection in the United States. Foreign copyrights may apply.
Z-stack of Env-EGFP and IFITM3-mCherry in transfected cells. 293T cells were transfected with ecotropic Env-GFP (0.1 μg) alone or ecotropic Env-GFP and IFITM3-mCherry (0.02 μg). Cell Bright-Lyso reagent was added to cells approximately 16 h prior to imaging to label cells with LAMP1-RFP. Living cells were imaged at 48 h posttransfection. Download VIDEO S1, AVI file, 2.8 MB (2.9MB, avi) .
This is a work of the U.S. Government and is not subject to copyright protection in the United States. Foreign copyrights may apply.