Abstract
Objective
To update the causal estimates for the effects of adult body mass index (BMI), childhood BMI, and vitamin D status on multiple sclerosis (MS) risk.
Methods
We used 2-sample Mendelian randomization to determine causal estimates. Summary statistics for SNP associations with traits of interest were obtained from the relevant consortia. Primary analyses consisted of random-effects inverse-variance-weighted meta-analysis, followed by secondary sensitivity analyses.
Results
Genetically determined increased childhood BMI (ORMS 1.24, 95% CI 1.05–1.45, p = 0.011) and adult BMI (ORMS 1.14, 95% CI 1.01–1.30, p = 0.042) were associated with increased MS risk. The effect of genetically determined adult BMI on MS risk lessened after exclusion of 16 variants associated with childhood BMI (ORMS 1.11, 95% CI 0.97–1.28, p = 0.121). Correcting for effects of serum vitamin D in a multivariate analysis did not alter the direction or significance of these estimates. Each genetically determined unit increase in the natural-log-transformed vitamin D level was associated with a 43% decrease in the odds of MS (OR 0.57, 95% CI 0.41–0.81, p = 0.001).
Conclusions
We provide novel evidence that BMI before the age of 10 is an independent causal risk factor for MS and strengthen evidence for the causal role of vitamin D in the pathogenesis of MS.
Environmental risk factors for multiple sclerosis (MS) include low serum 25(OH)D3, obesity, Epstein-Barr virus infection, and smoking.1 However, associations from observational studies are subject to confounding and reverse causation. Mendelian randomization (MR) is a type of analysis that sets out to exploit the associations between genetic variants and traits to make causal inferences about exposure-outcome associations. In MR analyses, genetic variants associated with a trait are combined to form an instrumental variable which acts as a proxy for the trait; this can then be used to determine causal associations with outcomes of interest. Classical epidemiologic approaches to studying risk factors, such as cohort and case-control designs, are liable to biases because of confounding and reverse causation. Because genetic variants are randomly allocated and (generally) invariant throughout an individual's lifetime, MR provides a means of mitigating the biases inherent in classic epidemiologic studies. This makes it a useful tool in helping to disentangle true causal relationships from epiphenomena.
Previous MR studies have shown causal relationships between low vitamin D, adult body mass index (BMI), and MS risk2,3 with conflicting results for childhood BMI.4,5 Larger genome-wide association study (GWAS) are now available, permitting more precise estimations of effect sizes. Where associations of single nucleotide polymorphisms (SNPs) with both the risk factor of interest and a putative confounding variable are available,6,7 multivariate MR can control for confounding. We set out to refine the estimates of the impact of BMI and vitamin D status on MS risk using univariate and multivariate MR to control for confounding.
Methods
Genetic datasets
The Early Growth and Genetics consortium meta-analysis (35,668 Europeans) found 15 independent loci explaining 2% of the variance in childhood BMI.8 The The Genetic Investigation of ANthropometric Traits (GIANT) consortium meta-analysis (>700,000 Europeans) found 941 near-independent SNPs explaining 6% of the variance in BMI.9 The SUNLIGHT consortium GWAS (79,366 Europeans) discovered 6 loci associated with 25(OH)D3, explaining 38% of SNP-heritability.10 Data from an earlier GIANT meta-analysis were used when correcting for the effect of vitamin D-associated SNPs on BMI.11
The International Multiple Sclerosis Genetics Consortium discovery phase GWAS (14,802 MS, 26,703 controls) revealed 200 non-major histocompatibility complex (MHC) loci associated with MS explaining 19.2% of heritability.12 SNPs within the MHC are highly pleiotropic, and therefore, for reverse causation analyses, we used non-MHC SNPs with p <5 × 10⁻⁸, yielding 69 independent SNPs. No SNPs associated with vitamin D or childhood BMI were located within the MHC. For adult BMI, we excluded MHC SNPs in a secondary sensitivity analysis.
Statistical methods
SNPs were “clumped” using the PLINK clumping algorithm. For SNPs within a physical window of 10,000 kb or in significant linkage disequilibrium (r2 > 0.001), only the SNP with the smallest p value was retained for the analysis. Estimation of causal effects was performed using the random-effects inverse-variance weighted (IVW) approach followed by secondary sensitivity analyses.
MR-Egger regression was used to check for bias in the IVW estimate occurring because of unbalanced horizontal pleiotropy. Multivariate MR was carried out using the residual-based method.13 MR analyses were implemented in R v3.6.0 using the TwoSampleMR package.14 Linkage disequilibrium score regression was implemented using the ldsc software.15,16 Results are presented as ORs and 95% CIs.
Data availability
We would like to thank the relevant consortia for making their data available. MS GWAS data were taken from the MS Chip discovery summary statistics. International Multiple Sclerosis Genetics Consortium summary statistics are not publicly available and were obtained through request on the website: nettskjema.no/answer/imsgc-data-access.html. Adult BMI GWAS data from the GIANT consortium data were downloaded from the website: portals.broadinstitute.org/collaboration/giant/index.php/GIANT_consortium_data_files. Data on the childhood BMI trait have been contributed by the Early Growth and Genetics consortium and have been downloaded from egg-consortium.org. Vitamin D GWAS data were downloaded through the link provided in he study: drive.google.com/drive/folders/0BzYDtCo_doHJRFRKR0ltZHZWZjQ. We would like to thank the MR-Base collaboration for making their TwoSampleMR package publicly available.
Standard protocol approvals, registrations, and patient consents
This study did not involve any experiments on human subjects. All analyses were conducted using publicly available data sources.
There was no direct patient contact in this study, and therefore, there was no requirement for written informed consent.
Results
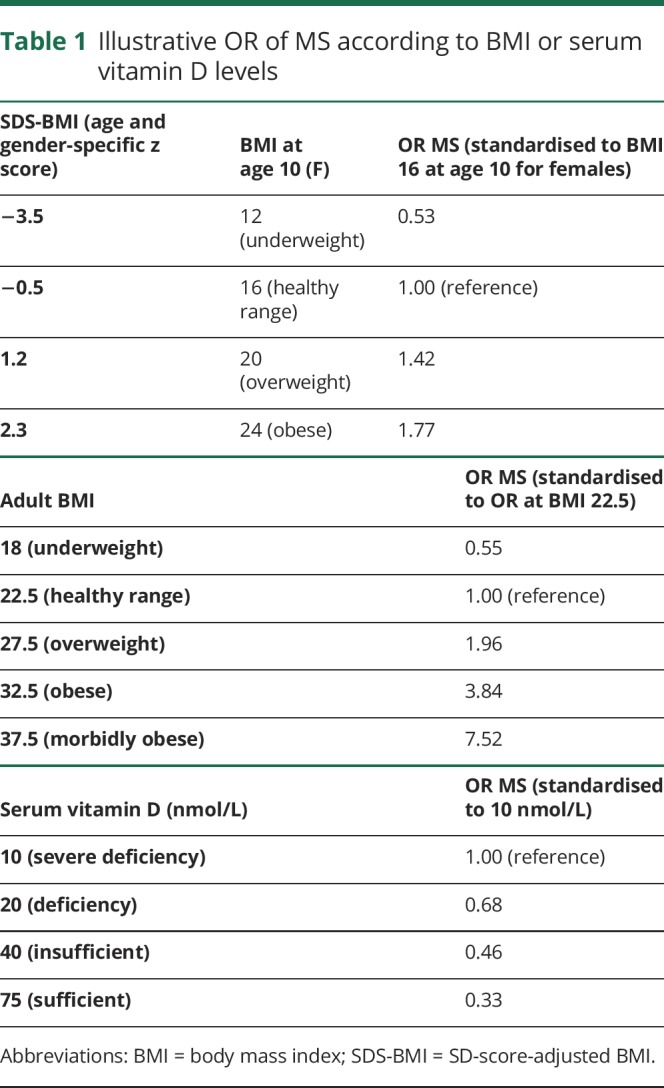
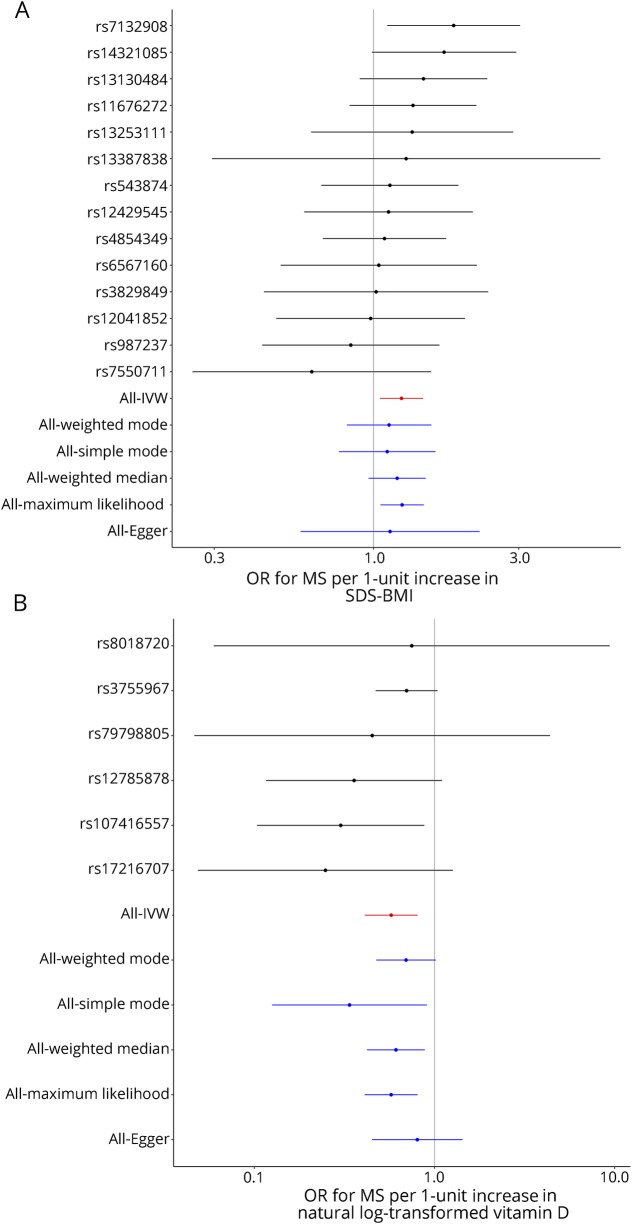
Each genetically determined unit increase in childhood SD-score-adjusted BMI (SDS-BMI) was associated with ORMS 1.24 (95% CI 1.05–1.45, p = 0.011, figure 1 and figure s1, links.lww.com/NXI/A175; table 1, tables s1, links.lww.com/NXI/A178, and s4, links.lww.com/NXI/A181). There was no evidence of significant unbalanced horizontal pleiotropy (MR-Egger intercept 0.006, p = 0.80). A leave-one-out analysis revealed that exclusion of rs7132908 yielded a nonsignificant overall effect of similar magnitude (ORMS 1.18, 95% CI 0.99–1.40, p = 0.060, figure s1). Genetically determined MS risk was not associated with childhood BMI (OR 1.02, 95% CI 0.98–1.06, p = 0.39).
Figure 1. (A) Relationship between genetically determined childhood BMI and MS: Forest plot shows individual SNP Wald ratios for effect of genetically-determined childhood BMI on MS risk.
(B) Relationship between genetically determined vitamin D and MS: Forest plot of individual SNP Wald ratios for the effect of genetically determined vitamin D on MS risk. IVW = inverse-variance weighted; SDS-BMI = SD-score-adjusted BMI.
Table 1.
Illustrative OR of MS according to BMI or serum vitamin D levels

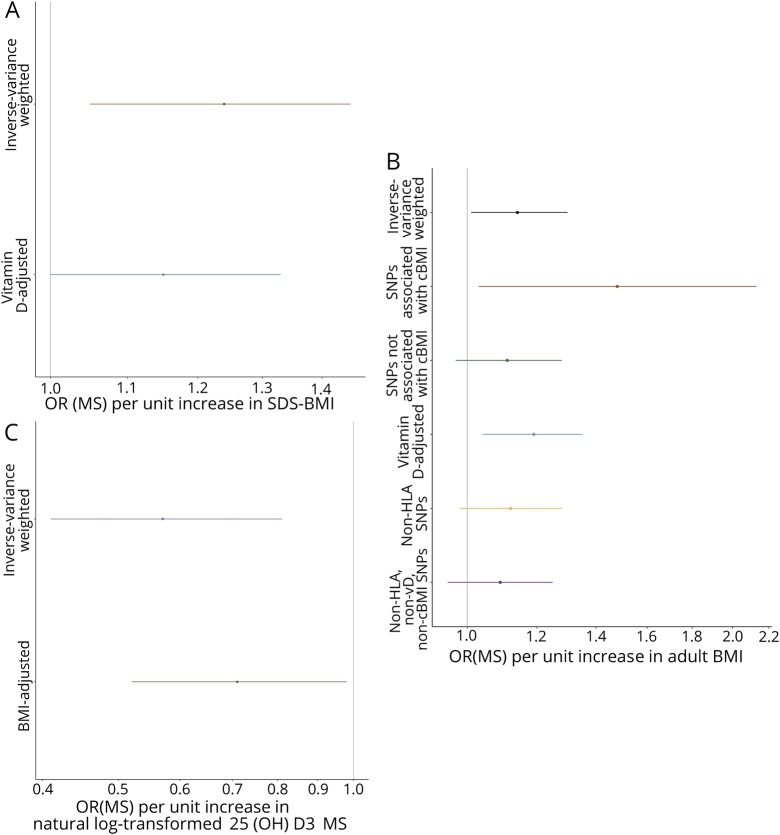
The genetic architecture of childhood BMI and vitamin D status is not strongly correlated (rg = −0.015, p = 0.79). The effect of childhood BMI on MS attenuated slightly but remained significant after conditioning on vitamin D (ORMS 1.15, 95% CI 1.00–1.33, p = 0.044, figure 2A). Because the genetic determinants of childhood and adult BMI are closely correlated (rg = 0.67, p = 5.4 × 10−109), we did not attempt to correct for the effects of these variants on adult BMI. All variants had concordant effects on adult and childhood BMI.
Figure 2. (A) Genetically determined childhood BMI, (B) genetically determined adult BMI, and (C) genetically determined serum vitamin D.
BMI = body mass index; cBMI = childhood BMI.
Each genetically determined unit increase in adult BMI was associated with ORMS 1.14 (95% CI 1.01–1.30, p = 0.042; figure s2, links.lww.com/NXI/A176; tables s2, links.lww.com/NXI/A179 and s5, links.lww.com/NXI/A182). There was no evidence of significant unbalanced horizontal pleiotropy (MR-Egger intercept 0.004, p = 0.081). Exclusion of the 16 variants associated with childhood BMI (n = 293, α = 0.05, p < 1.71 × 10−4 = 0.05/293) yielded a diminished causal estimate (ORMS 1.11, 95% CI 0.97–1.28, p = 0.121, figure 2B). Including only these 16 variants yielded an increased causal estimate (OR 1.48, 95% CI 1.03–2.13, p = 0.036, figure 2B).
The genetic architectures of adult BMI and vitamin D status are not strongly correlated (rg = −0.021, p = 0.47). Controlling for the effects on vitamin D status revealed a residual effect of BMI on MS risk (ORMS 1.19, 95% CI 1.04–1.35, p = 0.009, figure 2B). Excluding SNPs lying within the MHC gave a similar magnitude of effect but less precision (ORMS 1.12, 95% CI 0.98–1.28, p = 0.084, figure 2B). Genetically determined MS was not associated with BMI (ORBMI 1.01, 95% CI 1.00–1.02, p = 0.15).
Each genetically determined unit increase in log-transformed 25(OH)D3 was associated with ORMS 0.57 (CI 0.41–0.81, p = 0.001, figures 1B and 2C, figure s3, links.lww.com/NXI/A177; tables s3, links.lww.com/NXI/A180 and s6, links.lww.com/NXI/A183). There was no evidence of significant unbalanced horizontal pleiotropy (MR-Egger intercept −0.018, p = 0.24). Conditioning on adult BMI did not alter the direction or significance of the causal estimate (OR 0.71, 95% CI 0.52–0.98, p = 0.037). There was a significant effect of genetically determined MS risk on vitamin D status (OR 0.99, 95% CI 0.98–1.0, p 0.008), implying that MS may reduce vitamin D levels.
Discussion
We showed that genetically determined increased childhood BMI is a causal risk factor for MS independent of vitamin D. Importantly, there was no evidence of significant pleiotropy in this estimate. Although we cannot exclude that this causal effect is mediated through adult BMI, adult BMI is a function of early life BMI, and therefore, we would argue this is a case of vertical, rather than horizontal pleiotropy which does not invalidate the MR assumptions.17
In keeping with previous studies,18,19 we demonstrated that each genetically determined unit increase in adult BMI is associated with a 14% increase in the odds of MS, increasing to 19% on correcting for the effects on the serum 25(OH)-D3 status. Excluding variants associated with childhood BMI attenuates this, raising the possibility that this is mediated by the effects of BMI-associated SNPs on childhood BMI. Alternatively, variants associated with both phenotypes may be those with largest effect sizes, removal of which reduces power.
Finally, we demonstrated that each genetically determined unit increase in log-transformed serum 25(OH)D3 is associated with a 43% reduction in the odds of MS, which is consistent with previous studies.2,5,18 This persists after correction for confounding by effects on BMI. There is an additional small but significant reverse causation effect—MS predisposes to lower serum 25(OH)D3.
Our work is not without limitations. First, combining summary statistics from 2 separate populations (adults and children) may introduce bias from population stratification, which cannot be mitigated. Exclusively using GWAS derived from participants with European ancestry minimizes stratification because of ancestral differences. Second, estimates derived from MR assume linear relationships between risk factors and outcome, which may not be true in certain cases. For instance, it is conceivable that the effect of vitamin D on MS risk is a “threshold” effect, whereby vitamin D repletion above a cutoff is protective, but no further protective benefit above this point. Third, both BMI and vitamin D are dynamic phenotypes that likely influence MS risk in a time-varying manner. This is difficult to capture with MR because GWAS estimates assume static phenotypes. Fourth, MR effects are averaged at a population level; individual effects, such as sex and age-specific effects of risk factors are missed. Finally, MR depends on the assumption that the instrumental variable only affects the outcome by the exposure of interest. In our study, as an example, this is equivalent to saying that the vitamin D genetic instrument only influences MS by its effect on vitamin D levels. This assumption—that there is no horizontal pleiotropy—is now recognized to be the exception rather than the rule because most GWAS hits are in exonic regions of the genome that influence multiple traits. However, we tested for the presence of unbalanced horizontal pleiotropy in all of our analyses using the MR-Egger test and confirmed that it was not present to a degree that would bias the IVW estimate (our primary analysis).
Strengths of our study included the use of multivariate MR to control for confounding, the use of novel large GWAS datasets to improve power, and the alignment of our results with previous epidemiologic and MR studies in MS. Our study has implications for our understanding of the pathogenesis of MS and may have implications for prevention studies.
However, it is important to note that MS is a complex disease caused by interactions between genetic and environmental factors and the effect sizes we have demonstrated are small. Based on our analysis, the approximate numbers needed to treat, based on an incidence of 80 cases per 100,000 person-years, are very large (estimated number needed to treat per unit decrease in SDS-BMI: 5,214; number needed to treat per unit increase in log (vitamin D): 2,908). It must be noted that these numbers needed to treat are purely statistical constructs, and therefore, they should not be taken as clinically meaningful, rather they provide a further estimate of the magnitude of effect.
Although it is clear that targeting childhood obesity and low vitamin D on a population level are not effective prevention strategies for MS, it is likely that addressing these risk factors in early life among high-risk individuals (e.g., those with strong family history and therefore have a higher baseline incidence) will have a more pronounced effect. In this study, we enrich findings from previous cohort studies and provide evidence from MR that vitamin D and BMI—in adulthood and childhood—are independent causal risk factors for MS.
Glossary
- BMI
body mass index
- IVW
inverse-variance weighted
- MR
Mendelian randomization
- SDS-BMI
SD-score-adjusted BMI
Appendix. Authors


Study funding
This work was funded through a grant from the Barts Charity (grant ref MGU0365).
Disclosure
B.M. Jacobs, G. Giovannoni, A.J. Noyce, and R. Dobson have no relevant disclosures to declare. Go to Neurology.org/NN for full disclosures.
References
- 1.Olsson T, Barcellos LF, Alfredsson L. Interactions between genetic, lifestyle and environmental risk factors for multiple sclerosis. Nat Rev Neurol 2017;13:25–36. [DOI] [PubMed] [Google Scholar]
- 2.Rhead B, Bäärnhielm M, Gianfrancesco M, et al. Mendelian randomization shows a causal effect of low vitamin D on multiple sclerosis risk. Neurol Genet 2016;2:e97. [DOI] [PMC free article] [PubMed] [Google Scholar]
- 3.Mokry LE, Ross S, Timpson NJ, Sawcer S, Davey Smith G, Richards JB. Obesity and multiple sclerosis: a mendelian randomization study. PLoS Med 2016;13:e1002053. [DOI] [PMC free article] [PubMed] [Google Scholar]
- 4.Harroud A, Mitchell RE, Morris JA, Forgetta V. GP.01 Childhood obesity and multiple sclerosis susceptibility: a Mendelian randomization study. Can J Neurol Sci 2019;46:S6. [DOI] [PubMed] [Google Scholar]
- 5.Gianfrancesco MA, Stridh P, Rhead B, et al. Evidence for a causal relationship between low vitamin D, high BMI, and pediatric-onset MS. Neurology 2017;88:1623–1629. [DOI] [PMC free article] [PubMed] [Google Scholar]
- 6.Rafiq S, Jeppesen PB. Body mass index, vitamin D, and type 2 diabetes: a systematic review and meta-analysis. Nutrients 2018;10:E1182. [DOI] [PMC free article] [PubMed] [Google Scholar]
- 7.Vimaleswaran KS, Berry DJ, Lu C, et al. Causal relationship between obesity and vitamin D status: bi-directional Mendelian randomization analysis of multiple cohorts. PLoS Med 2013;10:e1001383. [DOI] [PMC free article] [PubMed] [Google Scholar]
- 8.Felix JF, Bradfield JP, Monnereau C, et al. Genome-wide association analysis identifies three new susceptibility loci for childhood body mass index. Hum Mol Genet 2016;25:389–403. [DOI] [PMC free article] [PubMed] [Google Scholar]
- 9.Yengo L, Sidorenko J, Kemper KE, et al. Meta-analysis of genome-wide association studies for height and body mass index in ∼700000 individuals of European ancestry. Hum Mol Genet 2018;27:3641–3649. [DOI] [PMC free article] [PubMed] [Google Scholar]
- 10.Jiang X, O'Reilly PF, Aschard H, et al. Genome-wide association study in 79,366 European-ancestry individuals informs the genetic architecture of 25-hydroxyvitamin D levels. Nat Commun 2018;9:260. [DOI] [PMC free article] [PubMed] [Google Scholar]
- 11.Locke AE, Kahali B, Berndt SI, et al. Genetic studies of body mass index yield new insights for obesity biology. Nature 2015;518:197–206. [DOI] [PMC free article] [PubMed] [Google Scholar]
- 12.Baranzini SE, Santaniello A, Shoostari P, Cotsapas C. Multiple sclerosis genomic map implicates peripheral immune cells and microglia in susceptibility. Science 2019; 365(6460). [DOI] [PMC free article] [PubMed] [Google Scholar]
- 13.Burgess S, Thompson SG. Multivariable Mendelian randomization: the use of pleiotropic genetic variants to estimate causal effects. Am J Epidemiol 2015;181:251–260. [DOI] [PMC free article] [PubMed] [Google Scholar]
- 14.Hemani G, Zheng J, Elsworth B, et al. The MR-base platform supports systematic causal inference across the human phenome. eLife 2018;7:e34408. [DOI] [PMC free article] [PubMed] [Google Scholar]
- 15.Bulik-Sullivan BK, Loh PR, Finucane HK, et al. LD Score regression distinguishes confounding from polygenicity in genome-wide association studies. Nat Genet 2015;47:291–295. [DOI] [PMC free article] [PubMed] [Google Scholar]
- 16.Bulik-Sullivan B, Finucane HK, Anttila V, et al. An atlas of genetic correlations across human diseases and traits. Nat Genet 2015;47:1236–1241. [DOI] [PMC free article] [PubMed] [Google Scholar]
- 17.Geserick M, Vogel M, Gausche R, et al. Acceleration of BMI in early childhood and risk of sustained obesity. N Engl J Med 2018;379:1303–1312. [DOI] [PubMed] [Google Scholar]
- 18.Mokry LE, Ross S, Ahmad OS, et al. Vitamin D and risk of multiple sclerosis: a mendelian randomization study. PLoS Med 2015;12:e1001866. [DOI] [PMC free article] [PubMed] [Google Scholar]
- 19.Gianfrancesco MA, Glymour MM, Walter S, et al. Causal effect of genetic variants associated with body mass index on multiple sclerosis susceptibility. Am J Epidemiol 2017;185:162–171. [DOI] [PMC free article] [PubMed] [Google Scholar]
Associated Data
This section collects any data citations, data availability statements, or supplementary materials included in this article.
Data Availability Statement
We would like to thank the relevant consortia for making their data available. MS GWAS data were taken from the MS Chip discovery summary statistics. International Multiple Sclerosis Genetics Consortium summary statistics are not publicly available and were obtained through request on the website: nettskjema.no/answer/imsgc-data-access.html. Adult BMI GWAS data from the GIANT consortium data were downloaded from the website: portals.broadinstitute.org/collaboration/giant/index.php/GIANT_consortium_data_files. Data on the childhood BMI trait have been contributed by the Early Growth and Genetics consortium and have been downloaded from egg-consortium.org. Vitamin D GWAS data were downloaded through the link provided in he study: drive.google.com/drive/folders/0BzYDtCo_doHJRFRKR0ltZHZWZjQ. We would like to thank the MR-Base collaboration for making their TwoSampleMR package publicly available.


