Abstract.
When monitoring a moist sample using mid-infrared spectroscopy, its thickness must be to avoid light absorption from the water. Therefore, we propose an ultrasonic-assisted mid-infrared spectroscopic imaging method that can generate a reflection plane at a depth of from the surface of the sample by creating an ultrasonic standing wave. A frequency of 10 MHz is required to obtain an optical path length of in biological samples. However, because biological samples generally have high compressibility, attenuation of ultrasonic waves at this frequency is significant. We use agar as a biological phantom and observe that a reflection plane is generated inside by ultrasonic standing waves using optical coherence tomography. It is found that when the sample is vibrated with an 800-kHz ultrasonic wave, a reflection plane is generated at a depth shallower than the theoretically predicted value. We believe that the reflection plane is generated by parametric standing waves, which are based on parametric effect. We detect the waveform distortion using an acoustic emission sensor and confirm the higher harmonics that generate the observed reflection plane using a fast Fourier transform.
Keywords: Fourier spectroscopy, noninvasive blood glucose sensor, ultrasonic standing wave, parametric effect, mid-infrared, glucose
1. Introduction
The prevention and early detection of diabetes have become increasingly important as the number of diabetic patients keeps rising.1 However, many individuals only have a limited number of opportunities for health checkups each year. In addition, it is important to identify and inform patients diagnosed with prediabetes who experience nondiabetic blood sugar spikes, during which their blood glucose levels rapidly increase after eating. These episodes can signal the onset of diabetes. Diabetic patients currently measure their blood glucose levels several times each day using needles to prick their fingers. Therefore, patients experience physical pain and stress daily, which take a heavy toll on them. Therefore, if a noninvasive blood glucose monitoring method could be realized, both diabetic patients and healthy people would be able to easily measure their own blood glucose levels without experiencing pain or having to pay for consumables. However, although many noninvasive blood glucose sensors have been attempted worldwide, none have been approved for medical use.
In a previous study,2 two methods were proposed for realizing a noninvasive blood glucose sensor. One used near-infrared spectroscopy,3–10 while the other used mid-infrared spectroscopy.11–13 When these methods were applied to measure the blood glucose levels in biological samples, there were two problems. The first problem was light absorption by the moisture inside the biological samples. The second problem was ambiguity in the optical path length.
With regard to light absorption by water, near-infrared spectroscopy exhibits a longer penetration depth in biological samples, so it is better suited for these measurements. However, because the glucose absorption peaks detected by near-infrared spectroscopy are overtones, the intensity of their absorption peaks is weak. Also, the water absorption wavelength range is to 1700 nm, so the absorption peak of the glucose at 1600 nm overlaps the shoulder of the water absorption. If a multicomponent sample is measured, as in biological situations, when the water content changes, the light absorption will also change, potentially altering the results. Therefore, the absorbance of water at 1450 nm decreases, and the absorbance of glucose, which should be constant, also appears to decrease because it overlaps the shoulder of the absorbance feature of water. As a result, it is difficult to measure blood glucose levels quantitatively. Mid-infrared spectroscopy can measure the absorbance of glucose quantitatively, because this method uses wavelengths from 5 to , and can obtain substance-specific spectra in the “fingerprint” region. Also, the intensity of the absorption is strong, because this region contains the fundamental vibrational modes of many substances. Fourier transform infrared spectroscopy (FTIR) is considered to be the primary method for obtaining mid-infrared spectra, and it is used for component analysis at many research facilities. However, when measuring a sample containing moisture, the sample thickness should be to avoid strong water absorption.
Because near-infrared spectroscopy exhibits deep penetration lengths in biological samples, it is difficult to estimate the optical path length of internally reflected light detected from within the sample. In a previous study, a method was proposed to solve this problem that used a glucose measurement device with a confocal optical system.14 However, this method could not measure the internally reflected light without a reflection plane at the focal plane. Therefore, it is difficult to quantify the optical path length for biological samples that do not have a defined reflection plane. Conventionally, the method of attenuated total reflection (ATR)15,16 has been used for measuring the mid-infrared absorbance of biological samples. This method can detect wavelengths in evanescent light reflecting from within of the surface of the sample. However, human skin is much thicker, containing cuticle (), epidermal (), and dermal () layers. Also, the cuticle itself does not contain any blood vessels. Therefore, ATR cannot measure the reflected light from blood, because the penetration depth is very shallow. The measurement targets are limited to the lining of the mouth, where blood vessels are present relatively close to the surface. Also, to obtain an optical path length of , it is necessary for the light to be reflected about 20 times at the boundary between the prism and the sample. Because this would require a very long prism, the mid-infrared light cannot propagate.
Here we propose an ultrasonic-assisted mid-infrared spectroscopy method that uses a bean-sized one-shot spectroscopic imager. The light is detected after internal reflection from an ultrasonic standing wave. We measured the glucose concentrations of urine sampled using this method. It was possible to generate a reflection plane at a depth of from the sample surface by creating a ultrasonic standing wave with a frequency of 10 MHz. Additionally, three glucose concentrations (50, 100, and ), corresponding to human blood glucose levels, were measured, and the glucose absorption peaks at 9.25 and could be detected.17 Then we applied the proposed method to a viscoelastic biological sample.
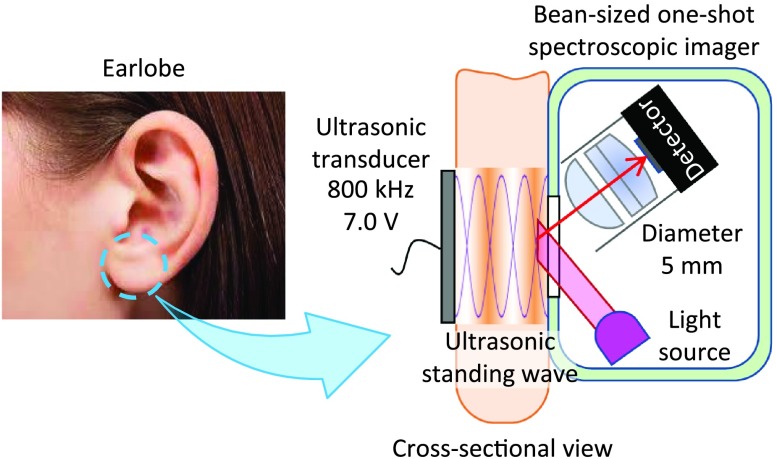
We used an earlobe as the measurement target for application of the proposed method to a biological sample. Because earlobes do not contain elements such as bone that could impede the propagation of ultrasonic waves, they are suitable for generating ultrasonic standing waves. Figure 1 shows a conceptual design of an earring-type noninvasive blood glucose sensor. An ultrasonic standing wave is generated from one side of an earlobe using an ultrasonic transducer, and the blood glucose concentration is measured from the opposite side using a bean-sized one-shot spectroscopic imager.
Fig. 1.
Conceptual design of the earring-type noninvasive blood glucose sensor.
Because the velocity of sound in a biological sample is almost equal to that in water, the frequency required for generating the reflection plane is also 10 MHz. However, because biological samples have high compressibility, unlike noncompressible fluids such as water, the attenuation of high-frequency ultrasonic waves is large.18,19 Therefore, if this method is applied to a viscoelastic biological sample, it is not possible to generate a reflection plane with ultrasonic standing waves at 10 MHz. However, we report the detection of a parametric standing wave, which can generate standing waves using the higher harmonic components of low-frequency ultrasonic waves. These can generate reflective surfaces at the same depth as the high-frequency ultrasonic waves.
In this experiment, we used agar as the biological phantom. We observed the reflection plane inside the biological phantom generated by ultrasonic standing waves using optical coherence tomography (OCT). When the ultrasonic transducer was set at a low frequency, the reflection plane was generated at a shallower depth than the theoretically predicted value. We believe that the reflection plane was generated by parametric standing waves. Because the parametric effect occurred in a biological phantom, which is a soft material, we were successful in obtaining a reflection plane generated by ultrasonic standing waves from higher harmonic components. We detected the waveform distortion using an acoustic emission (AE) sensor and confirmed the higher harmonic components that generated the reflection plane using a fast Fourier transform (FFT).
2. Principle of Ultrasonic-Assisted Method and Detection of an Internal Reflection Plane
If mid-infrared light is incident on a water-containing sample, such as biological tissue, the light is strongly absorbed by the water, and the internally reflected light cannot be detected. With the ultrasonic-assisted method, an ultrasonic transducer is installed on the opposite side of the sample from the light source, and ultrasonic waves vibrate the sample. Because ultrasonic waves are compression waves, they generate density differences while they propagate inside the sample, which in turn generates ultrasonic standing waves. Also, the density change that the propagated ultrasonic wave creates becomes homogeneous by the time the next ultrasonic wave propagates. This means that the next propagating ultrasonic wave is not reflected by the density change made by the previous ultrasonic wave. The propagated ultrasonic wave is reflected at the interface with the air. Then it becomes a standing wave on combination with newly propagated ultrasonic waves.
These ultrasonic standing waves generate a periodic refractive index, because a stationary density difference distribution is created in the sample. The incident light is then reflected from the nodes in the ultrasonic standing wave, because these are the regions in the sample with the largest refractive index gradient. The depth of a node () is given by Eq. (1), where the wavelength of the ultrasonic wave is , the sound velocity is , and the frequency is :
| (1) |
Because the depth of the node depends on the frequency, it is possible to generate reflection planes at arbitrary depths by changing the frequency of the ultrasonic wave.
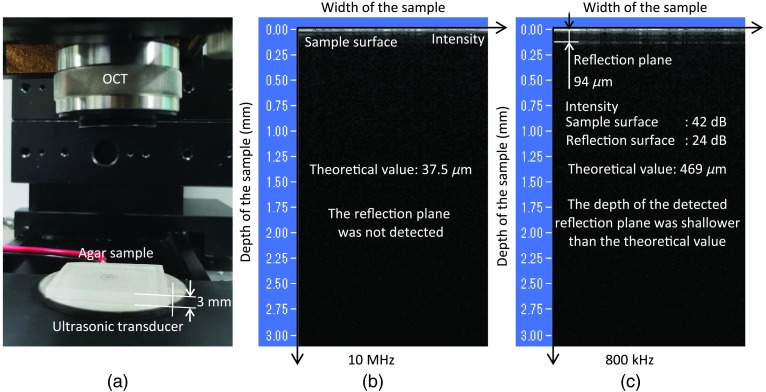
Using agar as the biological phantom, we observed the reflection plane generated by an internal ultrasonic standing wave using OCT (IVS—2000, Santec, Komaki, Japan). We made the agar was 3-mm thick because this is similar to the thickness of an earlobe. Figure 2(a) shows the experimental setup. The ultrasonic transducer was placed under the agar phantom, and the generated ultrasonic standing waves were observed using OCT. Because the velocity of sound in agar is equivalent to that in water (), ultrasonic with a frequency of 10 MHz (PN—10C10N, Japan Probe Co. Ltd., Yokohama, Japan, applied voltage: 7 ; ) was applied to obtain an optical path length shorter than . However, as shown in Figure 2(b), because the attenuation of the ultrasonic wave in the soft material like the agar was larger than in water, no reflection plane was detected. We, therefore, subjected the agar phantom to vibrations generated using an ultrasonic transducer (TDSE 50, TAMURA Corp., Tokyo, Japan, applied voltage: 7 ; ) with a frequency of 800 kHz. As shown in Fig. 2(c), it was confirmed that the desired ultrasonic standing waves were generated inside the agar phantom during ultrasonic vibration. However, while the theoretically predicted depth of the reflection plane for the ultrasonic standing wave was , the actual measured depth was only , which was one-fifth of the theoretical value. This difference was attributed to the higher-order harmonics that occur due to the parametric effect of the incident sound waves, meaning that ultrasonic standing waves were generated at shallower depths. Only one reflection surface can be seen on the OCT image because the incident light is almost reflected by the sample surface and the reflection plane of the fifth harmonic. Therefore, a reflection plane generated at a position deeper than the reflection plane of the fifth harmonic could not be observed.
Fig. 2.
Detection of the reflection plane inside a biological phantom using OCT: (a) the experimental setup, (b) the results using a vibration frequency of 10 MHz, and (c) the results using a vibration frequency of 800 kHz.
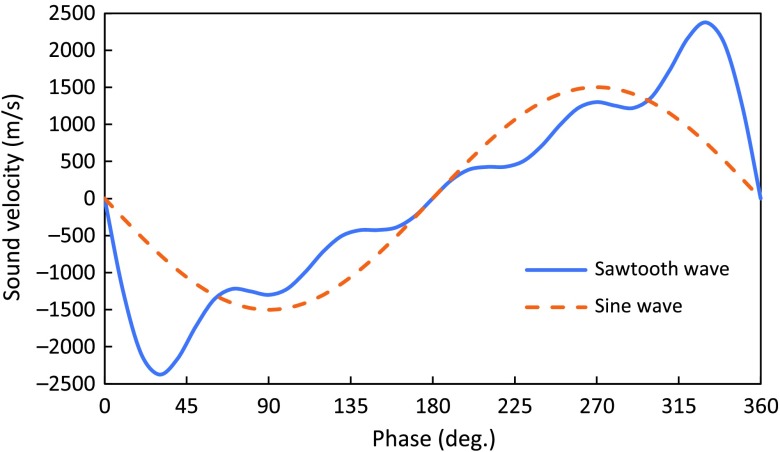
We calculated the theoretical value of the reflectance of the reflection plane of the fifth harmonic shown in Fig. 2(c). Our calculation the sound velocity of the sawtooth wave included the fifth harmonic. Figure 3 shows the sawtooth wave including harmonics up to the fifth harmonic. The sound velocity of the sawtooth wave () in Fig. 3 is . The density () that satisfies is given by Eq. (2), where is the bulk modulus:
| (2) |
For the bulk modulus , we used the value for water at 20°C (2.190 GPa). The resulting density () was 388.3 , and the ratio of this to the normal density (, ) was 0.39. We assumed the density ratio and refractive index were equal. Therefore, we calculated the refractive index () of the reflecting surface as 0.56 by multiplying the refractive index of the agar () by the density ratio. The theoretical value of the reflectance of the reflection plane was calculated as 0.2 by
| (3) |
Fig. 3.
The sawtooth wave including harmonics up to the fifth harmonic.
In addition, the actual reflectance () was obtained from the experimental result of the reflection plane detection using OCT. The intensity of the sample surface () from OCT was 42 dB and the intensity of the reflection plane () was 24 dB. Assuming that the sum of the reflectance of the two layers was one, was calculated as 0.36 by
| (4) |
There was an error of 0.16 between the theoretical value and the actual value and this could be attributed to our agar preparation method. We used powdered agar when we made the agar, and the time taken to dissolve the powdered agar in hot water was not constant. This resulted in variation in the amount of water that evaporated, and we considered that this caused the difference between the actual and theoretical values.
3. Parametric Standing Waves
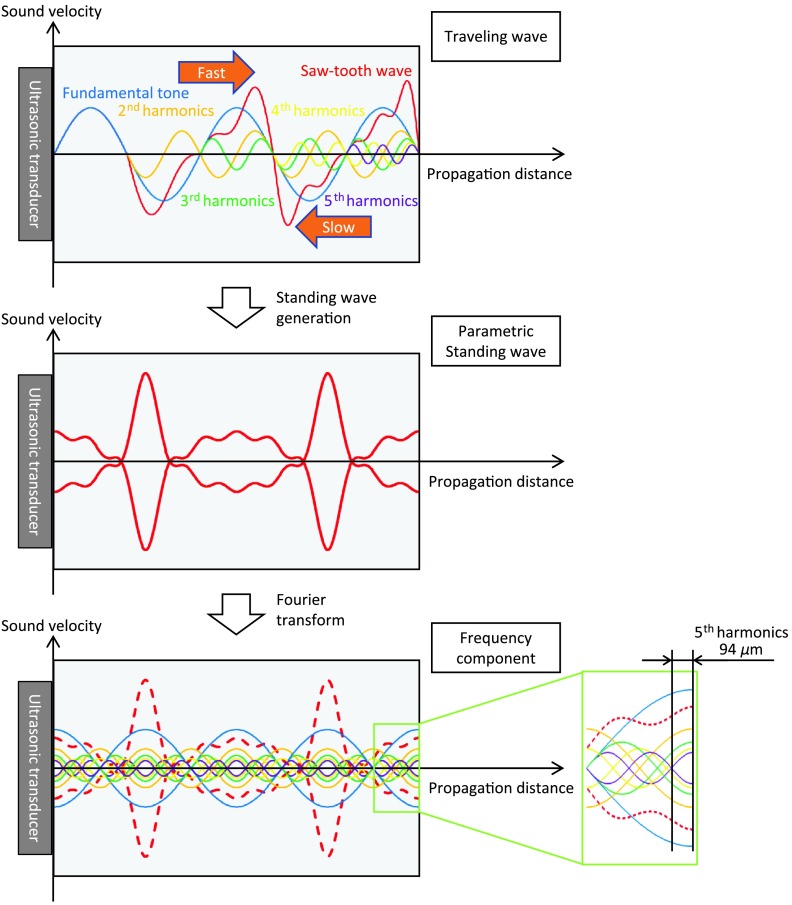
When an ultrasonic wave is incident on a sample, the density of the sample changes linearly with the sound pressure. In addition, the velocity of an ultrasonic wave changes in proportion to the density of the medium, in which it propagates. Based on these relationships, the density increases in the region where the sound pressure of an ultrasonic wave is high, and the sound velocity also increases. Conversely, the density and sound velocity decreases in the regions of low sound pressure. The parametric effect is a nonlinear phenomenon, in which the waveform becomes distorted as incident ultrasonic waves propagate in the substance, and gradually form a sawtooth pattern. Figure 4 shows a schematic diagram of a parametric standing wave. When a sinusoidal wave is incident on a nonrigid sample, it generates higher harmonic waves that become increasingly distorted to look like a sawtooth wave as the waveform propagates, due to the large compressibility of the sample. The sawtooth wave can then be analyzed by resolving it into its integer multiple higher harmonics via a Fourier transform, as shown in
| (5) |
Fig. 4.
Schematic diagram of a parametric standing wave.
We consider the harmonic standing waves formed for each frequency component. The waveform obtained by adding these standing waves is called a parametric standing wave. For the detection part of the experiment, the reflection plane inside the agar phantom is shown in Sec. 2. When an ultrasonic wave with a frequency of 800 kHz was applied, the reflection plane at a depth one-fifth of the theoretically predicted value was detected. Therefore, a parametric standing wave, including the fifth harmonic (4 MHz), was generated in the agar phantom, and a reflection surface was generated.
Parametric standing waves could not be observed in the experiment using a liquid, but could be seen in the agar phantom which is a nonrigid sample. Biological samples suffer from the strong attenuation of sound waves, which prevent high-frequency ultrasonic waves from generating a reflection plane at a shallow depth from the surface. However, it is possible to generate a reflection plane at a shallow depth using low-frequency waves, which have less attenuation. The parametric standing wave can generate the reflection plane, which is equivalent to the reflection plane generated by high-frequency waves using a low-frequency waves.
4. Detection of Higher Order Harmonics in the Agar Phantom
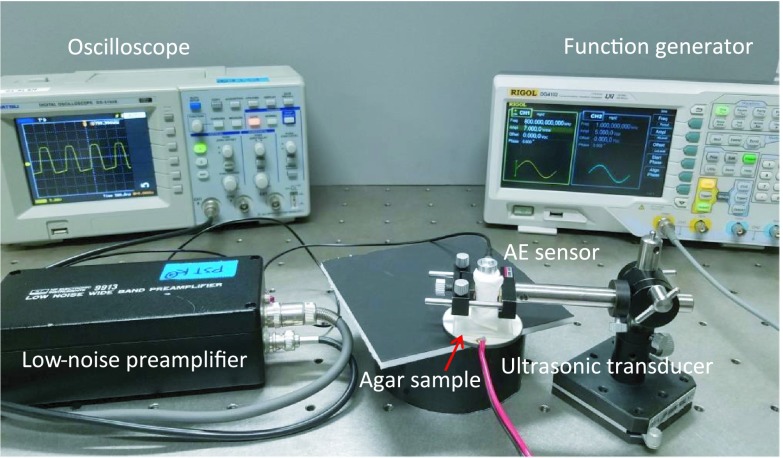
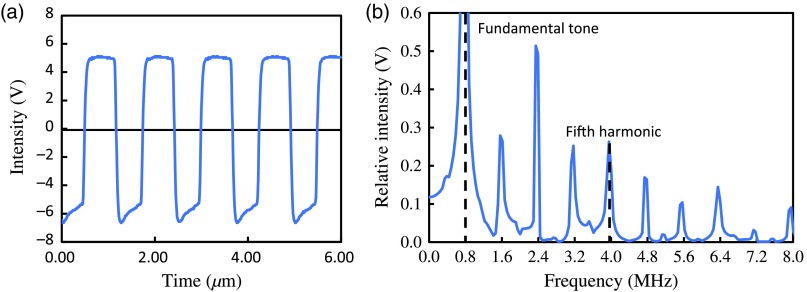
To verify the presence of the parametric standing waves, the experimental system shown in Fig. 5 was constructed, and the higher order harmonics inside the agar phantom were measured. Ultrasonic waves with a frequency of 800 kHz were applied from the bottom of 3-mm-thick agar phantom. The waveform of the propagated ultrasonic wave was detected using an AE sensor (AE, 900 S—WB, NF Corp., Yokohama, Japan) installed on the top surface of the agar phantom. The AE sensor was connected to an oscilloscope (DS-5102B, IWATSU ELECTRIC CO., LTD., Tokyo, Japan) through a low-noise preamplifier (9913, NF Corp., Yokohama, Japan). The experimental results are shown in Fig. 6. The detected waveform differed significantly from a sine wave. This waveform was decomposed into each frequency component using an FFT, as shown in
| (6) |
Fig. 5.
The experimental setup with an AE sensor used to detect the higher order harmonics in the agar phantom.
Fig. 6.
(a) The results of the experiment and (b) frequency component of the detected waveform calculated by FFT.
We set the time step to be , and the number of FFT points to 2048. The waveform was analyzed over the course of two cycles (). The results of the analysis are shown in Fig. 4(b). We confirmed that the detected waveform contained a component with a frequency of 4 MHz. From this experiment, the parametric standing waves were demonstrated.
5. Measurement of Glucose Concentrations from the Reflection Plane Generated by the Parametric Standing Wave
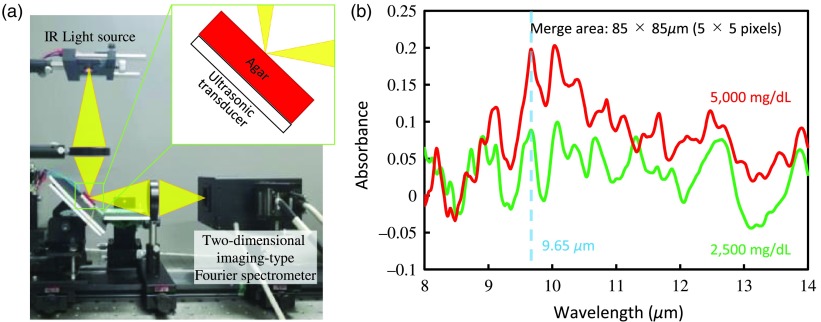
We measured glucose concentrations in agar samples using the reflection plane generated by the parametric standing wave. We used a Kanthal filament infrared (IR) source (EK8620, Helioworks, Santa Rosa, California) as a mid-infrared light source and a two-dimensional imaging-type Fourier spectrometer20 as the optical receiver. Figure 7(a) shows the experimental setup. We irradiated the agar with incident light by critical illumination. The incident light entered the agar at an angle of 45 deg. An ultrasonic transducer was placed under the agar, and we vibrated the agar using the ultrasonic transducer (applied voltage: 7 ) with a frequency of 800 kHz and generated the parametric standing wave. The incident light was reflected at the reflection plane generated at a depth of from the agar surface and received by the two-dimensional imaging-type Fourier spectrometer. We prepared agar samples containing glucose (2500 and ). To calculate the absorbance of agar, we measured the agar without added glucose and used the data as the background. This allowed us to detect the glucose absorption peak at in the glucose-containing agar [Fig. 7(b)]. In addition to the expected peak at , multiple other peaks were observed that we attributed to noise. In the optical system used for this experiment, the depth of focus was high because the numerical aperture was small. Therefore, we included surface reflection light, which is over three times stronger than internal reflection light, in the spectroscopic data. Increasing the numerical aperture decreases the depth of focus, and the surface reflection light becomes a noise component and can be removed. Therefore, it is possible to improve the spectroscopic data by changing the lens of the spectrometer. Additionally, for the IR wavelength used (), water has an absorption coefficient of roughly . We assumed that the absorbance when incident light was completely absorbed was equal to two. Using this absorption coefficient and absorbance, we calculated the optical path length from the Beer–Lambert law. The resulting optical path length where incident light was completely absorbed was . However, the water content of the skin surface layer is 10% to 30%. Therefore, the optical path length where incident light is completely absorbed in the skin will range from (water content of 10%) to (water content of 30%). Consequently, it is possible to obtain reflection light from a reflection plane generated at a depth of by a parametric standing wave. We estimated the actual optical path length from the absorbance obtained in this experiment. To do this, we assumed that the absorption coefficient of the agar would be equal to that of the glucose solution because they both have very high water contents. We placed the glucose aqueous solution in a liquid cell with an optical path length of and analyzed it by FTIR, which gave an absorbance of about 0.17 and absorption coefficient of . The absorbance of agar was about 0.2 [Fig. 7(b)]. Then, using the absorbance of agar and absorption coefficient of glucose, we calculated the optical path length of agar was . This result is close to , which is the position of the reflection plane generated by the parametric standing wave. This experiment demonstrates the feasibility of a noninvasive blood glucose sensor using ultrasonic-assisted mid-infrared spectroscopic imaging in biological samples with a parametric standing wave.
Fig. 7.
Measurement of glucose concentrations from the reflection plane generated by the parametric standing wave using a IR light source: (a) The experimental setup and (b) the results of the experiment.
6. Conclusions
We proposed that a parametric standing wave could generate a reflection plane inside biological tissue for realization of a noninvasive blood glucose sensor. To investigate this, we used an agar phantom as the simulated biological sample, and OCT to observe the reflection plane that was generated by an ultrasonic standing wave. As a result of the ultrasonic wave with a frequency of 800 kHz, a reflection plane was generated at a depth of , which corresponded to a 4-MHz ultrasonic wave. We believe that the reflection plane was generated by a parametric standing wave, which can create shallow reflection planes based on higher harmonic waves. We detected the waveform distortion using an AE sensor. Using a Fourier transformation, we confirmed the presence of a frequency component at 4 MHz. We also successfully detected the glucose absorbance by the generated parametric standing wave using a two-dimensional imaging-type Fourier spectrometer operating in the mid-infrared light region. In future research, we will apply the ultrasonic-assisted mid-infrared spectroscopy method using the parametric standing wave to the living body.
Acknowledgments
We thank Louis R. Nemzer, PhD, from Edanz Group for editing a draft of this manuscript.
Biographies
Tomoya Kitazaki received his bachelor of engineering degree in mechanics from Kagawa University in 2018. He is now completing a master of engineering at the same university. He is a member of SPIE.
Ichiro Ishimaru received a doctor of engineering from the University of Tokyo in 1999. He is a member of SPIE and the Optical Society of America.
Biographies of the other authors are not available.
Disclosures
We declare no conflicts of interest.
References
- 1.Cho N. H., et al. , “IDF diabetes atlas: global estimates of diabetes prevalence for 2017 and projections for 2045,” Diabetes Res. Clin. Pract. 138, 271–281 (2018). 10.1016/j.diabres.2018.02.023 [DOI] [PubMed] [Google Scholar]
- 2.Lundsgaard-Nielsen S. M., et al. , “Critical-depth Raman spectroscopy enables home-use non-invasive glucose monitoring,” PLoS One 13(5), e0197134 (2018). 10.1371/journal.pone.0197134 [DOI] [PMC free article] [PubMed] [Google Scholar]
- 3.Müller U. A., et al. , “Non-invasive blood glucose monitoring by means of near infrared spectroscopy: methods for improving the reliability of the calibration models,” Int. J. Artif. Organs 20(5), 285–290 (1997). 10.1177/039139889702000509 [DOI] [PubMed] [Google Scholar]
- 4.Heise H. M., et al. , “Noninvasive blood glucose sensors based on near-infrared spectroscopy,” Artif. Organs 18(6), 439–447 (1994). 10.1111/aor.1994.18.issue-6 [DOI] [PubMed] [Google Scholar]
- 5.Khalil O. S., “Spectroscopic and clinical aspects of noninvasive glucose measurements,” Clin. Chem. 45(2), 165–177 (1999). [PubMed] [Google Scholar]
- 6.Malin S. F., et al. , “Noninvasive prediction of glucose by near-infrared diffuse reflectance spectroscopy,” Clin. Chem. 45(9), 1651–1658 (1999). [PubMed] [Google Scholar]
- 7.Arimoto H., Tarumi M., Yamada Y., “Instrumental requirements for non-invasive blood glucose measurement using NIR spectroscopy,” Opt. Rev. 10(3), 161–165 (2003). 10.1007/s10043-003-0161-1 [DOI] [Google Scholar]
- 8.Maruo K., Yamada Y., “Near-infrared noninvasive blood glucose prediction without using multivariate analyses: introduction of imaginary spectra due to scattering change in the skin,” J. Biomed. Opt. 20(4) 047003 (2015). 10.1117/1.JBO.20.4.047003 [DOI] [PubMed] [Google Scholar]
- 9.Yadav J., et al. , “Prospects and limitations of non-invasive blood glucose monitoring using near-infrared spectroscopy,” Biomed. Signal Process. Control 18, 214–227 (2015). 10.1016/j.bspc.2015.01.005 [DOI] [Google Scholar]
- 10.Uwadaira Y., et al. , “Identification of informative bands in the short-wavelength NIR region for non-invasive blood glucose measurement,” Biomed. Opt. Express 7(7), 2729–2737 (2016). 10.1364/BOE.7.002729 [DOI] [PMC free article] [PubMed] [Google Scholar]
- 11.Yamada K., “Device for measuring concentration of substance in blood, and method for measuring concentration of substance in blood,” US20180000386A1 (2018).
- 12.Pleitez M. A., et al. , “In vivo noninvasive monitoring of glucose concentration in human epidermis by mid-infrared pulsed photoacoustic spectroscopy,” Anal. Chem. 85(2), 1013–1020 (2012). 10.1021/ac302841f [DOI] [PubMed] [Google Scholar]
- 13.Pleitez M., von Lilienfeld-Toal H., Mäntele W., “Infrared spectroscopic analysis of human interstitial fluid in vitro and in vivo using FT-IR spectroscopy and pulsed quantum cascade lasers (QCL): establishing a new approach to non invasive glucose measurement,” Spectrochim. Acta Part A 85(1) 61–65 (2012). 10.1016/j.saa.2011.09.007 [DOI] [PubMed] [Google Scholar]
- 14.Miyauchi Y., et al. , “Development of a glucose measuring system using a confocal optical system,” Electron. Commun. Jpn. 97(12), 35–41 (2014). 10.1002/ecj.2014.97.issue-12 [DOI] [Google Scholar]
- 15.Kino S., Tanaka Y., Matsuura Y., “Blood glucose measurement by using hollow optical fiber-based attenuated total reflection probe,” J. Biomed. Opt. 19(5), 057010 (2014). 10.1117/1.JBO.19.5.057010 [DOI] [PubMed] [Google Scholar]
- 16.Kasahara R., et al. , “Noninvasive glucose monitoring using mid-infrared absorption spectroscopy based on a few wavenumbers,” Biomed. Opt. Express 9(1) 289–302 (2018). 10.1364/BOE.9.000289 [DOI] [PMC free article] [PubMed] [Google Scholar]
- 17.Yamamoto N., et al. , “Ultrasonic standing wave preparation of a liquid cell for glucose measurements in urine by midinfrared spectroscopy and potential application to smart toilets,” J. Biomed. Opt. 23(5), 050503 (2018). 10.1117/1.JBO.23.5.050503 [DOI] [PubMed] [Google Scholar]
- 18.Duck F. A., “Nonlinear acoustics in diagnostic ultrasound,” Ultrasound Med. Biol. 28(1), 1–18 (2002). 10.1016/S0301-5629(01)00463-X [DOI] [PubMed] [Google Scholar]
- 19.Duck F. A., “Acoustic properties of tissue at ultrasonic frequencies,” in Physical Properties of Tissue: A Comprehensive Reference Book, pp. 73–124, Academic Press, Bath: (1990). [Google Scholar]
- 20.Inoue Y., et al. , “Variable phase-contrast fluorescence spectrometry for fluorescently stained cells,” Appl. Phys. Lett. 89, 121103 (2006). 10.1063/1.2356312 [DOI] [Google Scholar]


