Abstract.
For patients undergoing surgical cancer resection of squamous cell carcinoma (SCCa), cancer-free surgical margins are essential for good prognosis. We developed a method to use hyperspectral imaging (HSI), a noncontact optical imaging modality, and convolutional neural networks (CNNs) to perform an optical biopsy of ex-vivo, surgical gross-tissue specimens, collected from 21 patients undergoing surgical cancer resection. Using a cross-validation paradigm with data from different patients, the CNN can distinguish SCCa from normal aerodigestive tract tissues with an area under the receiver operator curve (AUC) of 0.82. Additionally, normal tissue from the upper aerodigestive tract can be subclassified into squamous epithelium, muscle, and gland with an average AUC of 0.94. After separately training on thyroid tissue, the CNN can differentiate between thyroid carcinoma and normal thyroid with an AUC of 0.95, 92% accuracy, 92% sensitivity, and 92% specificity. Moreover, the CNN can discriminate medullary thyroid carcinoma from benign multinodular goiter (MNG) with an AUC of 0.93. Classical-type papillary thyroid carcinoma is differentiated from MNG with an AUC of 0.91. Our preliminary results demonstrate that an HSI-based optical biopsy method using CNNs can provide multicategory diagnostic information for normal and cancerous head-and-neck tissue, and more patient data are needed to fully investigate the potential and reliability of the proposed technique.
Keywords: hyperspectral imaging, head and neck cancer, optical biopsy, convolutional neural network, deep learning, classification, squamous cell carcinoma
1. Introduction
Cancers of the head and neck are the sixth most common cancer worldwide, including cancers that are predominantly of squamous cell origin, for instance the oral cavity, nasopharynx, pharynx, and larynx, and others such as carcinomas of the thyroid gland.1 Major risk factors include consumption of tobacco and alcohol, exposure to radiation, and infection with human papilloma virus.2,3 Approximately 90% of cancer at sites including the lips, gums, mouth, hard, and soft palate, and anterior two-thirds of the tongue are squamous cell carcinoma (SCCa).4 The diagnostic procedure of SCCa typically involves physical examination and surgical evaluation by a physician, tissue biopsy, and diagnostic imaging, such as PET, MRI, or CT. Patients with SCCa tend to present with advanced disease, with about 66% presenting as stage III or IV disease, which requires more procedures for successful treatment of the patient.5 The standard treatment for these cancers usually involves surgical cancer resection with potential adjuvant therapy, such as chemotherapy or radiation, depending on the extent, stage, and location of the lesion. Successful surgical cancer resection is a mainstay treatment of these cancers to prevent local disease recurrence and promote disease-free survival.6
Previous studies have investigated the optical properties of normal and malignant tissues from areas of the upper aerodigestive tract.7–10 Muller et al. acquired in-vivo reflectance-based spectroscopy from normal, dysplasia, inflammation, and cancer sites in the upper aerodigestive tract from patients with SCCa to extract tissue parameters that yield biochemical or structural information for identifying disease. Varying degrees of disease and normal tissue could be distinguished because of their different optical properties that were believed to be related to collagen and nicotinamide adenine dinucleotide.7 Similarly, Beumer et al. acquired reflectance spectroscopy measurements from 450 to 600 nm from patients with SCCa and implemented an inverse Monte Carlo method to derive oxygenation-based tissue properties from the optical signatures, which were found to be significantly different in malignant and nonmalignant tissues.10
Hyperspectral imaging (HSI) is a noncontact, optical imaging modality capable of acquiring a series of images at multiple discrete wavelengths, typically on the order of hundreds of spectral bands. Preliminary research demonstrates that HSI has potential for providing diagnostic information for a myriad of diseases, including anemia, hypoxia, cancer detection, skin lesion and ulcer identification, urinary stone analysis, enhanced endoscopy, and many potential others in development.11–22 Supervised machine learning and artificial intelligence algorithms have demonstrated the ability to classify images after being allowed to learn features from training or example images. One such method, convolutional neural networks (CNNs), has demonstrated astounding performance at image classification tasks due to their capacity for robust handling of training sample variance and ability to extract features from large training data sizes.23,24
The need for an imaging modality that can perform diagnostic prediction could potentially aid surgeons with real-time guidance during intraoperative cancer resection. This study aims to investigate the ability of HSI to classify tissues from the thyroid and upper aerodigestive tract using CNNs. This work was initially presented as a conference proceedings and oral presentation.25 First, a simple binary classification is performed, i.e., cancer versus normal, and second, multiclass subclassification of normal upper aerodigestive tract samples is investigated. If proven to be reliable and generalizable, this method could help provide intraoperative diagnostic information beyond palpation and visual inspection to the surgeon’s resources, perhaps enabling surgeons to achieve more accurate cuts and biopsies, or as a computer-aided diagnostic tool for physicians diagnosing and treating these types of cancer.
2. Methods
To investigate the ability of HSI to perform optical biopsy, we recruited patients with thyroid or upper aerodigestive tract cancers into our study, acquired and processed gross-level HSI of freshly excised tissue specimens, trained our CNN, and evaluated system performance.
2.1. Experimental Design
In collaboration with the Otolaryngology Department and the Department of Pathology and Laboratory Medicine at Emory University Hospital Midtown, 21 head and neck cancer patients who were electing to undergo surgical cancer resection were recruited for our study to evaluate the efficacy of using HSI for optical biopsy.26,27 From these 21 patients, a total of 63 excised tissue samples were collected. From each patient, three tissue samples were obtained from the primary cancer gross specimen in the surgical pathology department after the primary cancer had been resected. The specimens were selected to include tumor, normal tissue, and a tissue specimen at the tumor–normal interface. Each specimen was typically around in area and 3 mm in depth. The collected tissues were kept in cold phosphate-buffered saline during transport to the imaging laboratory, where the specimens were scanned with an HSI system.28,29
Two regions of interest (ROIs) were used for this study: first, the upper aerodigestive tract sites, including tongue, larynx, pharynx, and mandible; second, the thyroid and associated carcinomas. Head and neck squamous cell carcinoma (HNSCCa) of the aerodigestive tract represented the first group, composed of seven patients. Normal tissue was obtained from all patients in the HNSCCa group, and SCCa was obtained from six of these patients. In head and neck cancers, the noncancerous tissues adjacent to SCC may be dysplastic, inflammatory, or keratinized, which could affect the HSI results. Therefore, the normal tissues included in this study were regions of normal tissue that were not dysplastic or heavily inflamed tissues. The thyroid group consisted of 14 patients totally and included 1 benign neoplasm and 3 malignant neoplasms: benign multinodular goiter (MNG, 3 patients), classical-type papillary thyroid carcinoma (cPTC, 4 patients), follicular-type papillary thyroid carcinoma (fPTC, 4 patients), and medullary thyroid carcinoma (MTC, 3 patients), respectively.
After imaging with HSI, tissues were fixed in formalin, underwent hemotoxylin and eosin staining, paraffin embedded, sectioned, and digitized. A certified pathologist with head and neck expertise confirmed the diagnoses of the ex-vivo tissues using the digitized histology slides in Aperio ImageScope (Leica Biosystems Inc., Buffalo Grove, Illinois). The histological images serve as the ground truth for the experiment.
2.2. Hyperspectral Imaging and Processing
The hyperspectral images were acquired using a CRI Maestro imaging system (Perkin Elmer Inc., Waltham, Massachusetts), which is composed of a xenon white-light illumination source, a liquid crystal tunable filter, and a 16-bit charge-coupled device camera capturing images at a resolution of and a spatial resolution of per pixel.27,28,30,31 The hypercube contains 91 spectral bands, ranging from 450 to 900 nm with a 5-nm spectral sampling interval. The average imaging time for acquiring a single HSI was about 1 min.
The hyperspectral data were normalized at each wavelength () sampled for all pixels by subtracting the inherent dark current (captured by imaging with a closed camera shutter) and dividing by a white reference disk according to the following equation:27,31
Specular glare is created on the tissue surfaces due to wet surfaces completely reflecting incident light. Glare pixels do not contain useful spectral information for tissue classification and are hence removed from each HSI by converting the RGB composite image of the hypercube to grayscale and experimentally setting an intensity threshold that sufficiently removes the glare pixels, assessed by visual inspection.
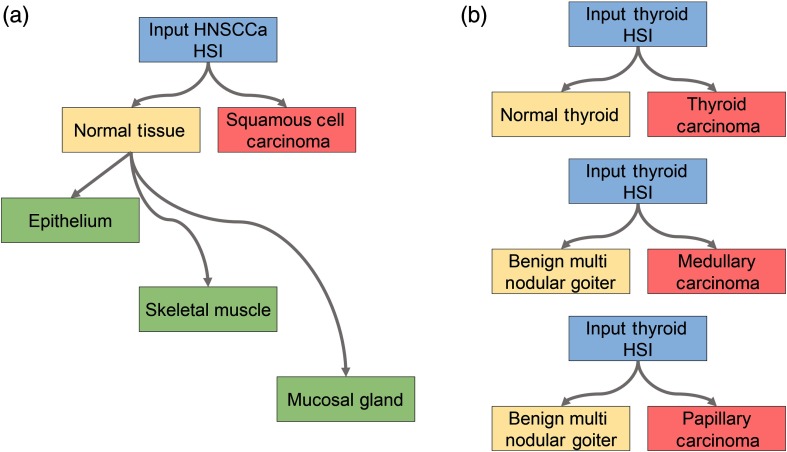
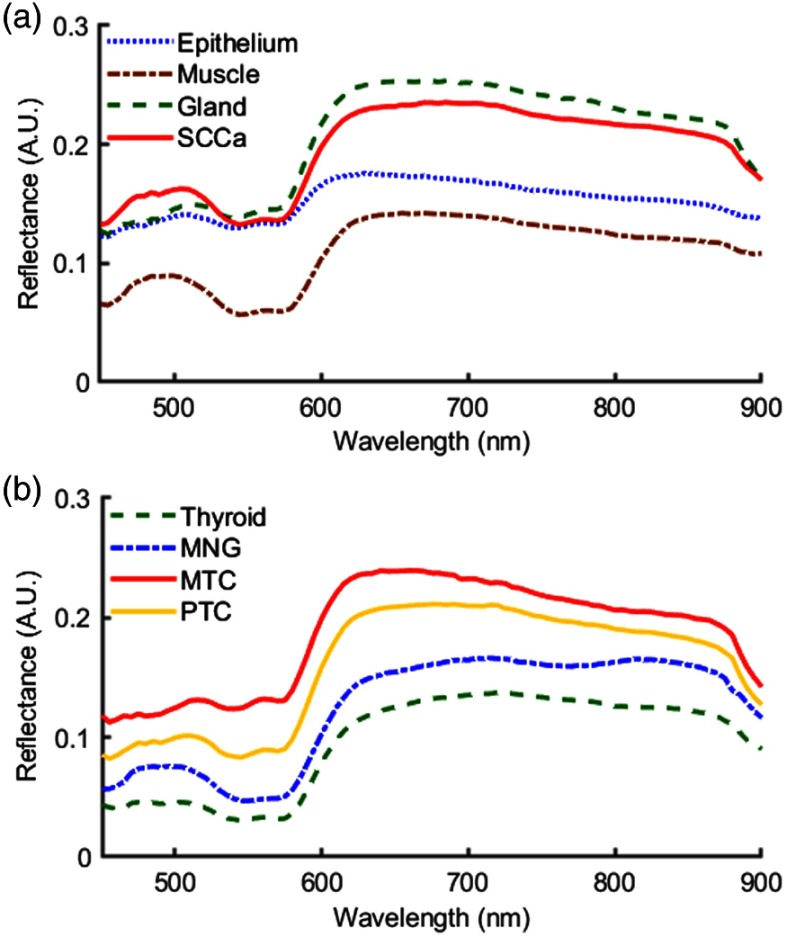
A schematic of the classification scheme is shown in Fig. 1. For binary cancer classification, the classes used are normal aerodigestive tissue versus SCCa, and medullary and papillary thyroid carcinoma versus normal thyroid tissue. For multiclass classification of oral and aerodigestive tract tissue, squamous epithelium, skeletal muscle, and salivary glands in the oral mucosa are used. For binary classifications of thyroid cancer, cPTC, MTC, and multinodular thyroid goiter tissue are used. The spectral signatures obtained from the HSI after postprocessing are plotted as each class in Fig. 2.
Fig. 1.
Tissue classification scheme. (a) For classification of the HNSCCa group, first a binary classification is considered to test the ability of the classifier to distinguish normal samples from SCCa samples. Next, histologically confirmed normal samples are subclassified as squamous epithelium, skeletal muscle, and mucosal salivary glands. (b) For classification of the thyroid group, first a binary classification is considered to test the ability of the classifier to distinguish normal thyroid samples from thyroid carcinoma of multiple types. In addition, thyroid HSI classification is tested to discriminate MNG from MTC and to discriminate MNG from classical-type PTC.
Fig. 2.
Normalized spectral signatures that were averaged between all patients of the classes of tissues that were included in this study. Presented by anatomical location: (a) normal tissue and SCCa of the upper aerodigestive tract, and (b) normal, benign, and carcinoma of the thyroid.
To avoid introducing error from registration of tissue samples that contain a tumor–normal boundary, only samples that contain exactly one class were used for binary classification. For example, the tumor sample and normal sample are held out for testing, so that validation performance can be evaluated on both class types. Out of the initial 63 samples acquired from 21 patients recruited for this study, this elimination process excluded 22 tissue samples because it was found that 2 tumor–normal margin samples were obtained from 1 patient. The normal samples from the patients with MNG thyroid neoplasm were not included in the binary cancer detection experiment. Additionally, after clinical histological evaluation, it was determined that one ex-vivo specimen from one papillary thyroid carcinoma patient was an adenomatoid nodule. This type of lesion is reported in the literature to commonly cause misdiagnoses in initial needle biopsies,32,33 and importantly, this lesion type was not adequately represented in this study. Therefore, the two remaining tissue samples from this patient were removed from this study because we aimed to have balanced tissue specimens from the thyroid carcinoma patients, normal, and tumor. After all exclusionary criteria were determined, there were 36 tissue specimens from 20 patients, 7 HNSCCa and 13 thyroid, incorporated in this study, and the epithelium, muscle, and gland tissue components were selected as ROIs from 7 tissue samples from the HNSCCa group. The number and type of tissue specimens are detailed in Table 1.
Table 1.
Number of ex-vivo tissue specimens included in this study from the 13 patients with thyroid neoplasms and 7 patients with SCC. The number of image patches for CNN classification obtained from each specimen type is also reported.
| Class | No. of tissue specimens | Total patches | |
|---|---|---|---|
| Thyroid | Normal thyroid | 10 | 14,491 |
| MNG | 3 | 9778 | |
| MTC | 3 | 10,334 | |
| Classical PTC | 3 | 6836 | |
| fPTC | 4 | 13,200 | |
| HNSCCa | Squamous epithelium | 4 | 6366 |
| Skeletal muscle | 3 | 5238 | |
| Mucosal gland | 4 | 5316 | |
| SCCa | 6 | 4008 |
For training and testing the CNN, each patient HSI needs to be divided into patches. Patches are produced from each HSI after normalization and glare removal to create nonoverlapping patches that do not include any “black holes” where pixels have been removed due to specular glare; see Table 1 for the total number of patches per class. Glare pixels are intentionally removed from the training dataset to avoid learning from impure samples. In addition, patches were augmented by 90-deg, 180-deg, and 270-deg rotations and vertical and horizontal reflections, to produce 6 times the number of samples. For cancer classification, the patches were extracted from the whole tissue. While for multiclass subclassification of normal tissues, the ROIs composed of the classes of target tissue were extracted using the outlined gold-standard histopathology images.
2.3. Convolutional Neural Network
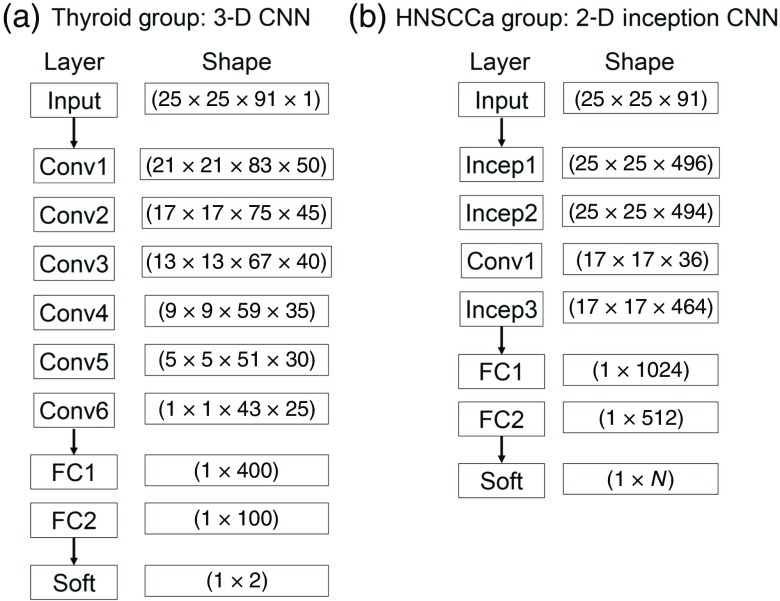
The CNNs used in this study were built from scratch using the TensorFlow application program interface for Python. A high-performance computer was used for running the experiments, operating on Linux Ubuntu 16.04 with 2 Intel Xeon 2.6 GHz processors, 512 GB of RAM, and 8 NVIDIA GeForce Titan XP GPUs. Two distinct CNN architectures were implemented for HNSCCa classification, which incorporated inception modules as shown in Fig. 3, and thyroid classification, which used a three-dimensional (3-D) architecture. Both architectures are detailed below and shown schematically in Fig. 4. During the following experiments, only the learning-related hyperparameters that were adjusted between experiments, which include learning rate, decay of the AdaDelta gradient optimizer, and batch size. Within each experiment type, the same learning rate, rho, and epsilon were used, but some cross-validation iterations used different numbers of training steps because of earlier or later training convergence.
Fig. 3.
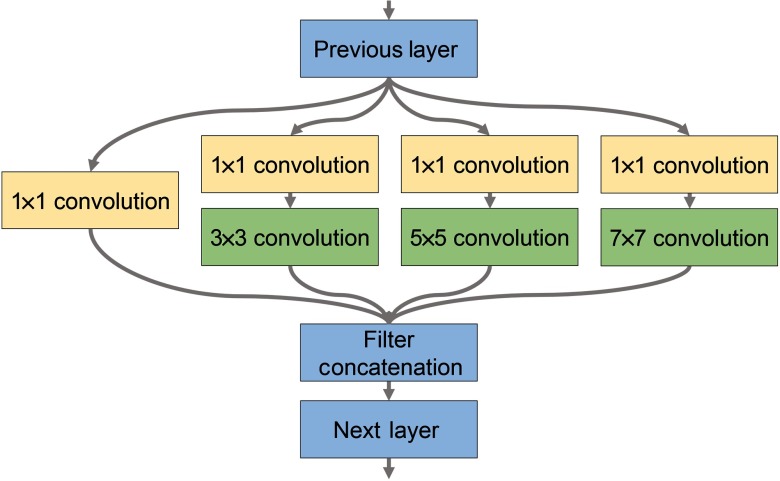
Modified inception module for use in the 2-D CNN architecture for classifying HSI of tissues from the upper aerodigestive tract.
Fig. 4.
CNN architectures implemented for classification of (a) HSI of thyroid tissue and (b) tissue from the upper aerodigestive tract.
To classify thyroid tissues, a 3-D CNN based on AlexNet, an architecture originally designed for ImageNet classification, was implemented using TensorFlow.23,34 The model consisted of six convolutional layers with 50, 45, 40, 35, 30, and 25 convolutional filters, respectively. Convolutions were performed with a convolutional kernel of , which correspond to the dimensions. Following the convolutional layers were two fully connected layers of 400 and 100 neurons each. A drop-out rate of 80% was applied after each layer. Convolutional units were activated using rectified linear units (ReLu) with Xavier convolutional initializer and a 0.1 constant initial neuron bias.35 Step-wise training was done in batches of 10 patches for each step. Every 1000 steps, the validation performance was evaluated, and the training data were randomly shuffled for improved training. Training was done using the AdaDelta, adaptive learning, optimizer for reducing the cross-entropy loss with an epsilon of and rho of 0.9.36 For thyroid normal versus carcinoma, the training was performed at a learning rate of 0.1 for 2000 to 6000 steps depending on the iteration. For MNG versus MTC and for MNG versus cPTC, the training was done at a learning rate of 0.005 for exactly 2000 steps for all iteration.
Classification of upper aerodigestive tract tissues was hypothesized to be a more complex task, so a two-dimensional (2-D) CNN architecture was constructed to include a modified version of the inception module appropriate for HSI that does not include max-pools and uses larger convolutional kernels, implemented using TensorFlow.23,24,34 As shown in Fig. 3, the modified inception module simultaneously performs a series of convolutions with different kernel sizes: a convolution; and convolutions with , , and kernels following a convolution. The model consisted of two consecutive inception modules, followed by a traditional convolutional layer with a kernel, followed by a final inception module. After the convolutional layers were two consecutive fully connected layers, followed by a final soft-max layer equal to the number of classes. A drop-out rate of 60% was applied after each layer. For binary classification, the numbers of convolutional filters are 355, 350, 75, and 350, and the fully connected layers had 256 and 218 neurons. For multiclass classification, the numbers of convolutional filters are 496, 464, 36, and 464, and the fully connected layers had 1024 and 512 neurons. Convolutional units were activated using ReLu with Xavier convolutional initializer and a 0.1 constant initial neuron bias.35 Step-wise training was done in batches of 10 (for binary) or 15 (for multiclass) patches for each step. Every 1000 steps, the validation performance was evaluated, and the training data were randomly shuffled for improved training. Training was done using the AdaDelta, adaptive learning, optimizer for reducing the cross-entropy loss with an epsilon of (for binary) or (for multiclass) and rho of 0.8 (for binary) or 0.95 (for multiclass).36 For normal oral tissue versus SCCa binary classification, the training was done at a learning rate of 0.05 for 5000 to 15,000 steps depending on the patient-held-out iteration. For multiclass subclassification of normal aerodigestive tract tissues, the training was done at a learning rate of 0.01 for 3000 to 5000 steps depending on the patient-held-out iteration.
2.4. Validation
The final layer of the CNN labels each test case as the class with the highest probability overall, so each test patch has exactly one label. In addition, the probabilities of each test patch belonging to all classes are output from the network. All testing is done on a patch-based level to ensure class accuracy. The typical classification time for one patient’s entire HSI was on the order of several minutes. The class probabilities for all patches of a test patient case are used to construct receiver operator characteristic (ROC) curves using MATLAB (MathWorks Inc, Natick, Massachusetts). For binary classification, only one ROC curve is created per patient test case, but for multiclass classification, each class is used to generate a respective ROC curve; true positive rate and false positive rate are calculated as that class against all others. The CNN classification performance was evaluated using leave-one-patient-out external validation to calculate the sensitivity, specificity, and accuracy, defined below, using the optimal operating point of each patient’s ROC curve.27,29 The area under the curve (AUC) for the ROC curves is calculated as well and averaged across patients.
3. Results
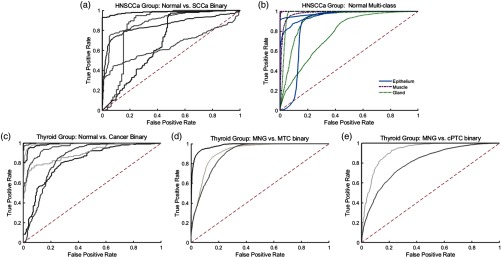
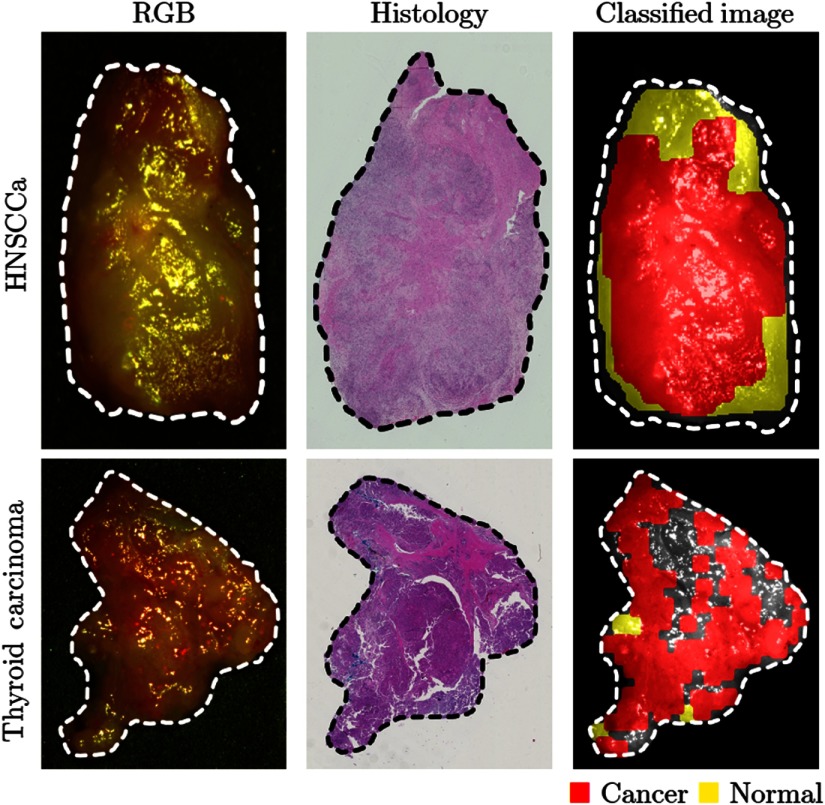
Using a leave-one-patient-out cross-validation paradigm with HSI obtained from different patients, the CNN can distinguish SCCa from normal oral tissues with an AUC of 0.82, 81% accuracy, 81% sensitivity, and 80% specificity. Table 2 shows the full results. The ROC curves for all HNSCCa patients are shown in Fig. 5. A representative HNSCCa patient classification is visualized in Fig. 6. Additionally, normal oral tissues can be subclassified into squamous epithelium, muscle, and glandular mucosa using a separately trained CNN, with an average AUC of 0.94, 90% accuracy, 93% sensitivity, and 89% specificity. Representative normal subclassification results are shown in Fig. 7, and full results are detailed in Table 3.
Table 2.
Results of interpatient CNN classification (leave-one-patient-out cross validation). Values reported are averages across all patients shown with standard deviation.
| No. of tissue specimens | AUC | Accuracy | Sensitivity | Specificity | ||
|---|---|---|---|---|---|---|
| Thyroid | Normal versus carcinoma | 20 | ||||
| cPTC versus MNG | 7 | |||||
| MTC versus MNG | 6 | |||||
| HNSCCa | Normal versus SCCa | 13 | ||||
| Multiclass | 7 |
Fig. 5.
Classification results of HSI as ROC curves for HNSCCa and thyroid experiments generated using leave-one-out cross validation. (a) Binary classification of SCCa and normal head-and-neck tissue; (b) multiclass subclassification of normal aerodigestive tract tissues; (c) binary classification of normal thyroid and thyroid carcinomas; (d) binary classification of MNG and MTC; (e) binary classification of MNG and classical PTC.
Fig. 6.
Representative results of binary cancer classification. (a) HSI-RGB composite images with cancer ROI outlined. (b) Respective histological gold standard with corresponding ROI outlined. (c) Artificially colored CNN classification results. True positive results representing correct cancer identification are visualized in red, and false negatives representing incorrect normal identification are shown in yellow. Tissue shown in grayscale represents tissue that is not classified due to the tissue surface containing glare pixels causing insufficient area to produce the necessary patch size for classification.
Fig. 7.
Representative results of subclassification of normal oral tissues. (a) HSI-RGB composites are shown with ROI of the tissue type outlined. (b) Respective histological gold standard with corresponding ROI outlined. (c) Artificially colored CNN classification results of the ROI only. True positive results representing correct tissue subtype are visualized in blue, and false negatives are shown in red. Tissue within the ROI that is shown in grayscale represents tissue that is not classified due to glare pixels or insufficient area to produce the necessary patch size.
Table 3.
Results of interpatient CNN classification of subclassified normal upper aerodigestive tract tissues. Values reported are averages across all patients shown with standard deviation.
| No. of tissue specimens | AUC | Accuracy (%) | Sensitivity (%) | Specificity (%) | |
|---|---|---|---|---|---|
| Squamous epithelium | 4 | ||||
| Skeletal muscle | 3 | ||||
| Mucosal gland | 4 |
After separately training on thyroid tissue, the CNN differentiates between thyroid carcinoma and normal thyroid with an AUC of 0.95, 92% accuracy, 92% sensitivity, and 92% specificity. The ROC curves for all thyroid patients are shown in Fig. 5, and representative thyroid carcinoma classification results are visualized in Fig. 6. Moreover, the CNN can discriminate MTC from benign MNG with an AUC of 0.93, 87% accuracy, 88% sensitivity, and 85% specificity. cPTC is differentiated from MNG with an AUC of 0.91, 86% accuracy, 86% sensitivity, and 86% specificity.
4. Discussion
We developed a deep learning-based classification method for hyperspectral images of fresh surgical specimens. The study demonstrated the ability of HSI and CNNs for discriminating between normal tissue and carcinoma. The results of normal tissue subclassification into categories of squamous epithelium, skeletal muscle, and glandular mucosa demonstrate that there is further classification potential for HSI.
A review of surgical cases found that head and neck surgery has the most intraoperative pathologist consultations (IPC) per surgery, typically around two consultations per surgery, compared to other organ systems.37 The average time at our institution was about 45 min per IPC. Despite being currently unoptimized and performed off-line, our method takes around 5 min, including imaging time, classification, and postprocessing. The main benefit is that the proposed method does not require excising tissue or any tissue processing to provide diagnostic information of the surgical area. Additionally, our method is demonstrated to be significantly faster than an average IPC. However, we do not suggest that the proposed method could replace an IPC but rather provide guidance during surgery to reduce the number or increase the quality of IPCs.
In this study, the limited patient dataset reduces the generalizability of the results. In addition, the ROI technique for outlining tissues of interest for normal multiclass subclassification creates the potential to introduce error into the experiment. Both of these issues could be resolved by utilizing a large number of patient data. Moreover, the gross-tissue specimens utilized in this study are entirely cancer or normal, so the cancer samples are composed of sheets of malignant cells. For the proposed method to be extended to the operating room to aid in the resection of cancer, the method needs to be investigated on detecting cancer cells extending beyond the cancer edge. Therefore, future studies will investigate the ability of the proposed method to accurately predict the ideal resection margin of cancerous tissues.
When the diagnosis of thyroid cancer is suspected, a needle biopsy is performed, which can provide information on the histological and intrinsic type of cancer that is present. It is not uncommon for thyroid cancer to be present with benign hyperplasia of the nonmalignant portions of the effected lobe. However, the co-occurrence of both MTC and PTC is rare, although cases have been documented.38–40 We hypothesized that HSI has further potential than binary cancer detection, as we explored in this work, and that different types of cancer can be identified from benign hyperplasia. Therefore, we performed a set of two binary classifications (MTC versus MNG and PTC versus MNG) to show both can be successfully identified from MNG. To determine if HSI can detect normal thyroid and the range of thyroid neoplasms—MTC, PTC, hyperplasia, follicular carcinoma, adenomas, and nodules—all in one multiclass approach, more patient data collection and more investigation into the robustness HSI and the classifiers need to be performed.
We acknowledge that with a limited patient set for the experiments detailed, we do not have a fully independent test set and employ a leave-one-patient-out cross-validation approach, as was reported in Sec. 3. This approach has several limitations with regards to potential overfitting from hyperparameter tuning. However, to avoid bias, the CNN architectures and number of filters in each network were not adjusted during the experiments conducted. As stated, a more complex CNN design was used for SCCa because it was deemed a more complex problem. During the experiments, the only parameters that were adjusted were the learning-related parameters, which are detailed in Sec. 2. These included the learning rate and the epsilon and rho of AdaDelta, which control the decay of learning rate and gradient optimization. Importantly, the same learning rate, rho, and epsilon were used within each experiment type so that all cross-validation iterations had the same hyperparameters. We found that different experiments, for example, HNSCCa binary compared to multiclass, required different learning-based parameters because they were trained at different rates.
Another potential source of errors from the cross-validation experiments was the effect of overfitting during training of each cross-validation iteration, within an experiment type. With the relatively small sample sizes employed in this study, swapping one patient from the validation to training set could drastically change the training time of the network. Therefore, performance of each cross-validation iteration was evaluated every 1000 training steps, and different training steps for cross-validations were sometimes used. In Sec. 2, we report the range of training steps for each experiment type; to reduce bias, the same training step number was used when it was possible for all or most cross-validation iterations.
Another limitation of this work is the issue of specular glare. Glare was systematically removed during preprocessing, so that training patches did not contain any glare pixels. This was done to avoid any training biases or error that could have been introduced from glare. Moreover, since glare was removed from training, it was also removed from the testing dataset to ensure that the quantified results were unblemished by glare artifacts to fully evaluate the classification potential of HSI. Regions that were not classified due to large amount of surface glare can be seen as grayscale in Figs. 6 and 7. However, for visualization purposes, the representative result of HNSCCa in Fig. 6 was fully classified, including patches with glare. This was done to demonstrate the classification robustness when the CNN is trained on clean, preprocessed data.
5. Conclusion
The preliminary results of this proof of principle study demonstrate that an HSI-based optical biopsy method using CNNs can provide multicategory diagnostic information for normal head-and-neck tissue, SCCa, and thyroid carcinomas. By acquiring and processing more patient HSI data, the deep learning methodology detailed will allow studies of more tissue types and potentially produce results with a more universal application. Further work involves investigating the multiple preprocessing approaches and refining the proposed deep learning architectures. Additionally, future studies will investigate the ability of the proposed technology to detect microscopic cancer near the resection margin of cancerous specimens by focusing on areas adjacent to the cancer tissue; this line of research will be important in determining if the proposed technique has the potential to aid the surgeons during an operation, as our preliminary results suggest.
Acknowledgments
The research was supported in part by the National Institutes of Health Grants CA156775, CA204254, and HL140135. The authors would like to thank the head and neck surgery and pathology teams at Emory University Hospital Midtown for their help in collecting fresh tissue specimens.
Biographies
Martin Halicek is a PhD candidate in biomedical engineering from the Georgia Institute of Technology and Emory University. His PhD thesis research is supervised by Dr. Baowei Fei, who is a faculty member of Emory University and the University of Texas at Dallas. His research interests are medical imaging, biomedical optics, and machine learning. He is also an MD/PhD student from the Medical College of Georgia at Augusta University.
Biographies of the other authors are not available.
Disclosures
The authors have no relevant financial interests in this article and no potential conflicts of interest to disclose. Informed consent was obtained from all patients in accordance with Emory Institutional Review Board policies under the Head and Neck Satellite Tissue Bank protocol.
References
- 1.Vigneswaran N., Williams M. D., “Epidemiologic trends in head and neck cancer and aids in diagnosis,” Oral Maxillofac. Surg. Clin. N. Am. 26(2), 123–141 (2014). 10.1016/j.coms.2014.01.001 [DOI] [PMC free article] [PubMed] [Google Scholar]
- 2.Ringash J., “Survivorship and quality of life in head and neck cancer,” J. Clin. Oncol. 33(29), 3322–3327 (2015). 10.1200/JCO.2015.61.4115 [DOI] [PubMed] [Google Scholar]
- 3.Ajila V., et al. , “Human papilloma virus associated squamous cell carcinoma of the head and neck,” J. Sex Transm. Dis. 2015, 791024 (2015). 10.1155/2015/791024 [DOI] [PMC free article] [PubMed] [Google Scholar]
- 4.Joseph L. J., et al. , “Racial disparities in squamous cell carcinoma of the oral tongue among women: a SEER data analysis,” Oral Oncol. 51(6), 586–592 (2015). 10.1016/j.oraloncology.2015.03.010 [DOI] [PubMed] [Google Scholar]
- 5.Yao M., et al. , “Current surgical treatment of squamous cell carcinoma of the head and neck,” Oral Oncol. 43(3), 213–223 (2007). 10.1016/j.oraloncology.2006.04.013 [DOI] [PubMed] [Google Scholar]
- 6.Kim B. Y., et al. , “Prognostic factors for recurrence of locally advanced differentiated thyroid cancer,” J. Surg. Oncol. 116, 877–883 (2017). 10.1002/jso.v116.7 [DOI] [PubMed] [Google Scholar]
- 7.Muller M. G., et al. , “Spectroscopic detection and evaluation of morphologic and biochemical changes in early human oral carcinoma,” Cancer 97(7), 1681–1692 (2003). 10.1002/cncr.v97:7 [DOI] [PubMed] [Google Scholar]
- 8.Roblyer D., et al. , “Multispectral optical imaging device for in vivo detection of oral neoplasia,” J. Biomed. Opt. 13(2), 024019 (2008). 10.1117/1.2904658 [DOI] [PMC free article] [PubMed] [Google Scholar]
- 9.Swinson B., et al. , “Optical techniques in diagnosis of head and neck malignancy,” Oral Oncol. 42(3), 221–228 (2006). 10.1016/j.oraloncology.2005.05.001 [DOI] [PubMed] [Google Scholar]
- 10.Beumer H. W., et al. , “Detection of squamous cell carcinoma and corresponding biomarkers using optical spectroscopy,” Otolaryngol. Head Neck Surg. 144(3), 390–394 (2011). 10.1177/0194599810394290 [DOI] [PMC free article] [PubMed] [Google Scholar]
- 11.Lu G., Fei B., “Medical hyperspectral imaging: a review,” J. Biomed. Opt. 19(1), 010901 (2014). 10.1117/1.JBO.19.1.010901 [DOI] [PMC free article] [PubMed] [Google Scholar]
- 12.Ravi D., et al. , “Manifold embedding and semantic segmentation for intraoperative guidance with hyperspectral brain imaging,” IEEE Trans. Med. Imaging 36(9), 1845–1857 (2017). 10.1109/TMI.2017.2695523 [DOI] [PubMed] [Google Scholar]
- 13.Pardo A., et al. , “Directional kernel density estimation for classification of breast tissue spectra,” IEEE Trans. Med. Imaging 36(1), 64–73 (2017). 10.1109/TMI.2016.2593948 [DOI] [PubMed] [Google Scholar]
- 14.Milanic M., Paluchowski L. A., Randeberg L. L., “Hyperspectral imaging for detection of arthritis: feasibility and prospects,” J. Biomed. Opt. 20(9), 096011 (2015). 10.1117/1.JBO.20.9.096011 [DOI] [PubMed] [Google Scholar]
- 15.Panasyuk S. V., et al. , “Medical hyperspectral imaging to facilitate residual tumor identification during surgery,” Cancer Biol. Ther. 6(3), 439–446 (2014). 10.4161/cbt.6.3.4018 [DOI] [PubMed] [Google Scholar]
- 16.Martin M. E., et al. , “Development of an advanced hyperspectral imaging (HSI) system with applications for cancer detection,” Ann. Biomed. Eng. 34(6), 1061–1068 (2006). 10.1007/s10439-006-9121-9 [DOI] [PubMed] [Google Scholar]
- 17.Liu P., et al. , “Multiview hyperspectral topography of tissue structural and functional characteristics,” J. Biomed. Opt. 21(1), 016012 (2016). 10.1117/1.JBO.21.1.016012 [DOI] [PubMed] [Google Scholar]
- 18.Lim H. T., Murukeshan V. M., “A four-dimensional snapshot hyperspectral video-endoscope for bio-imaging applications,” Sci. Rep. 6, 24044 (2016). 10.1038/srep24044 [DOI] [PMC free article] [PubMed] [Google Scholar]
- 19.Leavesley S. J., et al. , “Hyperspectral imaging fluorescence excitation scanning for colon cancer detection,” J. Biomed. Opt. 21(10), 104003 (2016). 10.1117/1.JBO.21.10.104003 [DOI] [PMC free article] [PubMed] [Google Scholar]
- 20.Kester R. T., et al. , “Real-time snapshot hyperspectral imaging endoscope,” J. Biomed. Opt. 16(5), 056005 (2011). 10.1117/1.3574756 [DOI] [PMC free article] [PubMed] [Google Scholar]
- 21.Gao L., Smith R. T., “Optical hyperspectral imaging in microscopy and spectroscopy—a review of data acquisition,” J. Biophotonics 8(6), 441–456 (2015). 10.1002/jbio.v8.6 [DOI] [PMC free article] [PubMed] [Google Scholar]
- 22.Blanco F., et al. , “Taking advantage of hyperspectral imaging classification of urinary stones against conventional infrared spectroscopy,” J. Biomed. Opt. 19(12), 126004 (2014). 10.1117/1.JBO.19.12.126004 [DOI] [PubMed] [Google Scholar]
- 23.Krizhevsky A., Sutskever I., Hinton G. E., “ImageNet classification with deep convolutional neural networks,” in Proc. 25th Int. Conf. Neural Inf. Process. Syst., Vol. 1, pp. 1097–1105 (2012). [Google Scholar]
- 24.Szegedy C., et al. , “Going deeper with convolutions,” in Proc. of the IEEE Conf. on Computer Vision and Pattern Recognition, pp. 1–9 (2015). [Google Scholar]
- 25.Halicek M., et al. , “Optical biopsy of head and neck cancer using hyperspectral imaging and convolutional neural networks,” Proc. SPIE 10469, 104690X (2018). 10.1117/12.2289023 [DOI] [PMC free article] [PubMed] [Google Scholar]
- 26.Fei B., et al. , “Label-free reflectance hyperspectral imaging for tumor margin assessment: a pilot study on surgical specimens of cancer patients,” J. Biomed. Opt. 22, 086009 (2017). 10.1117/1.JBO.22.8.086009 [DOI] [PMC free article] [PubMed] [Google Scholar]
- 27.Fei B., et al. , “Label-free hyperspectral imaging and quantification methods for surgical margin assessment of tissue specimens of cancer patients,” in Conf. Proc. IEEE Eng. Med. Biol. Soc., pp. 4041–4045 (2017). [DOI] [PMC free article] [PubMed] [Google Scholar]
- 28.Halicek M., et al. , “Deep convolutional neural networks for classifying head and neck cancer using hyperspectral imaging,” J. Biomed. Opt. 22(6), 060503 (2017). 10.1117/1.JBO.22.6.060503 [DOI] [PMC free article] [PubMed] [Google Scholar]
- 29.Lu G., et al. , “Detection of head and neck cancer in surgical specimens using quantitative hyperspectral imaging,” Clin. Cancer Res. 23(18), 5426–5436 (2017). 10.1158/1078-0432.CCR-17-0906 [DOI] [PMC free article] [PubMed] [Google Scholar]
- 30.Lu G., et al. , “Hyperspectral imaging of neoplastic progression in a mouse model of oral carcinogenesis,” Proc. SPIE 9788, 978812 (2016). 10.1117/12.2216553 [DOI] [PMC free article] [PubMed] [Google Scholar]
- 31.Lu G., et al. , “Framework for hyperspectral image processing and quantification for cancer detection during animal tumor surgery,” J. Biomed. Opt. 20(12), 126012 (2015). 10.1117/1.JBO.20.12.126012 [DOI] [PMC free article] [PubMed] [Google Scholar]
- 32.Schreiner A. M., Yang G. C. H., “Adenomatoid nodules are the main cause for discrepant histology in 234 thyroid fine-needle aspirates reported as follicular neoplasm,” Diagn. Cytopathol. 40(5), 375–379 (2012). 10.1002/dc.v40.5 [DOI] [PubMed] [Google Scholar]
- 33.Dabelic N., et al. , “Malignancy risk assessment in adenomatoid nodules and suspicious follicular lesions of the thyroid obtained by fine needle aspiration cytology,” Coll. Antropol. 34(2), 349–354 (2010). [PubMed] [Google Scholar]
- 34.Abadi A. A. M., et al. , “TensorFlow: large-scale machine learning on heterogeneous systems,” https://www.tensorflow.org (2015).
- 35.Glorot X., Bengio Y., “Understanding the difficulty of training deep feedforward neural networks,” in Proc. Mach. Learn. Res. (2010). [Google Scholar]
- 36.Zeiler M. D., “ADADELTA: an adaptive learning rate method,” arXiv:1212.5701 (2012).
- 37.Mahe E., et al. , “Intraoperative pathology consultation: error, cause and impact,” Can. J. Surg. 56(3), E13–E18 (2013). 10.1503/cjs.011112 [DOI] [PMC free article] [PubMed] [Google Scholar]
- 38.Dionigi G., et al. , “Simultaneous medullary and papillary thyroid cancer: two case reports,” J. Med. Case Rep. 1(1), 133 (2007). 10.1186/1752-1947-1-133 [DOI] [PMC free article] [PubMed] [Google Scholar]
- 39.Adnan Z., et al. , “Simultaneous occurrence of medullary and papillary thyroid microcarcinomas: a case series and review of the literature,” J. Med. Case Rep. 7(1), 26 (2013). 10.1186/1752-1947-7-26 [DOI] [PMC free article] [PubMed] [Google Scholar]
- 40.Mazeh H., et al. , “Concurrent medullary, papillary, and follicular thyroid carcinomas and simultaneous cushing’s syndrome,” Eur. Thyroid J. 4(1), 65–68 (2015). 10.1159/000368750 [DOI] [PMC free article] [PubMed] [Google Scholar]


