Abstract
Geometric features of macromolecular shapes are important for binding with other molecules. Kawabata, T. and Go, N. (2007) defined a pocket as a space into which a small probe can enter, but a large probe cannot. In 2010, mathematical morphology (MM) was introduced to provide a more rigorous definition, and the program GHECOM was developed using the grid-based representation of molecules. This method was simple, but effective in finding the binding sites of small compounds on protein surfaces. Recently, many 3D structures of large macromolecules have been determined to contain large internal hollow spaces. Identification and size estimation of these spaces is important for characterizing their function and stability. Therefore, we employ the MM definition of pocket proposed by Manak, M. (2019)—a space into which an internal probe can enter, but an external probe cannot enter from outside of the macromolecules. This type of space is called a “cave pocket”, and is identified through molecular grid-representation. We define a “cavity” as a space into which a probe can enter, but cannot escape to the outside. Three types of spaces: cavity, pocket, and cave pocket were compared both theoretically and numerically. We proved that a cave pocket includes a pocket, and it is equal to a pocket if no cavity is found. We compared the three types of spaces for a variety of molecules with different-sized spherical probes; cave pockets were more sensitive than pockets for finding almost closed internal holes, allowing for more detailed representations of internal surfaces than cavities provide.
Keywords: mathematical morphology, pocket, cavity, protein structure
Significance.
Finding a pocket and a cavity is important for the characterization of macromolecular 3D structures. Kawabata, T. and Go, N. (2007) proposed a simple definition of a pocket—a space into which a small probe can enter, but a large probe cannot. To find larger internal holes in large complexes, we employed Manak’s definition (2019)—a space into which an internal probe can enter, but an external probe cannot enter from outside. This pocket was named a “cave pocket”, was rigorously defined through mathematical morphology, and was implemented in the GHECOM program.
Geometric features of 3D protein structures are important for characterizing the functions of these, particularly regarding their binding ability to specific molecules [1,2]. In general, binding sites of small compounds on protein surfaces have a “pocket-shape”, as binding compounds are surrounded by protein atoms. Although the concept of binding pockets has been widely accepted by researchers, consensus has yet to be reached regarding its mathematical definition. Except for the term “pocket”, many terms have been used to describe the geometric features of binding sites such as a cavity, hole, pore, void, hollow, cleft, groove, indentation, invagination, tunnel, and channel. Although each term may describe a specific geometric characteristic, some terms are often used interchangeably. Simões, T., et al. further defined these terms, determining that “cavities” can be classified into three classes: pockets, channels, and voids [1]. Krone, M., et al. used the term cavity for all types of such spatial volumes, and further classified cavities into closed cavity, single-entry cavity (pocket, tunnel, cleft, groove), and multiple-entry cavity (channel, pore) [2]. Different algorithms have also been proposed to detect the geometric features of protein shapes. Kawabata, T and Go, N (2007) pointed out that all of the pocket-finding programs arbitrarily decide on two properties of the pocket, namely size and depth [3]. Considering these arbitrary parameters, they proposed a definition using two explicit controlling parameters based on a pocket region being defined as a space into which a small spherical probe can enter, but a large spherical probe cannot. The radii of small and large probe spheres are the two parameters that correspond to the size and depth of the pockets. We also proposed a new measure of pocket shallowness, Rinaccess, specifying a minimum inaccessible radius based on various sizes of spherical probes. Using this definition, we developed the program PHECOM to identify pockets employing two approximations: probe spheres were placed at only three-atoms contacting positions, and large spheres were placed using a heuristic algorithm for fast computations. To use more rigorous algorithms, Kawabata, T. (2010) employed a grid representation of molecular shapes and mathematical morphology [4]. Mathematical morphology is a theory used in the analysis of the geometric features of digital images based on several basic operations (including erosion, dilation, opening and closing) using a structuring element (probe) [5,6]. Masuya, M. and Doi, J. (1995) introduced mathematical morphology to detect cavities using a similar concept to Kawabata-Go pocket [7]. The Masuya-Doi pocket and Kawabata-Go pocket are described in different ways, but, they have been proven to be equivalent [4]. Delaney, J. S. (1992) proposed a cavity-detection method using cellular-logic operations [8], which were identical to iterative dilation and erosion operations to detect Masuya-Doi (Kawabata-Go) pockets. Ho, B. K. and Gruswitz, F. (2008) have developed a program HOLLOW, which also employs a grid-based algorithm using two probes [9]. Kawabata has also developed an efficient algorithm for calculating deep and shallow pockets simultaneously [4].
The program GHECOM has been developed for the updated definition of a pocket, and is widely used by many researchers. Ito, J., et al. (2012) used it to construct a database for ligand-binding and putative pockets [10], Ishida, H. (2014) employed it in characterizing the cavity regions of conformations of the proteasome sampled by molecular dynamics [11], and Kawabata, T., et al. (2017) used it to find putative binding sites for substrate-docking calculations applied to a PET-degrading enzyme [12].
The Kawabata and Go definition of a pocket implemented in the programs PHECOM and GHECOM programs is useful for finding the binding sites of small compounds. On the other hand, many 3D structures of large macromolecular complexes, including virus capsids, chaperonins, proteasomes, and transporters, have been determined. These complexes often have relatively large empty internal holes, or regions that are large enough to envelop other macromolecules. These regions (sometimes called cages or cargo) cannot be detected by the Kawabata and Go definition with any radius of spherical probe whatsoever. Empty internal holes have been detected as void regions of the molecular surface [13–15]. Cavities for water molecules have been well-studied with respect to protein stability [16,17]. However, large cavities in macromolecular complexes may not be described by the voids of the molecular surface, because they often contain entrance holes. Manak, M. (2019) recently proposed a modified definition of Masuya-Doi-Kawabata-Go (MDKG) pocket [18], implementing it using a Voronoi-based method based on the sphere representation of molecules and probes [19,20]. In this study, we have designated the pocket defined by Manak as a “cave pocket”, owing to the properties it shares with both closed cavities and pockets. Our new definitions are also implemented in the GHECOM program using the grid representation. Furthermore, we have defined the classical geometric concept, the cavity, through mathematical morphology. Three types of space, cavity, pocket, and cave pocket were compared both theoretically and numerically. Mathematical morphology enabled us to prove the relationships among the three. We compared these different geometric features for a variety of molecules with differently sized spherical probes.
Methods
Basic notations describing molecular shape
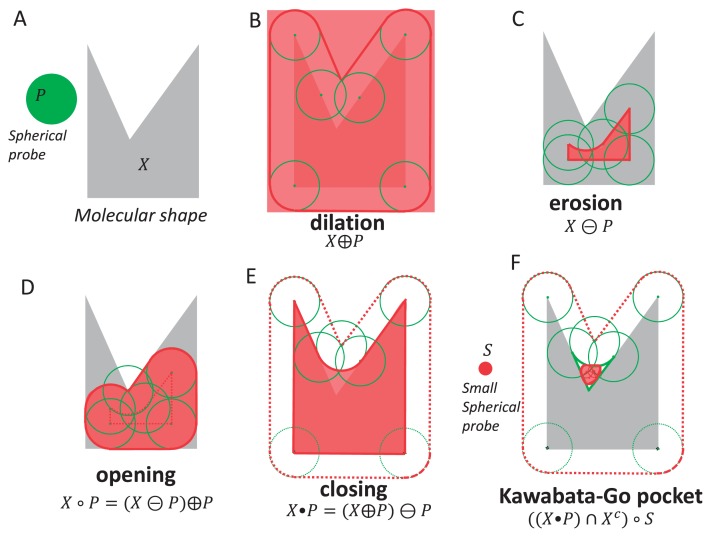
In mathematical morphology, a 3D shape X is defined as a set of 3D points; in other words, all of the black (foreground) voxels, in a black-and-white (binary) 3D discrete image, represent a 3D shape. In this study, X is a molecular shape, which is a set of 3D points (x∈E3, x∈X). In our implementation, we use integer coordinates. The shape X is the van der Walls (vdW) volume of a protein defined as the union of vdW atomic spheres. The values of the van der Waals radii are taken from Chothia, C. [21]. For the structuring element, we use a spherical probe P, which is a set of 3D points p. The probe P is symmetrical, and it includes the origin 0. Four operations important in mathematical morphology (dilation, erosion, closing and opening) are shown in Figure 1. Their detailed definitions are summarized in the Appendix. As expected, the erosion X⊝P shrinks the original shape X by the radius of P, whereas the dilation X⊕P grows the original shape X by the radius of P. The opening X∘P is a subspace of X where a probe P can enter. The closing X•P is a space where the probe P cannot enter when any overlaps between X and P are prohibited. Several useful relationships are summarized in the Appendix.
Figure 1.
Basic operations of mathematical morphology. (A) Molecular shape X and a spherical probe (structuring element) P. (B) Dilation. (C) Erosion. (D) Opening. (E) Closing. (F) Kawabata-Go pocket.
Molecular volume and solvent accessible volume
A molecular surface, which is also called a Connolly surface or solvent-excluded surface, is a well-known concept in structural biology [13,14]. It can be described in terms of mathematical morphology as the boundary of a molecule obtained by a “closing” operation. A molecular volume is defined as the closing of X by the probe P as follows.
| (1) |
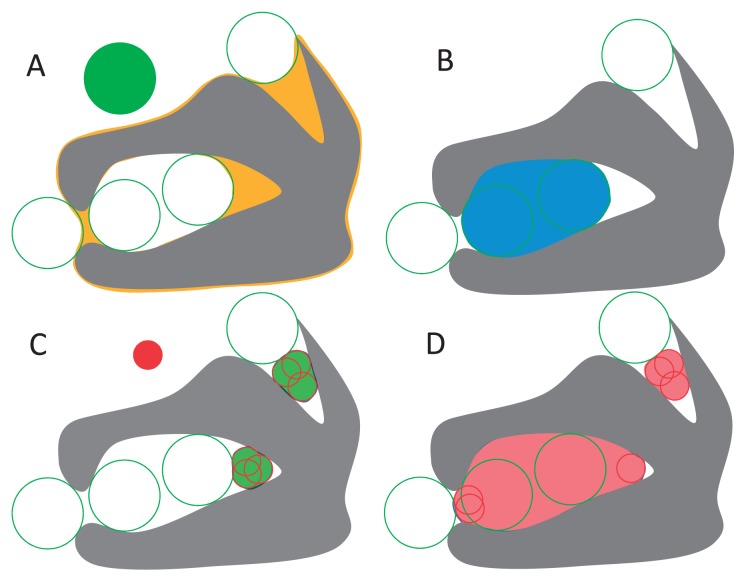
The boundary of the molecular volume is the molecular surface, as shown in Figure 1E and Figure 2A. Similarly, we can define the accessible volume by the dilation of X by the probe P as follows.
Figure 2.
Geometric features around the molecular shape X. (A) Molecular volume. (B) Cavity. (C) Kawabata-Go pocket. (D) Cave pocket.
| (2) |
The solvent accessible surface is equivalent to the boundary of the accessible volume defined by the probe P with a 1.4 Å radius [13]. It is important to note that the grid representation of the shape is suitable for calculating the volume, but it is not apt for assessing the boundary surface area. The former can be achieved by simply counting the number of grids, while the latter is impractical because the surfaces of voxel cubes are exceedingly rugged, thus requiring some interpolation to approximate the surface area.
Cavity: a space into which a probe can enter, but cannot escape to the outside
Cavities (closed cavities) in which water molecules cannot enter, are assumed to be energetically unfavorable owing to the loss of van der Waals contacts [16,17]. They are often identified using molecular surface programs, and are defined as isolated void spaces in the molecular volume [13–15]. In this section, we define similar cavities through mathematical morphology.
Cavities are defined as spaces where probes, such as water molecules, can enter, but cannot escape to the outside, as shown in Figure 2B. Because the molecular volume X•P is a P-excluded volume, the space where P can enter is described as the background of the P-excluded volume, (X•P)c. The erosion X⊝P is the set of all center positions z of (P)z, where (P)z is contained in X, as shown in Figure 1C. (P)z is the z-translated P defined in Eq. A1. The set of all center positions z of (P)z in which (P)z is contained in the background of the molecular volume (X•P)c, is defined as follows.
| (3) |
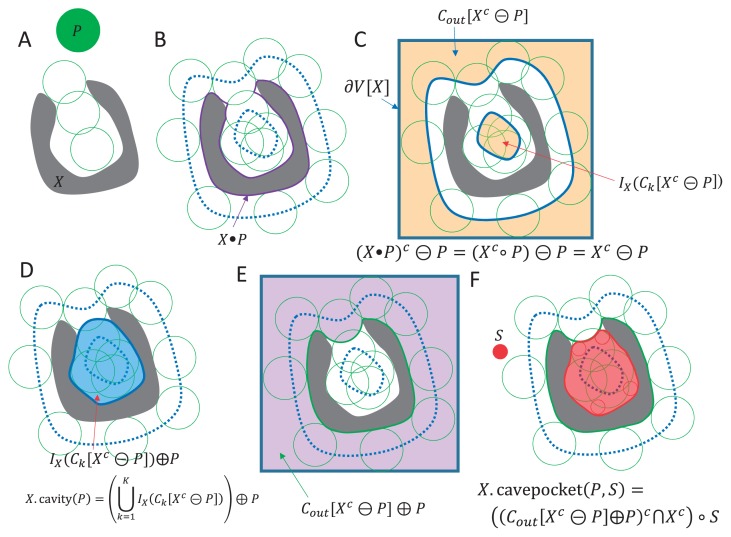
All of the connected components of the shape (X•P)c⊝P are then calculated, as shown in Figure 3C. To define the connectivity between voxels, 26 neighbor voxels are used in our implementation. We call this operation labeling. It generates K connected components, Ck[(X•P)c⊝P], as stated by Eq. 4.
Figure 3.
Schematic descriptions for the definitions of cavity and cave pocket. (A) A molecular shape X and a spherical probe P. (B) Molecular volume X•P. (C) The space (X•P)c that a probe P is able to access. The set of probe centers for (X•P)c is described as (X•P)c⊝P=Xc⊝P. The shape Xc⊝P is decomposed into connected components. In this case, it is decomposed into two components: an outside component Cout[Xc⊝P] and an inside component IX(Ck[Xc⊝P]). The frame ∂V[X] is the one-pixel-thick frame of image X. (D) A cavity is defined as IX(Ck[Xc⊝P])⊕P, which is a dilation of the inside component. (E) The outside component Cout[Xc⊝P] is the set of probe centers where a probe P is able to access from the outside. Its dilation Cout[Xc⊝P]⊕P is the space that a probe P is able to access from the outside. (F) The term (Cout[Xc⊝P]⊕P)c is the space that a probe P is not able to access from the outside. The cave pocket is defined by the opening of the shape (Cout[Xc⊝P]⊕P)c∩Xc by the internal probe S. The restriction Xc is added because the inside of X is not the target of the internal probe S.
| (4) |
We introduce an inside function IX(Y) that yields a set Y only if Y cannot access to the outside, or in other words, cross the boundary around the set X:
| (5) |
where ∂V[X] is the one-pixel-thick frame of image X as shown in Figure 3C [5]. The following equation defines the union of the centers of P in (X•P)c that are not connected to the outside.
| (6) |
The cavities are defined as a set of probes P, which are obtained by the dilation by P as follows (Fig. 3D).
| (7) |
The term (X•P)c⊝P in Eq. 7 is simplified as Xc⊝P as follows.
| (8) |
by using the duality relationship in Eq. A13 and the relationship “a P-eroded shape is P-closed” in Eq. A16. Then, the definition of the cavity in Eq. 7 can be re-written as follows.
| (9) |
Pocket: a space into which a small probe can enter, but a large probe cannot
Kawabata, T. and Go, N. (2007) introduced two spherical probes to define a pocket as a space into which a small probe can enter, but a large probe cannot, as shown in Figure 1F and Figure 2C [3]. Kawabata, T. (2010) later described the definition using mathematical morphology as follows [4]:
| (10) |
where X is the molecular shape, P is the shape of the large probe sphere, and S is that of the small probe sphere. The probes P and S satisfy symmetrical conditions given by Eqs. A7 and A8, and the probe P should be larger than the probe S.
| (11) |
If probe S is not smaller than probe P, then the pocket is empty.
| (12) |
The mathematical proof for this relationship is shown in the Appendix. This relationship is considered reasonable because it is impossible to conceive of a space where a small probe cannot enter, but a larger probe can enter.
The molecular volume X•P is the closing operation of X by P, which is defined as a space where the probe P cannot enter around X. The space (X•P)∩Xc can be changed by De Morgan’s law (Eq. A9) and the duality rule (Eq. A14) such that
| (13) |
In this way, the pocket in Eq. 10 can also be described as follows.
| (14) |
The term (X•P)c corresponds to the space where the probe P can access the background of the molecule X, as it appears in the definition of the cavity. It will also be used to define the cave pocket in the following section.
Cave Pocket: a space into which an internal probe can enter, but an external probe from outside cannot
The pockets defined in Eqs. 10 and 14 are mainly used for detecting the binding sites of small compounds; however, these may not be suitable for the large empty spaces of macromolecular complexes. The term (X•P)∩Xc in Eq. 10 corresponds to the space into which the large probe P cannot enter. Nevertheless, when the molecule X has a closed-shell shape with a sufficiently large internal hole (Fig. 2), the term (X•P)∩Xc does not include the hole, regardless of whether it can be accessed from the outside of the molecule X or not (Fig. 2C). This is because the closing operation X•P is indifferent to the path and the connectivity of the probe P to the molecule X. Following the work of Manak, M. (2019), we introduce a cave pocket as a space into which a probe P cannot enter from outside, but a probe S can, as shown in Figure 2D [18]. We therefore restrict the space (X•P)c in Eq. 14 into the subspace that the probe P can access only from the outside of X. The procedure to apply this restriction is quite similar to that of cavities, although the criteria is inverted; in other words, cavity requires the condition of inaccessibility from outside of X. The erosion and the labeling procedures are the same as those for cavities. The erosion is applied to obtain (X•P)c⊝P, which corresponds to a set of the centers of P, when P moves anywhere around (X•P)c. Similar to Eq. 4, we divide the space (X•P)c⊝P into connected components by the labeling operation (Fig. 3C).
| (15) |
In our implementation, we also use 26 neighbor voxels to define the connectivity between voxels. Using Eq. 8, the definition can be further simplified as follows.
| (16) |
The inside function IX(Y) defined in Eq. 5 is also used in the definition of cave pockets. When the molecular shape X is embedded into a space with a sufficiently distant boundary ∂V[X], only one subspace can satisfy IX(Ck[Xc⊝P])=φ among the K subspaces. This outside cluster is defined as Cout[Xc⊝P] in the following equation.
| (17) |
The term Cout[Xc⊝P] is the space relevant to the centers of P. The space required for all shapes of probes P is obtained by the dilation by P as follows (Fig. 3E).
| (18) |
This region Cout[Xc⊝P]⊕P is the restricted space of Xc on the condition that probe P can access the molecule X only from the outside. By substituting (X•P)c with Cout[Xc⊝P]⊕P in the pocket definition of Eq. 14, we can obtain the definition of a cave pocket as
| (19) |
The cave pocket defined in Eq. 19 can be notated differently. Using De Morgan’s law (Eq. A9), it can also be described as
| (20) |
This notation is used for the schematic explanations shown in Figure 3F. Using the duality relationship of erosion (Eq. A11), Eq. 19 can be converted to the notation used by Manak, M. [18].
| (21) |
Equation 21 was implemented in the GHECOM program to calculate cave pockets. By applying Eq. 8 to Eq. 20, the later can be stated as
| (22) |
This notation is the most similar to the original Kawabata-Go pocket definition.
Note that when probe S is not smaller than probe P, the cave pocket cannot be considered as always empty; thus Eq. 12 is not necessarily true for cave pockets. It is possible to imagine a large hole inside the molecule, where probe P cannot enter from the outside, but a larger probe S can enter from the inside. For this reason, when dealing with cave pockets, the terms outer and inner, or external and internal, should be considered instead of the large and small probe descriptions for P and S, respectively.
Relationships among cavity, pocket and cave pocket
We will briefly discuss the relationships between cavity, pocket and cave pocket in a theoretical manner. It is possible to prove definitively that a cave pocket is not smaller than its original pocket.
| (23) |
A cave pocket must be equal to or larger than its corresponding pocket. The proof for this relationship can be found in the Appendix.
We can further state that if probe P finds no cavities around the molecule X, then the cave pocket is identical to the pocket.
| (24) |
The proof for Eq. 24 is provided in the Appendix. Note that even if the probe P finds a cavity around the molecule X, this does not necessarily imply that the cave pocket is larger than the pocket. If the cavity region is small enough, the opening operation by probe S can erase the difference.
The cave pocket without an opening by S, referred to as X.cavepocket(P, φ), is similar to the cavity X.cavity(P), but it is not identical. The boundaries for the conditions in which probe P cannot enter from outside, Cout[Xc⊝P]⊕P, and when the probe P cannot escape to the outside, IX(Ck[Xc⊝P])⊕P, are different, as shown in Figure 3E and 3D, respectively.
Three parameters to be set: grid width, Rlarge, and Rsmall
Three parameters have to be set to calculate pockets and cave pockets: grid width, the radius of the large (external) sphere P (Rlarge), and the radius of the small (internal) sphere S (Rsmall). In our previous study regarding pockets for small compound binding sites, the grid width and Rsmall values were set to 0.8 Å and 1.87 Å, respectively [4]. The 1.87 Å radius corresponds to the size of the methyl group [21]. Different Rlarge values were employed ranging from 2 Å to 10 Å. In contrast, this study focuses on larger spaces for the binding of macromolecules, and the optimization of these parameters is necessary. The grid width controls the balance between computation speed and molecular shape details. The value of Rsmall corresponds to the radius of the minimum unit for binding molecules. If the supposed binding molecule is a protein, its minimum unit may be an amino acid, secondary structure, or a domain. The radius of a standard amino acid is in the range of 2.0–3.4 Å, the radius of the α-helix is approximately 6 Å, and the radius of a compact domain ranges from 10–20 Å. The value of Rlarge determines the hypothetical boundary (“sea-level” or “lid”) between the outside and a cavity/pocket. It is also related to the size of the binding molecules, but is determined more empirically than the two other parameters. To determine the optimal parameters, we performed many calculations with different parameters for several test molecules. Our previous studies [3,4] estimated the accuracy for identifying pockets using 3D structures of small compounds bound to proteins based on Protein Data Bank (PDB) data,as the “correct” standard. However, large internal holes in the PDB data are often found to be empty, possibly due to the disordered natures of bound molecules. When a reference bound ligand molecule was not available, we introduced simple contact spheres to provide an appropriate reference. To generate contact spheres, several small spheres were first generated on the principal component axis of the target molecule, and then their radii were adjusted to make contact with the closest atoms of the target molecule.
Identified cavities and pockets were evaluated by matching them with the reference ligand atoms or with the reference contact spheres. The ligands or reference contact spheres R were also converted into the grid system used by the program GHECOM. The similarity between the reference spheres and the calculated region Z (cavity, pocket, or cave pocket) are measured by the Tanimoto index
| (25) |
where NZ is the number of grid points of the calculated region, NR is the number of grid points of the reference (the ligand atoms or the contact spheres), and NZR is the number of grid points of the calculated region overlapping with the reference. Recall and precision for the calculated region Z (cavity, pocket, or cave pocket) against the reference R are defined as follows.
| (26) |
| (27) |
Implementation and availability
We implemented the relevant algorithms to find cavities and cave pockets in our pocket detection program GHECOM. GHECOM is written in C source code on the Linux platform. The molecular shape is represented by a 3D array of 1-byte characters (unsigned char). Both PDB and the mmCIF file can be used as the input to GHECOM. GHECOM outputs spaces of cavities, pockets, and cave pockets as a 3D density map in CCP4 format, which is visualized by UCSF Chimera [22]. The source code used in this study will be released on our web site (https://pdbj.org/ghecom/).
Results
We show calculated cavities, pockets, and cave pockets for many macromolecules with different parameters to elucidate how the parameters and the shapes of the macromolecule affect the detected spaces. First, we present the results of two specific complexes with different parameters: GroEL/ES and lumazine synthase. Second, calculations for a large dataset of assemblies (1,480 assemblies) will be shown. Third, calculations for a dataset of single chains (1,784 chains) will be shown to evaluate the prediction performance for small compound binding sites.
GroEL/ES (PDB ID: 1aon)
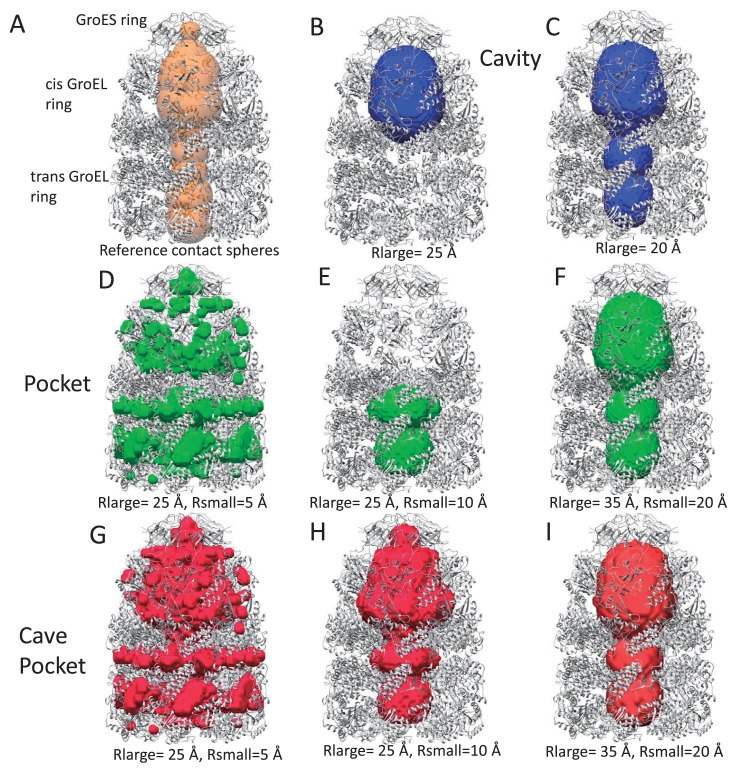
First, we focus on the chaperonin GroEL/ES (PDB ID: 1aon) structure [23] to estimate proper values of the parameters. GroEL/ES is composed of three rings as shown in Figure 4A, including a GroES ring (top), a cis GroEL ring with ADP (middle), and a trans GroEL ring (bottom). A large long hole is present in the center of the complex, which binds misfolded proteins and helps them to fold. The hole in the cis ring is significantly larger and wider than that in the trans ring.
Figure 4.
Cavities, pockets and cave pockets for chaperonin GroEL/ES (PDB ID: 1aon) with a grid width of 2 Å. (A) Reference contact spheres. (B) and (C) Cavities with Rlarge=25 Å (B) and Rlarge=20 Å (C). (D), (E) and (F) Kawabata-Go pockets with Rlarge=25 Å and Rsmall=5 Å (D), Rlarge=25 Å and Rsmall=10 Å (E), and Rlarge=35 Å and Rsmall=20 Å (F). (G), (H) and (I). Cave pockets with Rlarge=25 Å and Rsmall=5 Å (G), with Rlarge=25 Å and Rsmall=10 Å (H), and with Rlarge=35 Å and Rsmall=20 Å (I).
We introduced reference contact spheres for the GroEL/ES cavity. First, several small spheres were generated on the first principal component axis of the target molecule, then their radii were adjusted so that they made contact with the closest atoms of the target molecule. As shown in Figure 4A, these contact spheres provide a reasonable reference for the binding regions for misfolded proteins.
We calculated cavities, pockets, and cave pockets using several combination of parameters: Rlarge=10, 15, …, 40 Å, and Rsmall=5,10, …, 30 Å. It is important to note that cavities depend only on Rlarge, not on Rsmall. For GroEL/ES, we employed a coarse grid width of 2 Å as the third parameter.
Figure 5A shows volumes of these regions. Cavities were detected only for Rlarge=20 Å and 25 Å, as shown in Figure 4C and 4B. The cavity with Rlarge=20 Å matches the reference contact spheres well, while the cavity with Rlarge=25 Å does not correspond with the cavity of the trans-ring. The size of the trans-ring cavity is not large enough for the sphere with radius 25 Å to enter. The pockets and the cave pockets were found to be identical when Rlarge was neither 20 nor 25 Å. This occurred because of the condition that if no cavity is found, the cave pocket is considered to be identical to the pocket, as stated by Eq. 24. For example, the parameters Rlarge=35 Å and Rsmall=20 Å provided an identical pocket and cave pocket, as shown in Figures 4F and 4I. However, the pocket with Rlarge=25 Å only corresponded with the pocket in the trans-ring because the sphere with radius of 25 Å can enter the cis ring, but cannot enter the trans-ring (Fig. 4E). In contrast, the cavity with Rlarge=25 Å only corresponds to the cavity in the cis ring, because the sphere can enter the cis ring, but cannot escape to the outside.
Figure 5.
Volumes and Tanimoto index for chaperonin GroEL/ES (PDB ID: 1aon). Blue, green, and red lines correspond to cavities, pockets, and cave pockets, respectively. (A) Volume (Å3) versus Rsmall (Å) and Rlarge (Å). The purple line corresponds to the volume of the reference contact spheres. (B) Tanimoto index of the reference contact spheres versus Rsmall (Å) and Rlarge (Å). The highest Tanimoto value is 0.722, which is provided by pockets and cave pockets with Rlarge=35 and 40 Å and Rsmall=20 Å (Fig. 4F and 4I).
The value of Rsmall also affected the pocket and cave pockets. In general, a smaller Rsmall yielded a larger volume, as shown in Figure 5A. As shown in Figure 4D and 4G, the pocket with Rsmall=5 Å provided some spaces between the rings, which represent pockets and cave pockets. This indicates that holes of approximately 10 Å diameter are present, which may have some functional role. The value Rsmall=10 Å (Fig. 4H) provided pockets that were more similar to the reference contact sphere model (Fig. 4A). The pockets and cave pockets with Rsmall=10 Å (Fig. 4H) were more detailed than those for Rsmall=20 Å (Fig. 4I); the former exhibits a pocket in the GroES ring, but the latter does not.
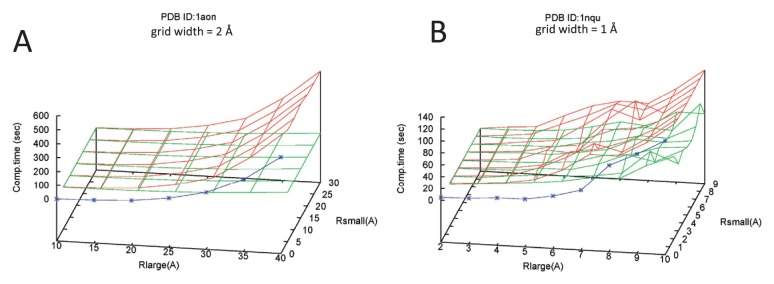
The computation times are summarized in Figure 6. Generally speaking, costs for cavities and cave pockets were much larger than those for pockets. The calculation of Xc⊝P requires more costs than that of X•P. The labeling and the connectivity checks required additional costs. The times strongly depended on the radius Rlarge, but not on the radius Rsmall.
Figure 6.
Computation times for cavities, pockets, and cave pockets for the two macromolecular complexes. The blue, green, and red lines correspond to computation times for cavities, pockets, and cave pockets, respectively. The calculations were performed using the GHECOM program. The GHECOM program was run using the single core of a Linux machine with a Core i7-6930K CPU. (A) GroEL/ES (PDB ID: 1aon). Grid width is 2 Å. (B) lumazine synthase (PDB ID: 1nqu). Grid width is 1 Å.
In light of these observations, we conclude that for the case of the GroEL/ES complex, the pocket and cave pocket provided the identical results with Rlarge>25 Å or <20 Å, and that Rsmall=10 Å is a reasonable value in this case. A cavity was generated for a small range of Rlarge (between 20 and 25 Å). However, it should be noted that even successful cases involving cavities (Fig. 4C, Rlarge=20 Å) lacked details of the inner region.
Lumazine synthase (PDB ID: 1nqu)
Next, we focused on the enzyme called lumazine synthase because of the almost closed large hole present within the icosahedral capsid, and the active sites in its internal surface [24]. Lumazine synthase (LS) is involved in the riboflavin biosynthesis of the hyper thermophilic bacterium Aquifex aeoricus. Its asymmetric unit is a homo pentamer (5 chains), and 12 asymmetric units (60 chains) provide an icosahedral capsid structure. A large hollow cavity is located in the center of the capsid structure. Active sites are located inside of the capsid. In the structure registered as PDB ID: 1nqu, 60 inhibitor compounds (RDL; 6,7-dioxo-5H-8- ribitylaminoluzamazine) bind to the active sites of the 60 chains. The role of the large hollow cavity is not fully understood yet, but it may be related to the thermophilic stability of the protein and the enzymatic activity in the thermophilic condition.
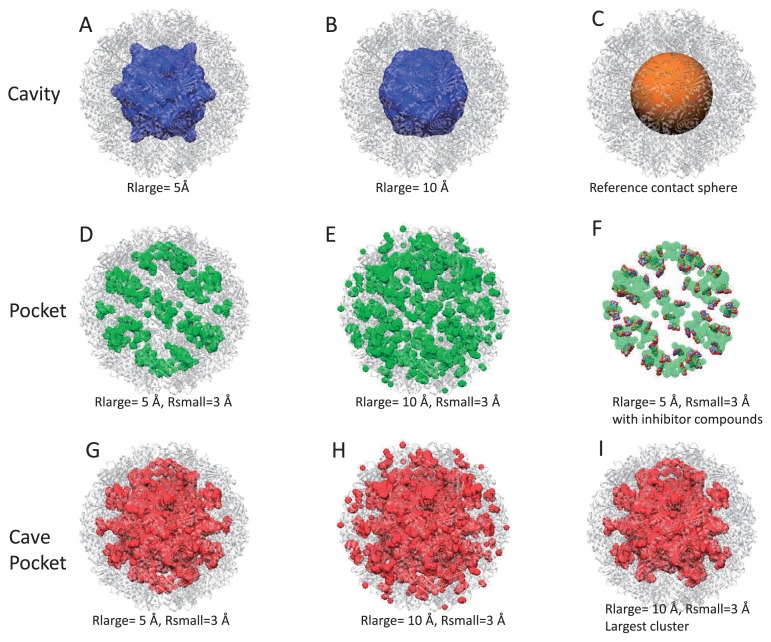
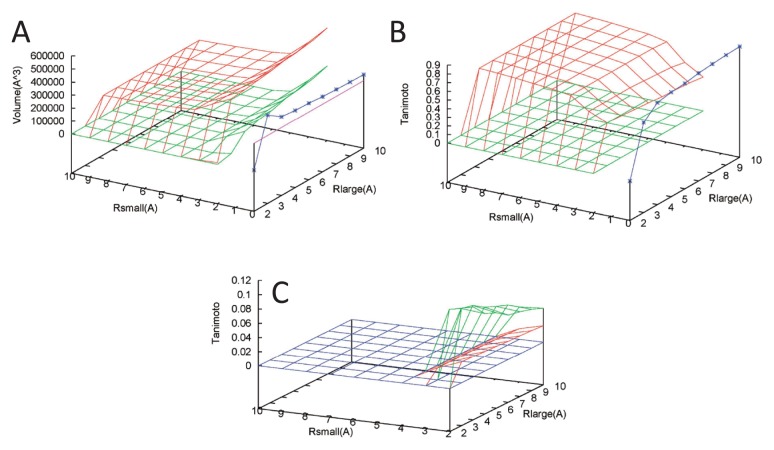
We introduced a simple reference contact sphere, with one sphere in the center of the molecule (Fig. 7C). Its radius was determined as the distance from the center to the vdW surface of the closet atom. We also employed the 60 inhibitor compounds (RDL) as a reference (Fig. 7F). In this part of the study, we employed a finer grid width of 1 Å to characterize the details of the surface. The plots for the volume and Tanimoto index demonstrated that the pockets exhibited very poor matches with the reference contact sphere, while the cavity and the cave pocket exhibited high matches (Fig. 8B). Nevertheless, the pockets had a high correlation with the binding inhibitors, as shown in Figure 7F and Figure 8C. Comparing the cavity and the cave pocket for the same Rlarge value, we found that the cave pockets had a more detailed internal surface, if their Rsmall was not excessively large. For example, by comparing the cavity with Rlarge=5 Å (Fig. 7A) and the cave pocket with Rlarge=5 Å and Rsmall=3 Å (Fig. 7G), we found that the latter exhibited a more detailed internal surface, presenting small holes to the outside. This result is due to the fact that cave pockets have two parameters, Rlarge for the sea-level, and Rsmall for the hypothetical bounding atoms, whereas cavities have only one parameter (Rlarge). It is important to note that cave pockets with relatively large Rlarge values tend to have small pockets on the external surface, as shown in Figure 7H. These small pockets can be removed by extracting the largest cluster of cave pockets (Fig. 7I).
Figure 7.
Cavities, pockets and cave pockets for lumazine synthase (PDB ID: 1nqu) with a grid width of 1 Å. (A) and (B). Cavities with Rlarge=5 Å (A) and Rlarge=10 Å (B). (C) a reference contact sphere. (D) and (E) Kawabata-Go pockets using with Rlarge=5 Å and Rsmall=3 Å (D), and Rlarge=10 Å and Rsmall=3 Å (E). (F) Kawabata-Go pockets using Rlarge=5 Å and Rsmall=3 Å with the 60 reference inhibitor compounds (RDL). (G) and (H) Cave pockets using with Rlarge=5 Å and Rsmall=3 Å (G) and Rlarge=10 Å and Rsmall=3 Å (H). (I) The largest cluster of cave pocket using Rlarge=10 Å and Rsmall=3 Å.
Figure 8.
Volumes and Tanimoto index for lumazine synthase (PDB ID: 1nqu). Blue, green, and red lines correspond to cavity, pocket, and cave pocket, respectively. (A) Volume (Å3) versus Rsmall (Å) and Rlarge (Å). The purple line corresponds to the volume of the reference contact sphere. (B) Tanimoto index for the reference contact sphere versus Rsmall (Å) and Rlarge (Å). The highest Tanimoto value is 0.825, which is provided by a cavity with Rlarge=10 Å (Fig. 7B). (C) Tanimoto index for the 60 inhibitor compounds (RDL) versus Rsmall (Å) and Rlarge (Å). The highest Tanimoto value is 0.105, which is provided by pockets with Rlarge=3 Å and Rsmall=2 Å.
Calculations for a large dataset of assemblies
We calculated cavities, pockets and cave pockets for a dataset consisting of 1,480 macromolecular structures. The dataset was prepared by the following three steps. First, the representative protein chain list was downloaded from the HOMCOS server [25]. The list was generated from the 2019/06/12 version of PDB, and was calculated using the single linkage clustering with a BLAST E-value of 1.0−4 as the threshold. It contained 28,906 non-redundant protein chains. Second, all of the assemblies (biological units) with assembly_id=1 were extracted containing one of the representative chains; NMR structures were excluded. In this step, 14,799 assemblies (biological units) were extracted, and protein-nucleotide complexes, such as ribosomes, were included in the list. Third, the extracted assemblies were sorted by the lexicographic order of their PDB IDs, then every 10 assemblies were extracted. Finally, 1,480 representative assemblies were obtained. The list of the 1,480 assemblies is available as Supplementary Table S1.
For the 1,480 representative assemblies, we calculated cavities, pockets, and cave pockets using a grid width=2.0 Å, Rlarge=10, 15, 20, and 25 Å, and Rsmall=5 and 10 Å. All of the atoms (ATOM lines) of the protein and nucleotide chains in each assembly were regarded as target molecules, other atoms (HETATM lines) were ignored. Table 1 summarizes the number of assembly structures with cavities, pockets, and cave pockets. Cavities were detected in only a few assemblies (11–56 out of 1,480). The larger Rlarge values provided smaller numbers of structures with cavities, and larger numbers of structures with pockets and cave pockets. Furthermore, smaller Rsmall values generated a larger numbers of structures with pockets and cave pockets. These trends are reasonable in view of the definition of these spaces. Table 1 also shows that no pocket was found when Rlarge=Rsmall=10 Å. This is due to the relationship specified in Eq. 12—if probe S is not smaller than probe P, then the pocket is empty.
Table 1.
Numbers of assembly structures with identified cavities, pockets, and cave pockets among the 1,480 representative structures
| Rlarge | Cavity | Rsmall=5 Å | Rsmall=10 Å | ||
|---|---|---|---|---|---|
|
|
|
||||
| CavePocket | CavePocket | ||||
| 10 Å | 56 | 270 | 274 | 0 | 37 |
| 15 Å | 26 | 438 | 441 | 45 | 63 |
| 20 Å | 14 | 566 | 566 | 66 | 73 |
| 25 Å | 11 | 671 | 671 | 77 | 82 |
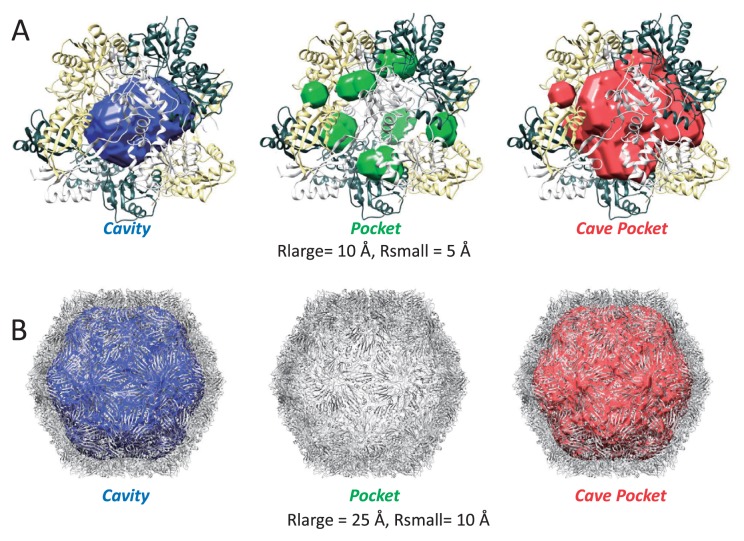
Next, we checked the number of chains (both proteins and nucleotides) in each assembly. Table 2 shows the percentages of structures with identified cavities, pockets and cave pockets, with respect to the number of chains. We show only two cases: a case with small cavities/pockets (Rlarge=10 Å and Rsmall=5 Å), and a case with large cavities/pockets (Rlarge=25 Å and Rsmall=5 Å). Figure 9 shows examples of the cavities, pockets, and cave pockets for these two cases. We found a strong correlation between these cases in Table 2—an assembly with a large number of chains tends to have more cavities, pockets, and cave pockets. In particular, no cavity was found in any of the single-chain structures using Rlarge=10, 15, 20, or 25 Å.
Table 2.
Percentage of assembly structures with identified cavities, pockets, and cave pockets based on number of chains
| Number of chains | Number of structures | Rlarge=10 Å, Rsmall=5 Å | Rlarge=25 Å, Rsmall=10 Å | ||||
|---|---|---|---|---|---|---|---|
|
|
|
||||||
| Cavity (%) | Pocket (%) | Cave Pocket (%) | Cavity (%) | Pocket (%) | Cave Pocket (%) | ||
| 1 | 353 | 0.0 | 4.8 | 4.8 | 0.0 | 0.3 | 0.3 |
| 2 | 589 | 0.7 | 12.7 | 12.7 | 0.0 | 1.4 | 1.4 |
| 3 | 209 | 2.4 | 17.2 | 17.2 | 0.0 | 3.3 | 3.3 |
| 4 | 142 | 1.4 | 25.4 | 25.4 | 0.0 | 2.8 | 2.8 |
| 5 | 26 | 7.7 | 30.8 | 30.8 | 0.0 | 3.8 | 3.8 |
| 6 | 56 | 14.3 | 51.8 | 51.8 | 0.0 | 21.4 | 21.4 |
| 7–11 | 47 | 4.3 | 46.8 | 48.9 | 0.0 | 19.1 | 19.1 |
| 12–29 | 34 | 35.3 | 79.4 | 79.4 | 2.9 | 50.0 | 50.0 |
| 30–59 | 13 | 76.9 | 84.6 | 92.3 | 23.1 | 92.3 | 92.3 |
| 60–960 | 11 | 100.0 | 81.8 | 100.0 | 63.6 | 54.5 | 100.0 |
Figure 9.
Several examples of cavities, pockets and cave pockets among the 1,480 representative assemblies. (A) Crystal structure of Staphylococcus aureus hypothetical protein SA1388 (PDB ID: 2nyd, assembly=1, 6 chains). Calculations were performed using a grid width=2 Å, Rlarge=10 Å and Rsmall=5 Å. (B) Tobacco necrosis virus (PDB ID: 1c8n, assembly=1, 60 chains). Calculations were performed using a grid width=2 Å, Rlarge=25 Å, and Rsmall=10 Å. No pocket was found for this assembly.
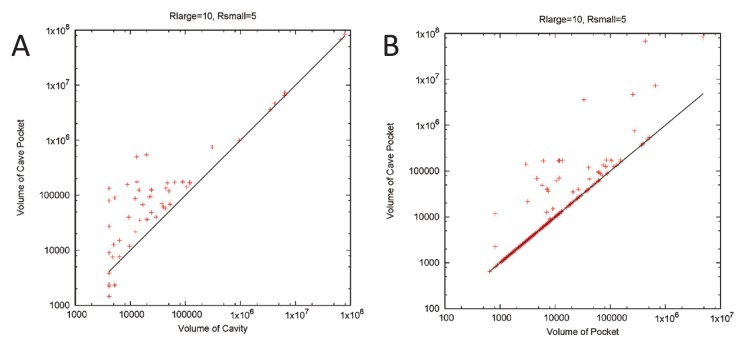
We also checked the volumes of cavities, pockets, and cave pockets for the 1,480 assemblies. We only show a case for small cavities/pockets (Rlarge=10 Å and Rsmall=5 Å) in Figure 10. A plot of the cavity volume and cave pocket volume is shown in Figure 10A. Generally speaking, the volume of the cave pockets was equal to or larger than that of the cavities. Among the 1,480 assemblies, the volumes of cavities are equal to those of cave cavities in 1218 assemblies; 268 assemblies had larger cave cavities than cavities, whereas only 10 assemblies had larger cavities than cave pockets. This tendency was consistent with the cases of GroEL/ES and LS. A plot comparing pocket volume and cave pocket volume is shown in Figure 10B. As the theory predicted, the volume of cave pockets was equal to or larger than that of pockets.
Figure 10.
Volume plots for the 1,480 representative assemblies. The calculations were performed with grid width=2 Å, Rlarge=10 Å, and Rsmall=5 Å. (A) Plot for the cavity volume and cave pocket volume. (B) Plot for the pocket volume and cave pocket volume.
Calculations for a dataset of single chains bound to small molecules
We also evaluated the performance of cave pockets for a dataset of single chains bound to small molecules. Kawabata, T. (2010) used 1,817 representative chains based on the 40% representative list of SCOP 1.73 by extracting the chains bound to “proper” small molecules [4]. In this study, each of the 1,817 chains was checked in the current PDB database. From this analysis, 29 chains were not regarded as bounders to proper small molecules by the asym_id definition of molecules; most of them had polynucleotides with non-standard nucleotides, and four chains were obsoleted from the PDB. Finally, we obtained a list of 1,784 representative chains with small compounds. The list of the 1,784 chains is available as Supplementary Table S2.
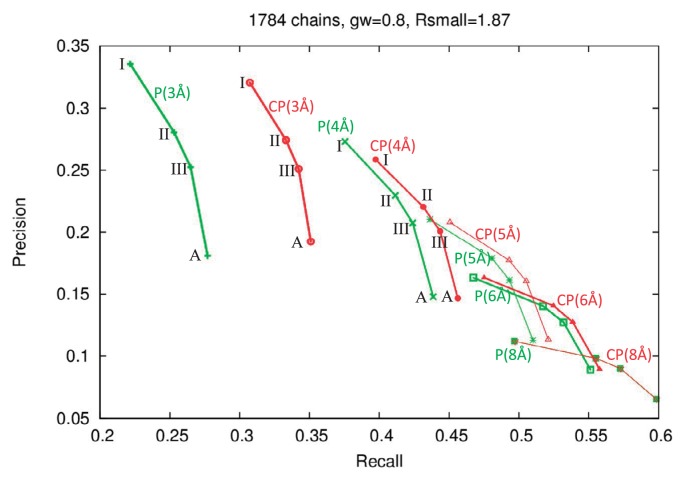
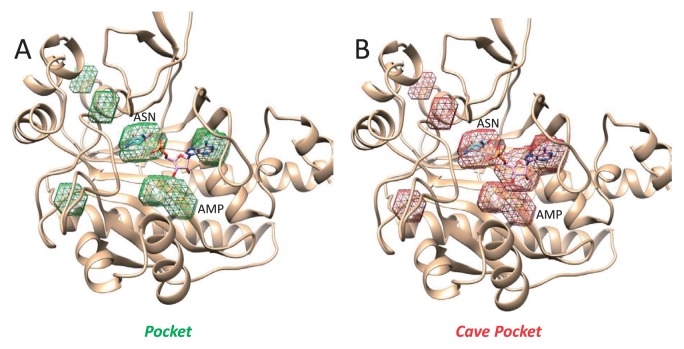
We calculated cavities, pockets and cave pockets for the 1,784 chains, using the same conditions used by Kawabata, T. (2010): grid width=0.8 Å, Rsmall=1.87 Å, and Rlarge=3, 4, 5, 6 and 8 Å. The numbers of chains having cavities among the 1,784 chains are shown in Table 3. Fewer cavities were found using larger Rlarge; the number of chains having cavities with Rlarge=3.0 Å, was 670, whereas the number with Rlarge=8.0 Å was 13. The performances of binding site predictions were evaluated through recall-precision plots, as shown in Figure 11. We only show the plots for pockets and cave pockets because the prediction performances of the cavities were quite poor. Generally, the curves of pockets and cave pockets were similar, except for the curves with Rlarge=3.0 Å and 4.0 Å. In particular, the cave pocket with Rlarge=3.0 Å resulted in higher recall values than the pocket with the same Rlarge. These results are consistent with those reported by Manak, M. (2019). Figure 12 shows an example of the 3D structures of pockets and cave pockets, that produced a higher recall value.
Table 3.
Numbers of chains having cavities, pockets, and cave pockets among the 1,784 representative chains
| Rlarge | 3 Å | 4 Å | 5 Å | 6 Å | 8 Å |
|---|---|---|---|---|---|
| Cavity | 670 | 270 | 89 | 34 | 13 |
| 1741 | 1772 | 1781 | 1784 | 1784 | |
| Cave Pocket | 1741 | 1772 | 1781 | 1784 | 1784 |
Figure 11.
Recall-precision plot for the prediction of ligand-binding pockets by pockets and cave pockets. The 1,784 representative chains were used. The green and red lines correspond to pockets and cave pockets, respectively. The labels “I”, “II”, “III” and “A” correspond to the results using the largest cluster, the two largest clusters, the three largest clusters, and all pocket clusters. The lines labeled “P(3 Å)”, “P(4 Å)”, “P(5 Å)”, “P(6 Å)”, and “P(8 Å)” correspond to the results of pockets with Rlarge=3, 4, 5, 6 and 8 Å, respectively. Similarly, the lines labeled “CP(3 Å)”, “CP(4 Å)”, “CP(5 Å)”, “CP(6 Å)”, and “CP(8 Å)” correspond to the results of cave pockets with Rlarge=3, 4, 5, 6 and 8 Å, respectively.
Figure 12.
Pockets (A) and cave pockets (B) of asparagine synthetase (PDB ID: 12as, chain A), used as an example among the 1,784 representative chains. The structure has two ligands: AMP and ASN. Calculations were performed using a grid width=0.8 Å, Rlarge=3 Å and Rsmall=1.87 Å. The pockets produce a recall=0.448529 and precision= 0.306841, whereas the cave pockets produce a recall=0.745588 and precision=0.394860. The sugar in the AMP was covered only by the cave pockets.
Comparison with CAVER Analyst
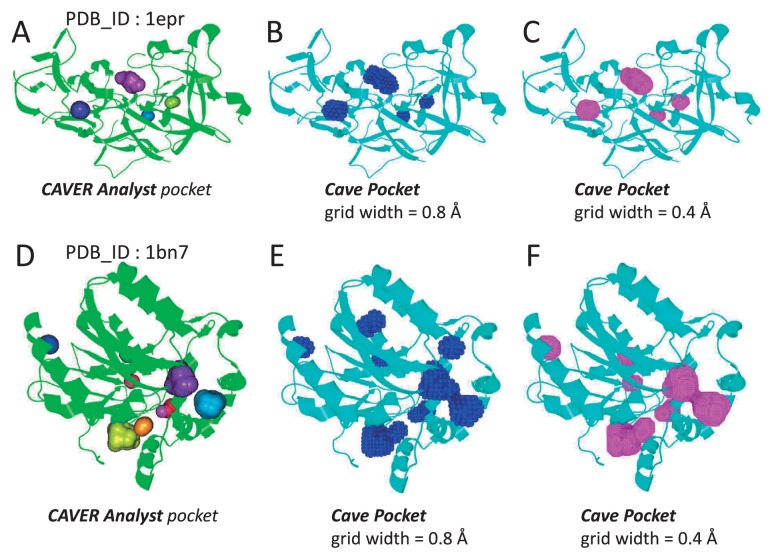
To validate our implementation of cave pockets, we compared our results with the pockets calculated by the program CAVER Analyst [26]. The CAVER Analyst version 2.0 beta includes a function to calculate cavities and pockets defined by Manak M. [18]. The definition of the Manak pocket is identical to our cave pocket, however, CAVER Analyst employs a Voronoi-based method using the sphere representation of molecules and probes. Because CAVER Analyst did not allow us to download calculated pockets, we visually compared our calculated pockets for two proteins (PDB ID: 1epr and 1bn7). We used Rlarge=3.0 Å and Rsmall=1.87 Å, and two different grid widths (0.8 Å and 0.4 Å). For this comparison, GHECOM used the radius parameters proposed by Bondi, A. (1964) [27]. Figure 13 shows that CAVER Analyst and GHECOM generated very similar pockets, although the GHECOM pockets for 1bn7 with 0.8 Å grid width were slightly different from those produced by CAVER Analyst. The correspondences between the pockets calculated by the sphere and grid representations suggest that GHECOM has been properly implemented. High correspondences required a sufficiently small grid width. For these two cases, the grid width should be less than about 0.4 Å.
Figure 13.
Comparisons of cave pockets using CAVER Analyst and those using GHECOM. Endothia aspartic proteinase (PDB ID: 1epr; (A), (B), (C)) and haloalkane dehalgenase (PDB ID: 1bn7; (D), (E), (F)) were used for calculation. Cave pockets were defined with Rlarge=3.0 Å and Rsmall=1.87 Å. (A), (D): pockets calculated by CAVER Analyst 2.0 beta. (B), (E): cave pockets calculated by GHECOM with grid width=0.8 Å. (C), (F): cave pockets calculated by GHECOM with grid width=0.4 Å. The graphics were generated by the CAVER Analyst program. The grid points of the GHECOM cave pockets are displayed as ball-and-stick models.
Concluding Remarks
In this study, we extended the definition of the Kawabata-Go pocket, with the help of the work of Manak, M. (2019); the resulting space was named as a “cave pocket.” A cavity was also defined using mathematical morphology. We proved that a cave pocket includes a pocket, and it is equal to a pocket if no cavity is found. The calculation of these geometric features for various molecules shows that the cave pocket is more suitable than the pocket to find a large internal hole, and can represent more detailed internal surface than can a cavity. We also found macromolecules with more chains tend to have more cavities, pockets, and cave pockets. To find the binding pockets of small molecules, the cave pockets with Rlarge=3.0 Å produced higher recall values than the pockets with the same Rlarge. The choice of the two radii Rlarge and Rsmall was found to be critical to describe these geometric features, as different radii often provided diverse cavities and pockets. If our program is applied to various molecules, we recommend testing several different radii, considering the sizes of the target macromolecule and hypothetical binding molecules. Because GHECOM employs a grid representation, its results will include errors caused by digitalization. Smaller grid widths increase the computation times and achieve higher accuracy, as shown in Figure 13. To avoid the digitalization error, we recommend using as small a grid width as possible, depending on the computing power of the machine running the calculation. The biological and physical roles of the large internal cavities in many macromolecules are still unknown. We hope that the tools we have developed will be useful in future research applied to discovering further biophysical aspects of macromolecular cavities and pockets.
Supplementary Material
Acknowledgements
I appreciate Prof. Nobuhiro Go’s willingness to work with me in our first pocket study, and for giving me the opportunity to research the geometrical features of protein structure. This work was mainly supported by JSPS KAKENHI Grantin- Aid for Scientific Research (C), Grant Numbers 17K07364. This work was also partially supported by the Platform Project for Supporting in Drug Discovery and Life Science Research (Platform for Drug Discovery, Informatics, and Structural Life Science) from the Japan Agency for Medical Research and Development (AMED) under Grant Number JP19am0101066.
Appendix.
Basic operations in mathematical morphology
Shown here are the basic operations of the mathematical morphology applied to the 3D Euclidian space E3 for a symmetrical structuring element. Schematic views of these operations are shown in Figure 1, and its details are provided in a tutorial [5] and a text book [6].
| (A1) |
where E3 is the 3-dimensional Euclidian space.
| (A2) |
| (A3) |
| (A4) |
| (A5) |
| (A6) |
| (A7) |
| (A8) |
| (A9) |
In order to identify cavities and cave pockets, the calculation Xc⊝P is important. However, because Xc includes the boundary of the image, the standard erosion yields an unnaturally shrinking shape around the boundary region. To avoid this issue, the bounded erosion ⊝̇ must be used instead of the standard erosion ⊝:
| (A10) |
where V[X] is a view of binary image X, which is a bounded box region such that X and all operations concerning X are confined to that region (Fig. 3C). See Dougherty & Lotufo (2003) for the details of the bounded operators [6].
Basic relationships of morphological operations
Shown below are several basic relationships used in mathematical morphology to define the relationships for cavities, pockets and cave pockets. Proofs for these relationships are provided in a tutorial [5].
| (A11) |
| (A12) |
| (A13) |
| (A14) |
| (A15) |
| (A16) |
| (A17) |
| (A18) |
| (A19) |
| (A20) |
| (A21) |
| (A22) |
Proof that if S is not smaller than P, then the pocket is empty
We wish to prove Eq. 12 in the main manuscript, restated here.
| (12) |
If both S and P have spherical shapes, the relationship S⊇P implies the followings:
| (A23) |
where T is another spherical probe. The Kawabata-Go pockets defined in Eq. 10 of the main manuscript is converted as follows.
| (A24) |
We only focus on the term ((X•P)∩Xc)⊝S. This term is converted using Eq. A19.
| (A25) |
The first term in Eq. A25 is further converted using Eq. A19 and Eq. A12 as follows.
| (A26) |
The second term in Eq. A25 is further converted using Eq. A19 as follows.
| (A27) |
Combining Eqs. A26 and A27, we can convert Eq. A25 as follows:
| (A28) |
where Z=Xc⊝P. Because Zc∩Z=φ, and applying the antiextensive rule of erosion (Eq. A22), then Eq. A28 is proven to be empty.
| (A29) |
Combining Eq. A29 and A24, we prove that the pocket is empty.
| (A30) |
Therefore, we have proven Eq. 12 in the main manuscript.
Proof that the cave pocket includes the Kawabata-Go pocket
As Cout[Xc⊝P] is a part of Xc⊝P, a following relationship is obtained.
| (A31) |
This relationship is conserved even after the dilation by P; thus, using Eq. A17,
| (A32) |
Using the definition of opening (Eq. A4) and the duality relationship (Eq. A13), the relationship given by Eq. A32 is described as
| (A33) |
The complement of Eq. A33 is
| (A34) |
The intersection of Eq. A34 and Xc provides the following relationship.
| (A35) |
As erosion and dilation are increasing (Eqs. A17 and A18), the opening operation by S is also increasing.
| (A36) |
From De Morgan’s law (Eq. A9), Eq. A36 can be modified as follows.
| (A37) |
Then, from Eqs. A37 and 17, we have proven the relationship stated by Eq. 23 below.
| (23) |
Proof that the cave pocket is equal to the pocket if no cavity is found
Considering the definition of the cavity in Eq. 7 of the main manuscript, and that among K components, at least one component Ck[(X•P)c⊝P] should have access to the outside, we can state that if the cavity in Eq. 7 is null, then the number of connected components K for (X•P)c⊝P must be equal to 1. In other words, if K=1, the connected component C1[(X•P)c⊝P] has access to the outside, so no inside component is found.
| (A38) |
Substituting Cout[(X•P)c⊝P] in Eq. 20 with (X•P)c⊝P, we obtain the following relationship.
| (A39) |
To obtain this, we used the definition of opening (Eq. A4), P-dilated shape is P-open (Eq. A15), and apply the duality relationship (Eq. A14). As such, we have shown that if no cavity for the large probe P is found around the molecule X, then the cave pocket is identical to the pocket, stated by Eq. 24 in the main manuscript.
| (24) |
Footnotes
Conflicts of Interest
T. K. declares that he has no conflicts of interest.
Author Contribution
T. K. developed the theory and the software program, carried out the calculations, and wrote the manuscript.
References
- 1.Simões T, Lopes D, Dias S, Fernandes F, Pereira J, Jorge J, et al. Geometric detection algorithms for cavities on protein surfaces in molecular graphics: A survey. Comput Graph Forum. 2017;36:643–683. doi: 10.1111/cgf.13158. [DOI] [PMC free article] [PubMed] [Google Scholar]
- 2.Krone M, Kozlíková B, Lindow N, Baaden M, Baum D, Parulek J, et al. Visual analysis of biomolecular cavities: state of the art. Comput Graph Forum. 2016;35:527–551. [Google Scholar]
- 3.Kawabata T, Go N. Detection of pockets on protein surfaces using small and large probe spheres to find putative ligand binding sites. Proteins. 2007;68:516–529. doi: 10.1002/prot.21283. [DOI] [PubMed] [Google Scholar]
- 4.Kawabata T. Detection of multiscale pockets on protein surfaces using mathematical morphology. Proteins. 2010;78:1195–1211. doi: 10.1002/prot.22639. [DOI] [PubMed] [Google Scholar]
- 5.Haralick RM, Sternberg SR, Zhuang X. Image analysis using mathematical morphology. IEEE Trans Pattern Anal Mac Intell. 1987;9:532–548. doi: 10.1109/tpami.1987.4767941. [DOI] [PubMed] [Google Scholar]
- 6.Dougherty ER, Lotufo RA. Hands-on morphological image processing. SPIE; Publications, USA: 2003. [Google Scholar]
- 7.Masuya M, Doi J. Detection and geometric modeling of molecular surfaces and cavities using digital mathematical morphological operations. J Mol Graph. 1995;13:331–336. doi: 10.1016/0263-7855(95)00071-2. [DOI] [PubMed] [Google Scholar]
- 8.Delaney JS. Finding and filling protein cavities using cellular logic operations. J Mol Graph. 1992;10:174–177. doi: 10.1016/0263-7855(92)80052-f. [DOI] [PubMed] [Google Scholar]
- 9.Ho BK, Gruswitz F. HOLLOW: generating accurate representations of channel and interior surfaces in molecular structures. BMC Struct Biol. 2008;8:49. doi: 10.1186/1472-6807-8-49. [DOI] [PMC free article] [PubMed] [Google Scholar]
- 10.Ito J, Tabei Y, Shimizu K, Tsuda K, Tomii K. PoSSuM: a database of similar protein-ligand binding and putative pockets. Nucleic Acids Res. 2012;40:D541–D548. doi: 10.1093/nar/gkr1130. [DOI] [PMC free article] [PubMed] [Google Scholar]
- 11.Ishida H. Essential function of the N-termini tails of the proteasome for the gating mechanism revealed by molecular dynamics simulations. Proteins. 2014;82:1985–1999. doi: 10.1002/prot.24553. [DOI] [PubMed] [Google Scholar]
- 12.Kawabata T, Oda M, Kawai F. Mutational analysis of cutinase-like enzyme, Cut190, based on the 3D docking structure with model compounds of polyethylene terephthalate. J Biosci Bioeng. 2017;124:28–35. doi: 10.1016/j.jbiosc.2017.02.007. [DOI] [PubMed] [Google Scholar]
- 13.Richards FM. Areas, volumes, packing, and protein structure. Annu Rev Biophys Bioeng. 1977;6:151–176. doi: 10.1146/annurev.bb.06.060177.001055. [DOI] [PubMed] [Google Scholar]
- 14.Connolly ML. Solvent-accessible surfaces of proteins and nucleic acids. Science. 1983;221:709–713. doi: 10.1126/science.6879170. [DOI] [PubMed] [Google Scholar]
- 15.Kim JK, Cho Y, Laskowski RA, Ryu SE, Sugihara K, Kim DS. BetaVoid: molecular voids via beta-complexes and Voronoi diagrams. Proteins. 2014;82:1829–1849. doi: 10.1002/prot.24537. [DOI] [PubMed] [Google Scholar]
- 16.Rashin AA, Iofin M, Honig B. Internal cavities and buried waters in globular proteins. Biochemistry. 1986;25:3619–3625. doi: 10.1021/bi00360a021. [DOI] [PubMed] [Google Scholar]
- 17.Hubbard SJ, Gross KH, Argos P. Intramolecular cavities in globular proteins. Protein Eng. 1994;7:613–626. doi: 10.1093/protein/7.5.613. [DOI] [PubMed] [Google Scholar]
- 18.Manak M. Voronoi-based detection of pockets in proteins defined by large and small probes. J Comput Chem. 2019;40:1758–1771. doi: 10.1002/jcc.25828. [DOI] [PubMed] [Google Scholar]
- 19.Manak M. Exploration of empty space among spherical obstacles via additively weighted Voronoi diagram. Comput Graphics Forum. 2016;35:249–258. [Google Scholar]
- 20.Manak M, Jirkovsky L, Kolingerova I. Interactive analysis of Connolly surfaces for various probes. Comput Graphics Forum. 2017;36:160–172. [Google Scholar]
- 21.Chothia C. The nature of the accessible and buried surfaces in proteins. J Mol Biol. 1976;105:1–12. doi: 10.1016/0022-2836(76)90191-1. [DOI] [PubMed] [Google Scholar]
- 22.Pettersen EF, Goddard TD, Huang CC, Couch GS, Greenblatt DM, Meng EC, et al. UCSF Chimera—a visualization system for exploratory research and analysis. J Comput Chem. 2004;25:1605–1612. doi: 10.1002/jcc.20084. [DOI] [PubMed] [Google Scholar]
- 23.Xu Z, Horwich AL, Sigler PB. The crystal structure of the asymmetric GroEL-GroES-(ADP)7 chaperonin complex. Nature. 1997;388:741–750. doi: 10.1038/41944. [DOI] [PubMed] [Google Scholar]
- 24.Zhang X, Meining W, Cushman M, Haase I, Fischer M, Bacher A, et al. A structure-based model of the reaction catalyzed by lumazine synthase from Aquifex aeolicus. J Mol Biol. 2003;328:167–182. doi: 10.1016/s0022-2836(03)00186-4. [DOI] [PubMed] [Google Scholar]
- 25.Kawabata T. HOMCOS: an update server to search and model complex 3D structures. J Struct Funct Gennomics. 2016;17:83–99. doi: 10.1007/s10969-016-9208-y. [DOI] [PMC free article] [PubMed] [Google Scholar]
- 26.Jurcik A, Bednar D, Byska J, Marques SM, Furmanova K, Daniel L, et al. CAVER Analyst 2.0: analysis and visualization of channels and tunnels in protein structures and molecular dynamics trajectories. Bioinformatics. 2018;34:3586–3588. doi: 10.1093/bioinformatics/bty386. [DOI] [PMC free article] [PubMed] [Google Scholar]
- 27.Bondi A. Van der Waals volumes and radii. J Phys Chem. 1964;68:441–451. [Google Scholar]
Associated Data
This section collects any data citations, data availability statements, or supplementary materials included in this article.


