. 2019 Dec 23;8:e51163. doi: 10.7554/eLife.51163

Figure 4. Altered ARIH1, UBE2D3, and/or UBE2R2 levels result in substantial differences in both the fraction of substrate converted to product as well as the average number of ubiquitins in poly-ubiquitin chains.

Single-encounter ubiquitylation reactions were initiated with either ARIH1, UBE2D3, or UBE2R2 alone or relevant combinations at estimated cellular levels (middle panel). The same reactions were also performed with either a 2- or 4-fold reduction in the enzyme levels (left panel), or 2- or 4-fold greater levels (right panel). All reactions were performed in duplicate technical replicates. Figure 4—figure supplement 1 provides graphs of the relative frequencies for the distribution of unmodified substrate and products. The enzyme concentrations have been provided in Supplementary file 2.

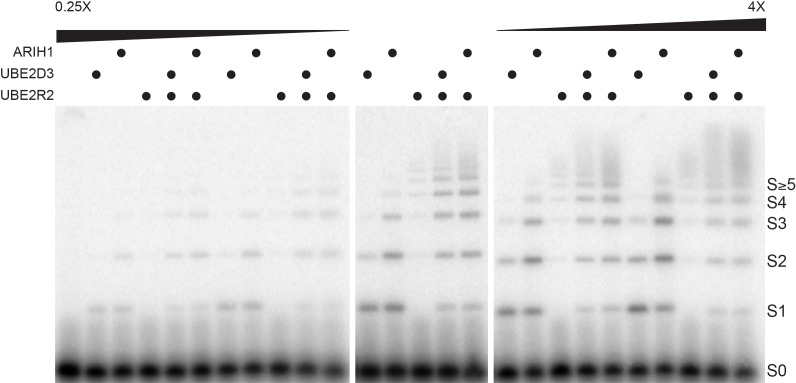
Figure 4.

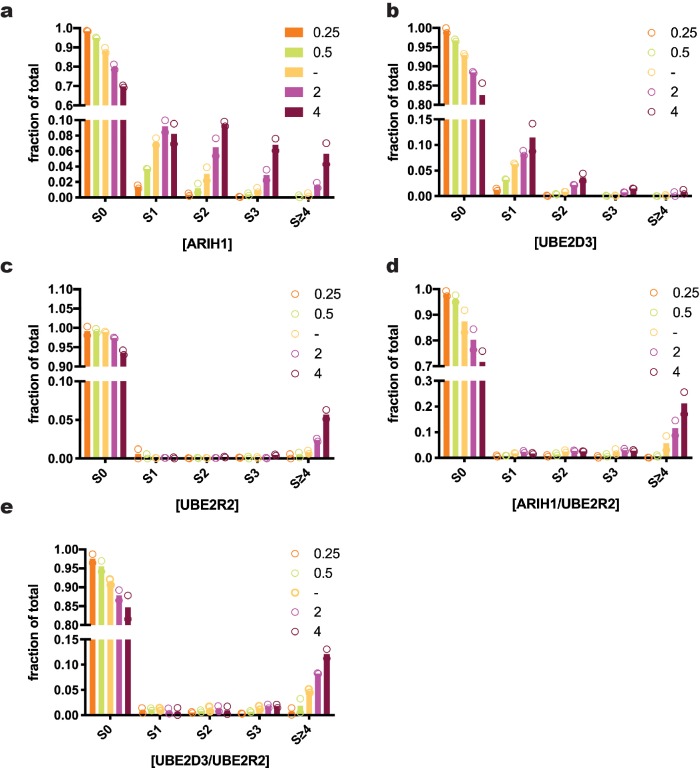
Figure 4—figure supplement 1. Modest changes to ARIH1, UBE2D3, and/or UBE2R2 levels result in substantial differences in both the fraction of substrate converted to products as well as the average number of ubiquitins in poly-ubiquitin chains.

Figure 4—figure supplement 1.

(a) Quantitation of the fractions of substrate (S0) and all products from the single-encounter reactions in Figure 4 containing varying amounts of ARIH1 protein. The mid-range level was near physiological (Table 2). (b) Same as in (a), except with UBE2D3. (c) Same as in (a), except with UBE2R2. (d) Same as in (a), except with both ARIH1 and UBE2R2. (e) Same as in (a), except with both UBE2D3 and UBE2R2. Data points are shown from duplicate technical replicates.
Figure 4—figure supplement 1—source data 1. Replicate data for the graphs shown in Figure 4—figure supplement 1.