Incorporating next‐generation sequencing technology for use in targeted therapies and immunotherapies requires precise validation. This article describes a reliable next‐generation sequencing‐based panel assay, Cancer Sequencing YS panel (CSYS), for detecting genomic alterations.
Keywords: Next‐generation sequencing‐based assay, Targeted therapies and immunotherapies, Long insertion and deletion, Gene rearrangement, Tumor mutational burden, Microsatellite instability
Abstract
Background.
Incorporation of next‐generation sequencing (NGS) technology into clinical utility in targeted and immunotherapies requires stringent validation, including the assessment of tumor mutational burden (TMB) and microsatellite instability (MSI) status by NGS as important biomarkers for response to immune checkpoint inhibitors.
Materials and Methods.
We designed an NGS assay, Cancer Sequencing YS panel (CSYS), and applied algorithms to detect five classes of genomic alterations and two genomic features of TMB and MSI.
Results.
By stringent validation, CSYS exhibited high sensitivity and predictive positive value of 99.7% and 99.9%, respectively, for single nucleotide variation; 100% and 99.9%, respectively, for short insertion and deletion (indel); and 95.5% and 100%, respectively, for copy number alteration (CNA). Moreover, CSYS achieved 100% specificity for both long indel (50–3,000 bp insertion and deletion) and gene rearrangement. Overall, we used 33 cell lines and 208 clinical samples to validate CSYS's NGS performance, and genomic alterations in clinical samples were also confirmed by fluorescence in situ hybridization, immunohistochemistry, and polymerase chain reaction (PCR). Importantly, the landscape of TMB across different cancers of Chinese patients (n = 3,309) was studied. TMB by CSYS exhibited a high correlation (Pearson correlation coefficient r = 0.98) with TMB by whole exome sequencing (WES). MSI measurement showed 98% accuracy and was confirmed by PCR. Application of CSYS in a clinical setting showed an unexpectedly high occurrence of long indel (6.3%) in a cohort of tumors from Chinese patients with cancer (n = 3,309), including TP53, RB1, FLT3, BRCA2, and other cancer driver genes with clinical impact.
Conclusion.
CSYS proves to be clinically applicable and useful in disclosing genomic alterations relevant to cancer target therapies and revealing biomarkers for immune checkpoint inhibitors.
Implications for Practice.
The study describes a specially designed sequencing panel assay to detect genomic alterations and features of 450 cancer genes, including its overall workflow and rigorous clinical and analytical validations. The distribution of pan‐cancer tumor mutational burden, microsatellite instability, gene rearrangement, and long insertion and deletion mutations was assessed for the first time by this assay in a broad array of Chinese patients with cancer. The Cancer Sequencing YS panel and its validation study could serve as a blueprint for developing next‐generation sequencing‐based assays, particularly for the purpose of clinical application.
Introduction
Targeted therapies and immunotherapies as new hallmarks of cancer treatments have been used increasingly in recent years [1], [2], [3], [4]. However, given the wide heterogeneity of genomic abnormalities across and within tumor types, precisely matching a patient to an appropriate treatment turns out to be a pressing need and crucial to the success of the development of targeted and immunotherapies [5], [6]. Accordingly, next‐generation sequencing (NGS)‐based panel sequencing assays, both academic and commercial, have been specially designed and implemented for routine clinical use, including Foundation‐One [1] and Memorial Sloan Kettering‐Integrated Mutation Profiling of Actionable Cancer Targets (MSK‐IMPACT) [7], as well as others [8], [9].
Panel NGS sequencing provides genetic information with higher sensitivity and precision [1], as opposed to routine assays such as polymerase chain reaction (PCR), Sanger sequencing, or fluorescence in situ hybridization (FISH). Immunohistochemistry (IHC) has utility for analyzing protein expression but does not replace sequencing, which can characterize all types of mutations, including single nucleotide variant (SNV), insertion and deletion (indel), copy number alteration (CNA), and gene rearrangement, as well as potential immune checkpoint inhibitor biomarkers such as tumor mutational burden (TMB) or microsatellite instability (MSI). Moreover, with ultradeep coverage, panel sequencing achieves exceptionally high sensitivity and reliability and enables detection of those mutations that are presented in very low prevalence but are potentially important because of their association with drug resistance and disease progression [10].
In recent years, immunotherapy has brought durable benefit for patients with cancer. For PD1 blockade, MSI is an established biomarker for response and TMB has promise for predicting response to the same therapy [11], [12]. Foundation‐One [13] and MSK‐IMPACT [14] assays have reported the landscape of TMB across different cancer types in Western patients; the profiling of TMB for tumors from a large pan‐cancer cohort of Chinese patients is still unavailable. Moreover, MSI derived from panel sequencing also needs to be systematically evaluated against the commonly used gold standard of PCR assays before it can be used as a biomarker for immune checkpoint inhibitors.
Herein we describe an NGS‐based clinical sequencing assay, Cancer Sequencing YS panel (CSYS), with exceptionally high sensitivity, positive predictive value (PPV), and reliability to assess TMB and MSI. Notably, CSYS can detect indels, including long indels (L‐indels) not assessed by other assays. We highlight the actual and potential clinical utilities of CSYS, especially emphasizing our findings of long indels and gene rearrangements in tumors from a large cohort of Chinese patients with cancer.
Materials and Methods
Workflow of CSYS Assay
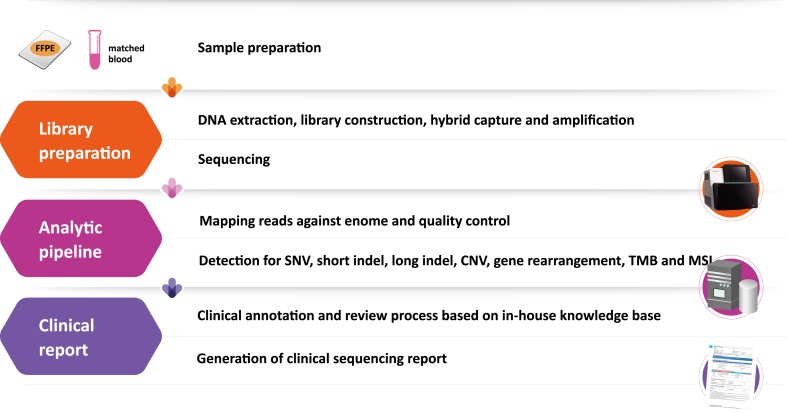
Tumor samples from formalin‐fixed, paraffin‐embedded (FFPE) tissue sections and matched blood specimens from the same patient were collected and extracted to yield 50–250 ng DNA separately, and a library was constructed. Targeted genomic regions were hybrid‐captured, and sequence reads were generated using Illumina (San Diego, CA) instruments. These procedures followed the steps described in [1]. Data quality was inspected and controlled by examining sequencing coverage and uniformity, and a suite of customized bioinformatics pipelines was applied for discovery of SNVs, short and long indels, CNA, gene rearrangement, TMB, and MSI. Finally, all of the detected mutations were compared with our in‐house database of genomic changes specific to clinical annotation. A manual review process was performed to ensure no false positives or mistakes in clinical annotations, including complex variant curation and clinical relevance inference based on our in‐house database. Based on the annotated mutations, a succinct report with relevant references to literature and clinical trials was generated.
Bioinformatics Analysis
The raw sequencing data underwent stringent quality control of read depth and ratio of target capture. All types of genetic alterations, including SNV, short and long indels, CNA and gene rearrangement, were called using a suite of bioinformatics pipelines described in the supplemental online Methods. Moreover, the calculations of TMB and MSI from CSYS data were defined as below.
TMB score was calculated from CSYS data for each sample by counting the number of somatic mutations, including coding SNVs and indels, per megabase (Mb) of the sequence examined. Known somatic mutations in the Catalog of Somatic Mutations in Cancer (COSMIC) and known germline polymorphisms in the U.S. National Center for Biotechnology Information's Single Nucleotide Polymorphism Database (dbSNP) were not counted [13]. The selection and quantification of microsatellite loci (MSLs) was done as previously described [15], [16].
There were 572 MSLs identified in the CSYS‐targeted region as candidate MSI markers. MSI was assessed by three cohorts with an initial cohort of 15 FFPE samples, 6 MMR‐deficient samples, and 9 MMR‐proficient samples, in which 23 selected MSLs were covered by reads with a minimum length of 35 bp and a minimum read quality of 25. In addition, 31 samples (8 MMR‐deficient samples +23 MMR‐proficient samples) were added into the first cohort as a training cohort (n = 15 + 31 = 46), and the resulting predictive model was analyzed by a random forest algorithm in R software and then validated on a third cohort of an additional 56 samples. For further validation, a Microsatellite Analysis for Normal Tumor Instability (MANTIS) algorithm [17] with recommended parameters (mrq = 25, mlq = 30, mlc = 30, mrr = 5) was compared with our method on the same 56 testing samples, using an orthogonal validation of PCR or IHC method as the gold standard to assess the performance of both algorithms. PCR products were analyzed by Sanger sequencing using an ABI 3730 Genetic Analyzer (Thermo Fisher Scientific, Waltham, MA).
Results
Workflow of CSYS Assay and Quality Control
To detect genomic variants and relevant biomarkers from solid tumors, CSYS consisted of a set of specially designed DNA probes (n = 23,660), which targeted all the exons (n = 7,029) of 450 genes (supplemental online Table 1) as well as selected introns (n = 244) from 39 genes. The 450 genes were known to harbor variants that are considered clinically relevant, whereas the 39 genes were frequently identified in gene rearrangements. The typical workflow is summarized in Figure 1 and described in the Materials and Methods section.
Figure 1.
Workflow of the CSYS.
Abbreviations: CSYS, Cancer Sequencing YS panel; FFPE, formalin‐fixed, paraffin embedded tissue sample.
As two key measurements for quality control, the depth and uniformity of coverage by the CSYS assay were examined. Nineteen FFPE samples (supplemental online Table 2A) were randomly selected as representative of routine clinical samples. Non‐PCR duplicate reads (i.e., deduplication reads) were examined for their distributions and used for calculation of coverage uniformity and depth (supplemental online Fig. 1). The overall sequenced positions (n = 2,602,638), COSMIC (version 77, n = 186,802), and hotspot positions (n = 7,568, defined as a subset of COSMIC positions having reported clinical implications) within the targeted regions were found to reach a mean depth of ×1,326, ×1,516, and ×1,139 reads, respectively, with a high uniformity (supplemental online Fig. 1). The other quality control metrics were shown in supplemental online Table 2B. Although mappability scores (defined as 1 ÷ number of matches found in the genome) [18] and guanine‐cytosine content influenced read depth, less than 1% of genes had a read depth less than ×500 in the CSYS assay (i.e., only two genes had ×398 and ×443; supplemental online Fig. 2). Therefore, good uniformity and ×1,000 sequencing coverage on detection of variants with different variant allele frequencies (VAFs) confirmed the good quality control characteristics of CSYS.
Detection and Validation of Variants by CSYS Assay
To test the robustness of CSYS, five classes of genomic alterations and two genomic features of TMB and MSI were validated based on a large number of cell lines and clinical samples. Because of the uncertainty of VAFs on clinical FFPE samples, we used mixed cancer cell lines to build “expected” mutation VAF data sets to test sensitivity and PPV at various levels of VAF. Additionally, 208 clinical FFPE samples were performed to assess the concordant results between NGS and Sanger sequencing, IHC, FISH, or PCR. In terms of performance, here we mainly used sensitivity and PPVs for SNV or indel, and for long indel, CNA and gene rearrangement between NGS and other detection methods including PCR, FISH, and IHC. The performance of validation results was summarized (supplemental online Table 3), and the detailed validation data were described as below.
SNVs and Short Indels
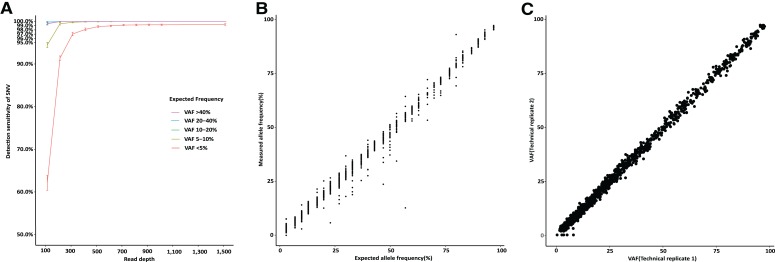
A pair of replicates were constructed from pooling DNA derived from 15 cell lines used in the 1000 Genomes project (supplemental online Table 4A) [19]. The pooled DNA contained 2,501 variants in total, with expected VAFs ranged approximately from 3% to 97% in each pool (supplemental online Table 4B). The expected VAFs were calculated based on known allele frequencies of single nucleotide polymorphisms in each cell line and the mixed samples. The SNVs identified by CSYS were compared with the expected ones with respect to their VAFs. The overall sensitivity and PPV of SNVs were 99.7% and 99.9%, respectively. As shown in Figure 2A, the sensitivity was affected mainly by their VAFs and read depths, with decreasing sensitivity for those with low VAFs (<5%). Calling SNVs with VAFs ≤5% arrived at ≥99.3% sensitivity (1014/1021) when they had at least a median read depth of ×400. Strikingly, sensitivity reached 100% with a minimum read depth of ×400 at varied VAFs (PPV remained as high as 99.9%). Meanwhile, a strong correlation was observed between the expected and measured VAFs (Pearson correlation coefficient r = 0.996; Fig. 2B). There was a high correlation (r = 0.999) for VAFs between the two replicate pools (Fig. 2C).
Figure 2.
The performance of calling single nucleotide variants (SNVs). (A): Sensitivity of calling SNVs versus read depths and VAFs. (B): The comparison between measured allele frequencies and expected allele frequencies as calculated from pooling the standard cell lines. (C): Reproducibility evaluated by two replicates from pooled samples.
Abbreviation: VAF, variant allele frequency.
The performance of CSYS for calling short indels was assessed in a similar way (supplemental online Fig. 3A, 3B, 3C). Seventeen samples derived from pooling DNA from another set of 15 cell lines (supplemental online Methods) with known indels (supplemental online Table 4C and 4D) provided 219 indels of varying lengths (1–36 bp), and the indel VAFs ranged from 2.3% to 50.0% (supplemental online Table 4E). With the read depth of over ×1,000, the overall sensitivity of calling short indel was 100%, whereas the overall PPV was 99.998% across the examined read depths at all ranges of VAFs. The reproducibility of calling indels was also evaluated by creating two replicates for each of the 17 pools (supplemental online Methods). The correlation between the replicates of all 17 pools had a mean r ± SD of 0.90 ± 0.07, and the overall correlation between the two replicates was as high as r = 0.98 (supplemental online Fig. 3C).
In summary, 1,480 out of 1,480 SNVs with VAFs over 5% were successfully detected by CSYS with read depths of over ×400 (sensitivity = 100%) and for indels (n = 173) with the same VAFs range (VAF >5%), the sensitivity reached 100% with a minimum read depths of ×400. False positive calls were rare (less than 0.1%) for SNVs or indels, with PPV of 99.9% and 99.9%, respectively. In practice, for SNVs or indels that had good quality reads and exceptionally high coverage (>×500), we could truly detect those with VAFs as low as 1%. Taken together, with stringent quality control and assurance as well as a rigorous validation process, we can conclude that the CSYS assay reliably calls SNVs and indels.
L‐Indel
As described in the supplemental online Methods, CSYS was able to detect large structural variants including L‐indel and gene rearrangement. For L‐indel, CSYS currently targeted deletions between 50 and 3,000 bp in length as well as insertions between 50 and 3,000 bp in length spanning the exon regions in autosomes. Its performance was evaluated with six known L‐indels from the NA12878 data set (supplemental online Table 5A) [20]. There were three long deletions detected, but all three insertions were missed. These missed insertions were further confirmed by PCR detection. Of note, an additional 15 (12 deletions and 3 insertions) previously unreported L‐indels were detected (supplemental online Table 5B) and successfully confirmed by PCR and Sanger sequencing. Furthermore, the assay detected 29 L‐indels from clinical samples, from either blood or FFPE specimens, and these were confirmed by experimental methods, using capillary electrophoresis or Sanger sequencing with 100% specificity. These L‐indels were detected in exons on the following genes: TP53, FLT3, CDKN2A, PTEN, BRCA2, and SMARCA4 (supplemental online Table 5C). The lengths of these L‐indels varied from 77 to 2,969 bp.
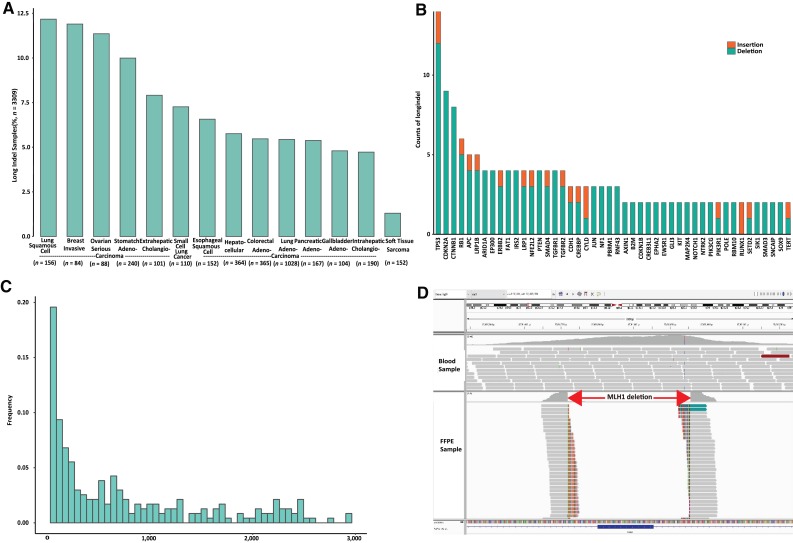
Remarkably, L‐indels occurred with a frequency of 6.3% of tumors from Chinese patients with cancer (n = 3,309), and the frequencies varied among different types of cancers being present, most prominently in lung squamous cell carcinoma, breast invasive ductal carcinoma, and ovarian serous carcinomas (Fig. 3A). L‐indels have been overlooked in most prior genomic studies of human cancers. For example, no L‐indels were reported in results from The Cancer Genome Atlas results, and less than 1% of specimens contained L‐indels in the COSMIC database; these were identified and reported mainly by non‐NGS methods. The distributions of L‐indel in different genes and their lengths, as detected by CSYS, are presented in Figure 3B and 3C, the highest frequencies being found in TP53, CDKN2A, and CTNNB1.
Figure 3.
Long indels (L‐indels) assessed by Cancer Sequencing YS panel. (A): The occurrence distribution of L‐indels for different types of tested cancers (n = 3,309). (B): The distribution of the genes that have been identified with L‐indels. (C): Length distribution for L‐indels calculated from their genomic loci. (D): One example of a long deletion in MLH1 viewed by the bioinformatics tool of Integrated Genomic Viewer (IGV).
Abbreviations: FFPE, formalin‐fixed, paraffin‐embedded; indel, insertion and deletion.
Here we present a clinical case relevant to immunotherapy to validate the clinical implication of L‐indels. One long deletion variant (c.885‐82_1038 + 103del) of the MLH1 gene was identified by the CSYS assay in a 40‐year‐old woman with stage IV hepatic portal cholangiocarcinoma. The length of the deletion was more than 300 bp (Fig. 3D), altering its MutS homologs interaction domain [21]. This patient was determined to be microsatellite instability high by IHC, suggesting potential sensitivity to immune checkpoint inhibitors.
Gene Rearrangement
Another large genomic event is created by gene rearrangement (translocation and inversion). For its detection and validation, 38 FFPE and 2 cell line samples carrying known rearrangements were collected, as shown in supplemental online Table 5D. From these samples, the CSYS assay detected all of the known 38 rearrangement events, encompassing eight cancer driver genes, including ALK fusions (n = 24), NTRK3 fusions (n = 4), RET fusions (n = 3), ROS1 fusions (n = 2), BRAF fusions (n = 2), FGFR2 fusion (n = 1), FGFR3 fusion (n = 1), and NTRK1 fusion (n = 1). Rearrangements were confirmed by FISH or IHC (i.e., 100% specificity). The high performance in detecting gene rearrangement by CSYS was confirmed by the identification of different forms of gene rearrangements, including EML4‐ALK genes, in tumors from a total of 1,300 Chinese patients with lung cancer. CSYS successfully detected 56 different ALK translocations designated as E13‐A20, E6‐A20, and E20‐A20, which are commonly seen in clinical practice.
CNA
The CSYS assay was further assessed for CNA profiling of FFPE samples. We collected 39 FFPE samples that were previously tested by either FISH or IHC, using these results as the gold standard, and found 62 of 65 positive CNAs (including 61 amplifications and 4 deletions). The minimum copy number for calling amplifications was six. We also tested and confirmed 11 negative background samples, covering 11 genes (supplemental online Table 5E). The bioinformatics analyses of CNAs revealed clinical sensitivity of 95.4% (62/65) and PPV of 100% (62/62). For example, the CSYS assay found 6‐fold ERBB2 amplification in a colorectal cancer sample (supplemental online Fig. 4A). Importantly, the reproducibility was examined with two replicates each for 27 additional FFPE samples, which contained 49 amplifications and 3 deletions; the resulting CNAs were found consistent across all of the replicates, and the overall concordance was 0.99 measured by the Pearson correlation coefficient (supplemental online Fig. 4B).
TMB and MSI
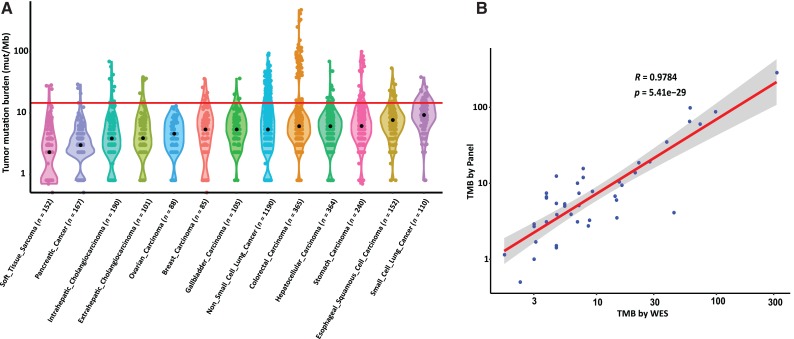
We assayed tumor samples from more than 5,000 Chinese patients, including 24 cancer types, for all types of genetic alterations and further calculated TMB for these samples (Materials and Methods section). For significance, we summarized the TMB for 13 common cancer types with large sample sizes, each with more than 100 specimens. These samples were derived from a total of 3,309 cases (Fig. 4A). The median TMB ranged widely, from 2.3 mutations per Mb in soft tissue sarcoma to 9.3 mutations per Mb in small cell lung cancer. Notable differences between rates of TMB from tumors from Chinese patients with cancer and reported rates from European patients were found in small cell lung cancer (n = 110), which showed the highest median TMB. The quartiles of TMB within each cancer type (supplemental online Table 6) suggest that some proportion of Chinese patients in each tumor type with very high TMB might have a better opportunity to respond to checkpoint immunotherapy [22]. Moreover, the correlation of the CSYS TMB results with the ones from WES, both sequenced on the same physical DNA samples of the same cohort of 42 patients, was shown to be 0.978 (Pearson correlation coefficient r; Fig. 4B). Compared with the previous MSK‐IMPACT report results (r = 0.872, n = 106 in [14]), this high correlation of CSYS and WES results validates the results of TMB based on the CSYS assay.
Figure 4.
The pan‐cancer landscape of TMB and the correlation between WES TMB and Cancer Sequencing YS panel (CSYS) TMB. (A): Violin plots show the distribution of the somatic TMB. The width of each plot indicates the frequency of samples with a given TMB. The red line indicates the threshold for samples with a high mutation burden (top 10%, corresponding to 14.7 mutations per Mb). (B): The correlation between WES TMB (median coverage ∼ × 500) and CSYS TMB on the same DNA library (n = 42).
Abbreviations: mut/Mb, mutations per megabase; TMB, tumor mutational burden; WES, whole exome sequencing.
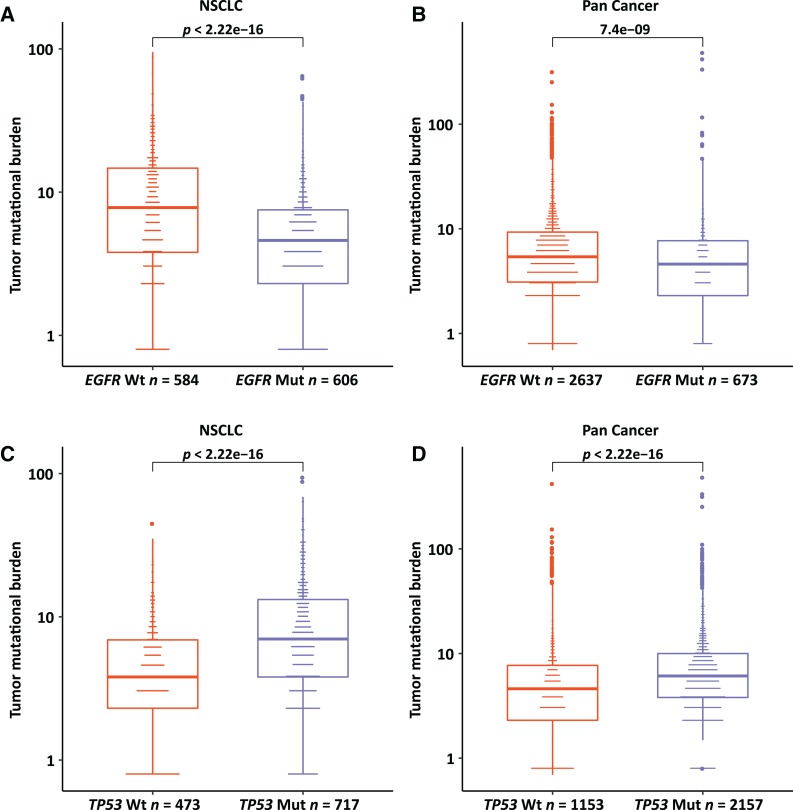
To investigate the impact of gene mutation status on TMB values, we compared the TMB with EGFR and TP53 mutation status. In non‐small cell lung cancer (NSCLC), patients with an EGFR (epidermal growth factor receptor) mutation had significantly lower TMB than those with wild‐type EGFR (p = 2.2e−16; Fig. 5A). Interestingly, this comparison was also true for EGFR mutation versus TMB in all 3,309 pan‐cancer cases (p = 7.4e−9; Fig. 5B). On the contrary, the mutation of TP53 tended to accompany higher TMB in both NSCLC and all pan‐cancer cases (Fig. 5C, 5D).
Figure 5.
The comparisons of EGFR and TP53 with TMB. The mutation of EGFR compared with tumor mutational burden (TMB) in non‐small cell lung cancer (A) and with pan‐cancer TMB (B). The mutation of TP53 compared with TMB in non‐small cell lung cancer (C) and with pan‐cancer TMB (D).
Abbreviations: Mut, mutant; NSCLC, non‐small cell lung cancer; Wt, wild type.
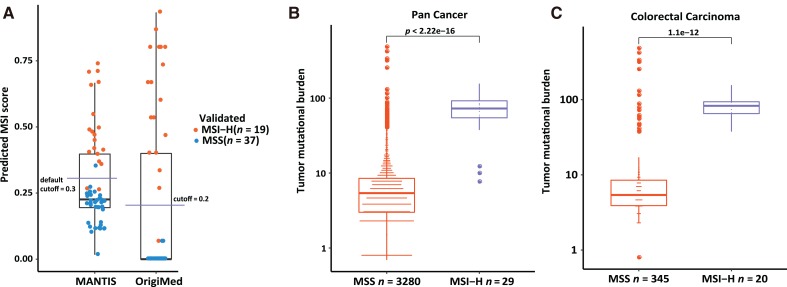
For detection of MSI status, CSYS screened 572 MSLs for their instability status, and a predictive method was developed using a training cohort (n = 46). Its performance in predicting MSI status was evaluated by a validation cohort (n = 56). All validated samples underwent MSI‐PCR or MMR‐IHC testing as the gold standard. As shown in Figure 6A, CSYS achieved 98% accuracy with 95% sensitivity and 100% specificity, compared with 95% accuracy, 89% sensitivity, and 97% specificity using the MANTIS method [17] on the same validation cohort. The MANTIS method was used because it was shown to have relatively better performance than mSINGS and MSISensor in previous research [17]. In the overall cohort (n = 3,309), patients with high MSI had a significantly higher TMB than those with MSS, as expected (Fig. 6B), and this observation was particularly true for colorectal cancers (Fig. 6C).
Figure 6.
The performance of MSI detection and the correlation of MSI with TMB. (A): The performance of MSI detection algorithm. Each dot stands for a sample; a orange colored dot was validated as MSI‐H, and a blue colored dot was validated as MSS by MSI‐polymerase chain reaction or MMR‐immunohistochemistry. (B): The correlation of MSI status with pan‐cancer TMB. (C): The correlation of MSI status with colorectal cancer TMB.
Abbreviations: MANTIS, Microsatellite Analysis for Normal Tumor Instability; MSI, microsatellite instability; MSI‐H, MSI high; MSS, microsatellite stable; TMB, tumor mutational burden.
Discussion
In this study, we have shown the overall workflow and elaborated new functionalities of CSYS, an NGS‐based assay. It is an accurate and comprehensive platform of potential value for clinical use. In comparison with the Foundation‐One panel assay targeting more than ×500 coverage [1], the mean depth of the CSYS assay reaches more than ×1,000 while maintaining relatively good uniformity across multiple genes. The efficient performance of CSYS was confirmed by comparison with standard assays. Using cell line DNA for analytical experiments, we have assessed the sensitivity and PPV to be 99.7% and 99.9%, respectively, for SNV, as well as 100% and >99.9%, respectively, for short indels. Moreover, the reproducibility for SNV and short indels was also as high as >0.99 and 0.999, respectively, as measured by Pearson correlation coefficients of VAFs. These performance specifications for SNV and short indels were also comparable to those of the Foundation‐One assay. For CNA, by using FISH and/or IHC on the same clinical specimen as orthogonal validation, we have assessed the clinical sensitivity and PPV to be 95.5% and 100%, respectively, with minimum tumor purity of 20%. The reproducibility of CNA detection is nearly 1. Of note, for gene rearrangement and L‐indel detection, we have achieved 100% specificity for both. Overall, the outstanding performance specifications, including high sensitivity and specificity as well as high reproducibility for detection of the variants above, thus guarantee the accuracy and reliability of this assay.
It is noteworthy that the CSYS assay can accurately interrogate L‐indels, which are otherwise neglected by other assays in clinical practice. In fact, L‐indel occurs with an unexpected frequency (6.3%) in a larger cohort of tumors from Chinese patients with cancer (n = 3,309) and may have clinical implication for cancer treatment. For instance, patients harboring a long insertion in the FLT3 gene were found to have decreased overall survival [23], [24]. Several small‐molecule FLT3 tyrosine kinase inhibitors are being evaluated for this mutation [5], [25]. Patients with MET exon 14 skipping (a form of long deletion) can potentially benefit from MET inhibitor treatment [26], [27], and thus its successful detection becomes a critical step in clinical practice. Among our tested cohort, a patient with an L‐indel in the MLH1 gene was identified as MSI high and thus potentially sensitive to immune checkpoint inhibitors. We anticipate that L‐indel detection could inform therapy decisions among patients with such alterations.
Both TMB and MSI are promising biomarkers for sensitivity to checkpoint inhibitor immunotherapies [28], [29]. Our cohort used for assaying TMB for tumors from Chinese patients with cancer proves to be the largest one reported to date. The result from CSYS showed that different tumor types from Chinese patients exhibit mutational landscapes with a distribution similar to, but with some minor differences from, the previously reported ones from Foundation‐One and MSK‐IMPACT assays. Notably, small cell lung cancers had the highest median TMB in Chinese patients, highlighting a potential responsiveness to checkpoint therapy. A large percentage of Chinese patients with NSCLC and colorectal adenocarcinoma tend to have much higher TMB than previously reported. Because only tumor types with a sample size of more than 100 cases are listed in Figure 4A, cutaneous cancers, which reportedly have high TMB, are not included in our data. Importantly, we found a stronger correlation of CSYS TMB with WES TMB than previously observed with other sequencing assays [14].
Conclusion
As a highly accurate and comprehensive cancer panel sequencing assay, CSYS may be useful for routine clinical application in determining potential treatment options. It is expected that patients with cancer would increasingly benefit from genomic testing and that all the valuable information could be provided from a single assay.
See http://www.TheOncologist.com for supplemental material available online.
Contributed equally.
Contributed equally as senior co‐authors.
Contributor Information
Gaofeng Li, Email: gaofeng_li2016@sina.com.
Weiwei Shi, Email: shiww@origimed.com.
Author Contributions
Conception/design: Gaofeng Li, Weiwei Shi
Provision of study material or patients: Jingyu Cao, Binbin Liu, Zhongxiang Hu, Donglin Chen, Hui Kang, Weifeng Wang
Collection and/or assembly of data: Lijuan Chen, Hui Chen, Jicheng Yao, Shuo Mu, Wenjin Liu, Peng Zhang, Jinwei Hu, Ming Yao, Gungwei Chrin
Data analysis and interpretation: Lijuan Chen, Hui Chen, Jicheng Yao, Shuo Mu, Wenjin Liu, Peng Zhang, Jinwei Hu, Ming Yao, Gungwei Chrin
Manuscript writing: Jingyu Cao, Lijuan Chen, Heng Li, Yuwei Cheng, Kai Wang, Weiwei Shi
Final approval of manuscript: Jingyu Cao, Lijuan Chen, Heng Li, Hui Chen, Jicheng Yao, Shuo Mu, Wenjin Liu, Peng Zhang, Yuwei Cheng, Binbin Liu, Zhongxiang Hu, Donglin Chen, Hui Kang, Jinwei Hu, Aodi Wang, Weifeng Wang, Ming Yao, Gungwei Chrin, Xiaoting Wang, Wei Zhao, Lei Li, Luping Xu, Weixin Guo, Jun Jia, Jianhua Chen, Kai Wang, Gaofeng Li, Weiwei Shi
Disclosures
Lijuan Chen: OrigiMed (E); Hui Chen: OrigiMed (E); Jicheng Yao: OrigiMed (E); Shuo Mu: OrigiMed (E); Wenjin Liu: OrigiMed (E); Peng Zhang: OrigiMed (E); Binbin Liu: OrigiMed (E); Zhongxiang Hu: OrigiMed (E); Donglin Chen: OrigiMed (E); Hui Kang: OrigiMed (E); Jinwei Hu: OrigiMed (E); Aodi Wang: OrigiMed (E); Weifeng Wang: OrigiMed (E); Ming Yao: OrigiMed (E); Gungwei Chrin: OrigiMed (E); Kai Wang: OrigiMed (E); Weiwei Shi: OrigiMed (E). The other authors indicated no financial relationships.
(C/A) Consulting/advisory relationship; (RF) Research funding; (E) Employment; (ET) Expert testimony; (H) Honoraria received; (OI) Ownership interests; (IP) Intellectual property rights/inventor/patent holder; (SAB) Scientific advisory board
References
- 1.Frampton GM, Fichtenholtz A, Otto GA et al. Development and validation of a clinical cancer genomic profiling test based on massively parallel DNA sequencing. Nat Biotechnol 2013;31:1023–1031. [DOI] [PMC free article] [PubMed] [Google Scholar]
- 2.Gerber DE. Targeted therapies: A new generation of cancer treatments. Am Fam Physician 2008;77:311–319. [PubMed] [Google Scholar]
- 3.Topham JT, Marra MA. Sequencing strategies to guide decision making in cancer treatment. PLoS Med 2016;13:e1002189. [DOI] [PMC free article] [PubMed] [Google Scholar]
- 4.Wagle N, Berger MF, Davis MJ et al. High‐throughput detection of actionable genomic alterations in clinical tumor samples by targeted, massively parallel sequencing. Cancer Discov 2012;2:82–93. [DOI] [PMC free article] [PubMed] [Google Scholar]
- 5.Au CH, Wa A, Ho DN et al. Clinical evaluation of panel testing by next‐generation sequencing (NGS) for gene mutations in myeloid neoplasms. Diagn Pathol 2016;11:11. [DOI] [PMC free article] [PubMed] [Google Scholar]
- 6.Frampton GM, Ali SM, Rosenzweig M et al. Activation of MET via diverse exon 14 splicing alterations occurs in multiple tumor types and confers clinical sensitivity to MET inhibitors. Cancer Discov 2015;5:850–859. [DOI] [PubMed] [Google Scholar]
- 7.Cheng DT, Mitchell TN, Zehir A et al. Memorial Sloan Kettering‐Integrated Mutation Profiling of Actionable Cancer Targets (MSK‐IMPACT): A hybridization capture‐based next‐generation sequencing clinical assay for solid tumor molecular oncology. J Mol Diagn 2015;17:251–264. [DOI] [PMC free article] [PubMed] [Google Scholar]
- 8.Cottrell CE, Al‐Kateb H, Bredemeyer AJ et al. Validation of a next‐generation sequencing assay for clinical molecular oncology. J Mol Diagn 2014;16:89–105. [DOI] [PMC free article] [PubMed] [Google Scholar]
- 9.Ananda G, Mockus S, Lundquist M et al. Development and validation of the JAX Cancer Treatment Profile for detection of clinically actionable mutations in solid tumors. Exp Mol Pathol 2015;98:106–112. [DOI] [PMC free article] [PubMed] [Google Scholar]
- 10.Schmitt MW, Loeb LA, Salk JJ. The influence of subclonal resistance mutations on targeted cancer therapy. Nat Rev Clin Oncol 2016;13:335–347. [DOI] [PMC free article] [PubMed] [Google Scholar]
- 11.Robert C, Long GV, Brady B et al. Nivolumab in previously untreated melanoma without BRAF mutation. N Engl J Med 2015;372:320–330. [DOI] [PubMed] [Google Scholar]
- 12.Borghaei H, Paz‐Ares L, Horn L et al. Nivolumab versus docetaxel in advanced nonsquamous non‐small‐cell lung cancer. N Engl J Med 2015;373:1627–1639. [DOI] [PMC free article] [PubMed] [Google Scholar]
- 13.Chalmers ZR, Connelly CF, Fabrizio D et al. Analysis of 100,000 human cancer genomes reveals the landscape of tumor mutational burden. Genome Med 2017;9:34. [DOI] [PMC free article] [PubMed] [Google Scholar]
- 14.Zehir A, Benayed R, Shah RH et al. Mutational landscape of metastatic cancer revealed from prospective clinical sequencing of 10,000 patients. Nat Med 2017;23:703–713. [DOI] [PMC free article] [PubMed] [Google Scholar]
- 15.Hause RJ, Pritchard CC, Shendure J et al. Classification and characterization of microsatellite instability across 18 cancer types. Nat Med 2016;22:1342–1350. [DOI] [PubMed] [Google Scholar]
- 16.Salipante SJ, Scroggins SM, Hampel HL et al. Microsatellite instability detection by next generation sequencing. Clin Chem 2014;60:1192–1199. [DOI] [PubMed] [Google Scholar]
- 17.Kautto EA, Bonneville R, Miya J et al. Performance evaluation for rapid detection of pan‐cancer microsatellite instability with MANTIS. Oncotarget 2017;8:7452–7463. [DOI] [PMC free article] [PubMed] [Google Scholar]
- 18.Derrien T, Estelle J, Marco Sola S et al. Fast computation and applications of genome mappability. PLoS One 2012;7:e30377. [DOI] [PMC free article] [PubMed] [Google Scholar]
- 19.Genomes Project C, Auton A, Brooks LD et al. A global reference for human genetic variation. Nature 2015;526:68–74. [DOI] [PMC free article] [PubMed] [Google Scholar]
- 20.Yang R, Nelson AC, Henzler C et al. ScanIndel: A hybrid framework for indel detection via gapped alignment, split reads and de novo assembly. Genome Med 2015;7:127. [DOI] [PMC free article] [PubMed] [Google Scholar]
- 21.Deihimi S, Lev A, Slifker M et al. BRCA2, EGFR, and NTRK mutations in mismatch repair‐deficient colorectal cancers with MSH2 or MLH1 mutations. Oncotarget 2017;8:39945–39962. [DOI] [PMC free article] [PubMed] [Google Scholar]
- 22.Singal G, Miller PG, Agarwala V et al. Association of patient characteristics and tumor genomics with clinical outcomes among patients with non‐small cell lung cancer using a clinicogenomic database. JAMA 2019;321:1391–1399. [DOI] [PMC free article] [PubMed] [Google Scholar]
- 23.Santos FPS, Dan J, Wei Q et al. Prognostic value of FLT3 mutations among different cytogenetic subgroups in acute myeloid leukemia. Cancer 2011;117:2145–2155. [DOI] [PMC free article] [PubMed] [Google Scholar]
- 24.Whitman SP, Archer KJ, Feng L et al. Absence of the wild‐type allele predicts poor prognosis in adult de novo acute myeloid leukemia with normal cytogenetics and the internal tandem duplication of FLT3: A cancer and leukemia group B study. Cancer Res 2001;61:7233–7239. [PubMed] [Google Scholar]
- 25.Antar A, Otrock ZK, El‐Cheikh J et al. Inhibition of FLT3 in AML: A focus on sorafenib. Bone Marrow Transplant 2017;52:344–351. [DOI] [PubMed] [Google Scholar]
- 26.Rodig SJ, Shapiro GI. Crizotinib, a small‐molecule dual inhibitor of the c‐Met and ALK receptor tyrosine kinases. Curr Opin Investig Drugs 2010;11:1477–1490. [PubMed] [Google Scholar]
- 27.Campesato LF, Barroso‐Sousa R, Jimenez L et al. Comprehensive cancer‐gene panels can be used to estimate mutational load and predict clinical benefit to PD‐1 blockade in clinical practice. Oncotarget 2015;6:34221–34227. [DOI] [PMC free article] [PubMed] [Google Scholar]
- 28.Xiao Y, Freeman GJ. The microsatellite instable subset of colorectal cancer is a particularly good candidate for checkpoint blockade immunotherapy. Cancer Discov 2015;5:16–18. [DOI] [PMC free article] [PubMed] [Google Scholar]
- 29.Bonotto M, Garattini SK, Basile D et al. Immunotherapy for gastric cancers: Emerging role and future perspectives. Expert Rev Clin Pharmacol 2017;10:609–619. [DOI] [PubMed] [Google Scholar]


