The findings of this study provide evidence that will help to better distinguish between patients with hepatitis B virus‐associated hepatocellular carcinoma who will most likely benefit from transarterial chemoembolization therapy and those who will require more personalized therapy.
Keywords: Hepatocellular carcinoma, Interleukin‐6, Transcatheter arterial chemoembolization, Tumor response
Abstract
Background.
The aim of this study was to determine the potential prognostic roles of the perioperative interleukin‐6 (IL‐6) level and its dynamic changes in patients with hepatocellular carcinoma (HCC) undergoing transarterial chemoembolization (TACE).
Materials and Methods.
Sixty patients with hepatitis B virus‐associated HCC receiving TACE were enrolled in the study. Serum IL‐6 levels were determined at baseline and 1 day after TACE by immunoassay. Response to TACE was evaluated after a 4–6‐week interval. Factors associated with tumor response were analyzed by univariate and multivariate analysis in a Cox regression model. Receiver operating characteristic (ROC) curve analysis was performed to assess the predictive performance of the included variables on tumor response in patients with HCC undergoing TACE.
Results.
The serum IL‐6 level was significantly elevated 1 day after TACE. Patients in the low postintervention IL‐6 level group had a high probability of achieving an objective response (OR) (66.7% vs. 18.8%, p = .021). Post‐TACE IL‐6 level (≤12.7 pg/mL) and post‐/pre‐TACE neutrophils ratio (>2.47) were independently correlated with OR after TACE. ROC curve analysis showed that a combined index based on those two factors exhibited optimal predictive power of tumor response among all the included variables (area under the curve = 0.740, 95% confidence interval: 0.601–0.879). Additionally, high post‐TACE plasma IL‐6 level was associated with maximum tumor size, vascular invasion, post‐TACE aspartate aminotransferase, and Barcelona Clinic Liver Cancer stage.
Conclusion.
Our study suggests that the post‐treatment serum IL‐6 level, rather than pretreatment or dynamic changes of IL‐6, serves as a powerful predictor for tumor response. These findings provide evidence to help discriminate between patients who will particularly benefit from TACE and those who require more personalized therapeutic regimens and rigorous surveillance.
Implications for Practice.
Transarterial chemoembolization (TACE) is a major therapeutic regimen for advanced hepatocellular carcinoma. Thus, identification of early practical markers of tumor response to TACE is of high importance. This study indicated that the post‐treatment serum interleukin‐6 (IL‐6) level, rather than the pretreatment or dynamic changes of IL‐6, serves as a powerful predictor for tumor response. A combined index based on the post‐TACE IL‐6 level and post‐/pre‐TACE neutrophils ratio is optimal for predetermining an objective response after TACE, which may be helpful in guiding individualized treatments and surveillance.
Introduction
Transarterial chemoembolization (TACE) is an approved first‐line therapy for advanced hepatocellular carcinoma (HCC) [1]. However, the response rates to TACE are heterogeneous, and it is not fully understood which patients will most likely benefit from TACE in terms of tumor response [1], [2]. Therefore, identification of new practical markers is important to discriminate between patients who will benefit from TACE therapy and those requiring more individualized treatments and rigorous monitoring. Toward this end, great efforts have been made by a growing number of investigators in recent years, especially with regard to identification of serum markers, which can be more easily and noninvasively measured at different time points compared with tumor biopsy or imaging‐based metrics. Nevertheless, few of these markers identified to date are satisfactory in terms of strong predictive power of a therapeutic response.
Interleukin‐6 (IL‐6) is a pivotal cytokine involved in many complex biological processes, including immunity, inflammation, metabolism, reproduction, hematopoiesis, angiogenesis, neural development, and bone remodeling [3]. In the tumor microenvironment, multiple cell types can produce IL‐6, including tumor‐infiltrating immune cells, fibroblast stromal cells, and the tumor cells themselves, which are induced by various factors, such as nuclear factor‐kappa B, IL‐β, prostaglandin E2, hypoxia, lack of signal transducer and activator of transcription 3‐inhibitors, and microRNAs [4], [5], [6], [7], [8], [9]. Previous studies have shown that baseline IL‐6 level is a promising tumor marker for HCC [10]. High pretreatment plasma IL‐6 levels were associated with a poor prognosis of patients with advanced HCC [11]. In patients with hepatitis B virus (HBV)‐related early HCC who underwent hepatic resection or radiofrequency ablation with curative intention, a low serum IL‐6 level was shown to be an independent prognostic factor for disease‐free survival [12]. Moreover, elevated serum levels of IL‐6 were significantly associated with an increased risk of HBV‐associated HCC recurrence, suggesting that the preoperative IL‐6 serum level is a potential biomarker for early prediction of HBV‐associated HCC recurrence [13]. Several studies have also verified the prognostic role of IL‐6 in patients who underwent TACE. For example, early‐phase increases in IL‐6 after TACE may have hepatoprotective effects and reflect acute‐phase responses, and acute elevations in IL‐6 are associated with post‐treatment hepatitis [14]. Furthermore, IL‐6 serum levels could predict tumor response and overall survival (OS) after TACE for primary and secondary hepatic malignancies [15]. However, almost all of these studies focused on pretreatment levels, while ignoring the potential predictive value of the post‐treatment circulating IL‐6 level and its dynamic changes in the context of TACE treatment, which we consider will be more reflective of a biological reaction with inflammation and the immune system.
Therefore, we conducted a prospective observational study in a cohort of patients with HBV‐associated HCC undergoing TACE, so as to shed light on the discriminating power of pre‐and post‐TACE IL‐6 serum level and its dynamic changes in predicting tumor response.
Materials and Methods
Patients and Study Design
A total of 60 consecutive patients with HBV‐associated HCC who underwent TACE between October 2017 and August 2018 at the First Affiliated Hospital of Sun Yat‐sen University were enrolled in the final analysis (supplemental online Fig. 1). HCC was diagnosed according to the guideline of the European Association for the Study of the Liver and the American Association for the Study of Liver [16]. Patients enrolled were required to meet the following criteria: (a) TACE was the first‐line initial therapy; (b) Child‐Pugh classification A or B; (c) Eastern Cooperative Oncology Group Performance Status (ECOG PS) of 0–2; (d) no serious infection before transarterial therapy. Vascular invasion was defined as branch portal vein or main portal vein invasion.
This study was approved by the ethics committee of the First Affiliated Hospital of Sun Yat‐sen University. Informed consent was obtained from each patient.
Measurement of Serum IL‐6 Levels
Serum samples were obtained from the patients at baseline and 1 day after TACE. Concentrations of IL‐6 were analyzed by immunoassay using Human IL‐6 Elecsys kits (Roche Diagnostics GmbH, Mannheim, Germany), according to the manufacture's instruction, and by automatic biochemical immunoassay system (Roche Cobas 6000's module e601). The sensitivity of the assay was 1.5 pg/mL.
TACE Procedure
All TACE procedures were conducted by our experienced radiologists using techniques previously described [17]. Briefly, the chemotherapeutic emulsion consisting of 10–20 mL lipiodol (Guerbet, Roissy, France) and 20–40 mg epirubicin (Pfizer, Wuxi, China) was slowly injected through a 5‐Fr Yashrio catheter or 2.7‐Fr micro‐catheter (Progreat, Terumo, Tokyo, Japan). Subsequently, to reduce the residual blood flow, Gelfoam (Ailikang Medicine, Hangzhou, China) mixed with contrast medium was injected until there was no longer any tumor staining after repeated angiography. Depending on the features of the tumor, a superselective (subsegmental), selective (segmental), or nonselective (lobar) approach was performed whenever possible.
Evaluation of TACE Response
All patients were followed up with a physical examination; routine blood tests, including alpha‐fetoprotein (AFP) measurements; liver and kidney function tests; and contrast‐enhanced computed tomography (CT) or magnetic resonance imaging (MRI) scanning 4–6 weeks after TACE. Three experienced radiologists in imaging diagnosis interpreted all follow‐up CT or MRI scans. Tumor response was assessed based on radiological evaluation according to the modified RECIST: complete response (CR), partial response (PR), stable disease, and progressive disease. CR and PR were further summarized into objective response (OR) [18].
Statistical Analyses
Statistical analyses were performed with SPSS version 24.0 (SPSS Inc., Chicago, IL) and GraphPad Prism version 7.0 software. The results are reported as means ± SDs. Continuous variables were compared using an independent sample t test. Categorical data were compared using the Pearson chi‐squared test or Fisher's exact test. Significant cutoff value for IL‐6 was determined via the receiver operating characteristic (ROC) curve. ROC curves were generated by plotting sensitivity against 1‐specificity. The optimal cutoff values for ROC curves were established using the Youden index. Factors associated with tumor response were analyzed by univariate and multivariate analysis in the Cox regression model. A p value <.05 was considered statistically significant.
Results
Study Population and HCC Characteristics at Baseline
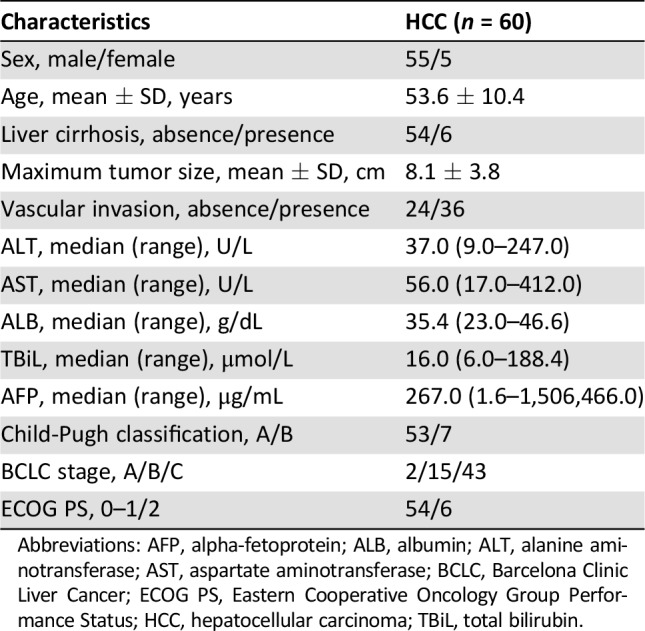
In total, 60 patients with HBV‐associated HCC were included in the final analysis. The baseline characteristics of the study population are presented in Table 1. The mean patient age was 53.6 ± 10.4 years, and 91.7% of the patients were men. Most patients (90.0%) had cirrhosis, and 88.3% were determined to be Child‐Pugh class A (based on Child‐Pugh classification for severity of liver disease). The maximum tumor size of these patients was 8.1 ± 3.8 cm. According to the Barcelona Clinic Liver Cancer (BCLC) classification, 3.3%, 25.0%, and 71.7% of the patients had stage A, B, and C disease, respectively. Ninety percent of the participants had a good ECOG PS of 0–1.
Table 1. Baseline characteristics of the hepatocellular carcinoma cohort.
Abbreviations: AFP, alpha‐fetoprotein; ALB, albumin; ALT, alanine aminotransferase; AST, aspartate aminotransferase; BCLC, Barcelona Clinic Liver Cancer; ECOG PS, Eastern Cooperative Oncology Group Performance Status; HCC, hepatocellular carcinoma; TBiL, total bilirubin.
Perioperative IL‐6 Levels and Tumor Response to TACE Therapy
We first explored the dynamic changes of serum IL‐6 levels in patients undergoing TACE. Compared with preintervention serum concentrations, the IL‐6 levels dramatically increased 1 day after TACE (supplemental online Fig. 2).
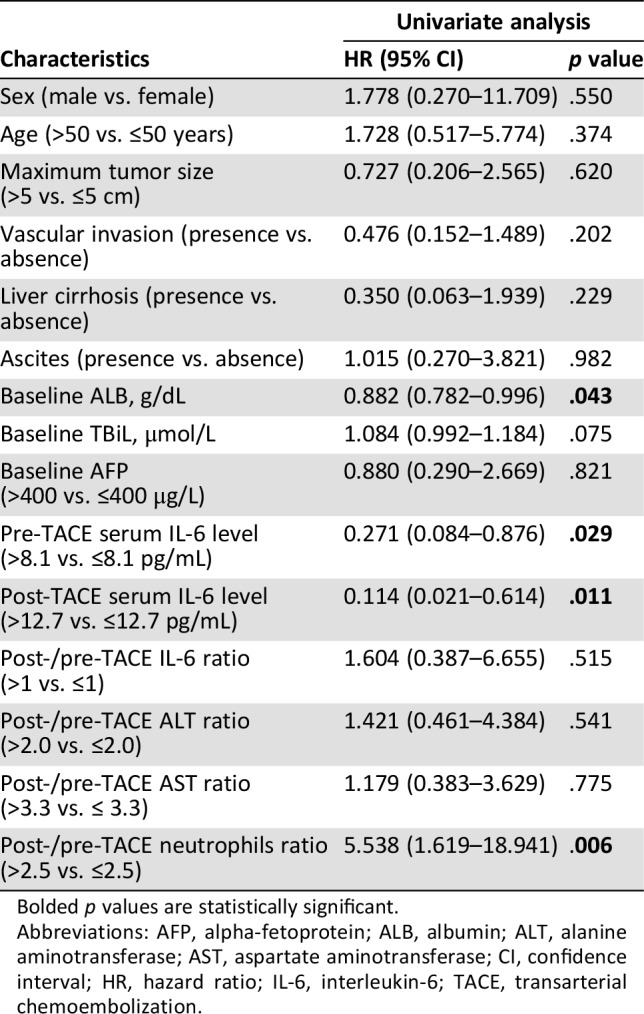
To investigate the potential predictors of TACE therapy, we divided our cohort into patients with an OR or non‐OR after TACE. In univariate logistic regression analysis, baseline albumin concentrations (p = .043), pre‐TACE serum IL‐6 levels (p = .029), post‐TACE IL‐6 levels (p = .011) and the post‐/pre‐TACE neutrophils ratio (p = .006) were found to be significantly associated with OR (Table 2). Subsequently, in the multivariate analysis, only the post‐/pre‐TACE neutrophils ratio (p = .018) and post‐TACE IL‐6 levels (p = .039) emerged as independent risk factors for OR (Table 3). To avoid the interference of collinearity factors, scoring systems, such as the Child‐Pugh classification and BCLC stage, were excluded from the additional analyses, because such scores are derived from tumor size, vascular invasion, and other variables. As illustrated in supplemental online Fig. 3, patients in the low level of post‐TACE IL‐6 group had a higher possibility of achieving an OR than the counterparts (66.7% vs. 18.8%, p = .021).
Table 2. Univariate Cox regression analyses for tumor response in hepatocellular carcinoma.
Bolded p values are statistically significant.
Abbreviations: AFP, alpha‐fetoprotein; ALB, albumin; ALT, alanine aminotransferase; AST, aspartate aminotransferase; CI, confidence interval; HR, hazard ratio; IL‐6, interleukin‐6; TACE, transarterial chemoembolization.
Table 3. Multivariate Cox regression analyses for tumor response in hepatocellular carcinoma.
Bolded p values are statistically significant.
Abbreviations: AFP, alpha‐fetoprotein; ALB, albumin; CI, confidence interval; HR, hazard ratio; IL‐6, interleukin‐6; TACE, transarterial chemoembolization.
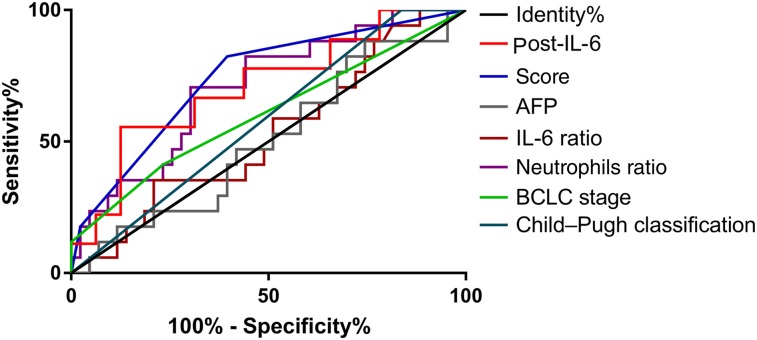
Based on the promising findings on the predictors for OR, a new combined index was established as follows: score = 3.2*(if post‐/pre‐TACE neutrophils >2.47) − 2.7*(if post‐TACE IL‐6 level > 12.7 pg/mL). We then performed ROC curves to identify the efficacy of those predictors. The area under the curve (AUC) of the new score was the largest (AUC = 0.740) among all the variables investigated, followed by post‐TACE serum IL‐6 level (AUC = 0.708). Other involved indicators for comparison include baseline AFP (AUC = 0.506), post/pre‐TACE IL‐6 ratio (AUC = 0.525), Child‐Pugh classification (AUC = 0.581), the pre‐TACE serum IL‐6 level (AUC = 0.601), BCLC stage (AUC = 0.603), and post/pre‐TACE neutrophils (AUC = 0.706; Fig. 1; Table 4).
Figure 1.
Receiver operating characteristic (ROC) curve analysis for the discrimination between objective response (OR) and non‐OR patients: comparison of the ROC curves of baseline AFP, pre‐ and post‐transarterial chemoembolization (TACE) IL‐6 level, post‐/pre‐TACE IL‐6 ratio, post‐/pre‐TACE neutrophils ratio, Child‐Pugh classification, BCLC stage, and the new combined index.
Abbreviations: AFP, alpha‐fetoprotein; BCLC, Barcelona Clinic Liver Cancer; IL‐6, interleukin‐6.
Table 4. Discriminant abilities of the variables examined.
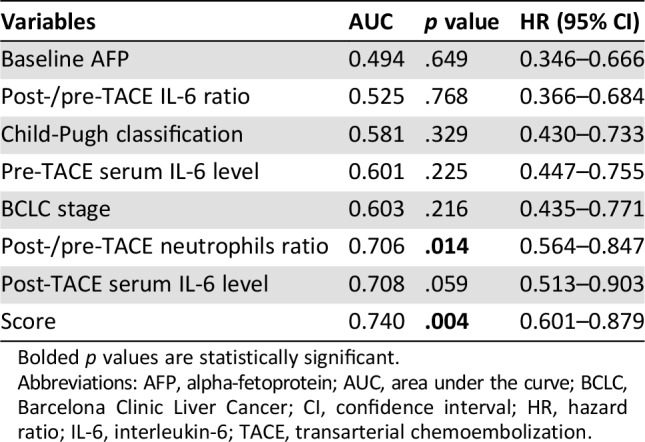
Bolded p values are statistically significant.
Abbreviations: AFP, alpha‐fetoprotein; AUC, area under the curve; BCLC, Barcelona Clinic Liver Cancer; CI, confidence interval; HR, hazard ratio; IL‐6, interleukin‐6; TACE, transarterial chemoembolization.
Associations Between Post‐TACE Plasma IL‐6 Levels and Patient Characteristics
The association between post‐TACE plasma IL‐6 levels and clinicopathologic parameters was assessed by the chi‐square test for proportion, as shown in Table 5. Low post‐TACE plasma IL‐6 level was found to correlate with maximum tumor size (p = .009), vascular invasion (p = .015), post‐TACE liver aspartate aminotransferase (AST) levels (p = .023), and BCLC stage (p = .001).
Table 5. Associations between post‐TACE plasma IL‐6 levels and patients’ characteristics.

Bolded p values are statistically significant.
Abbreviations: AFP, alpha‐fetoprotein; ALT, alanine aminotransferase; AST, aspartate aminotransferase; BCLC, Barcelona Clinic Liver Cancer; HBV, hepatitis B virus; IL‐6, interleukin‐6; TACE, transarterial chemoembolization.
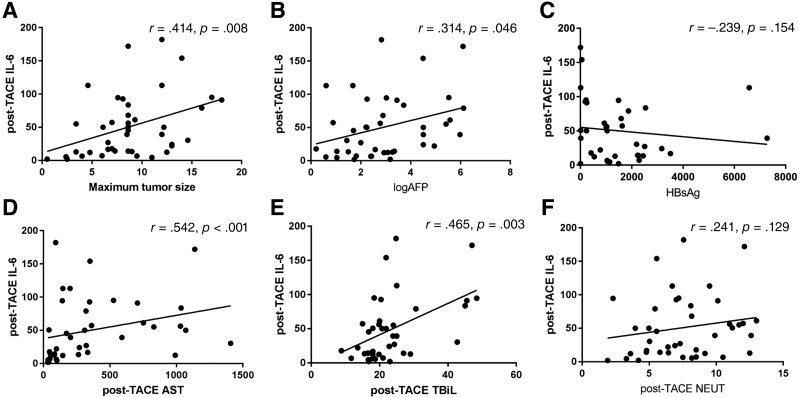
To determine correlations between post‐TACE plasma IL‐6 levels with valuable clinical parameters, we subsequently performed Spearman's correlation analysis. IL‐6 levels showed a statistically significant positive correlation with maximum tumor size (r = .414, p = .008), baseline AFP (r = .314, p = .046), post‐TACE AST (r = .542, p < .001), and post‐TACE total bilirubin (TBiL; r = .465, p = .003; Fig. 2). However, there were no significant correlations between post‐TACE plasma IL‐6 levels and baseline surface antigen of hepatitis B virus (HBsAg) levels (r = −.239, p = .154; Fig. 2), or post‐TACE neutrophils (r = .241, p = .129; Fig. 2). Furthermore, patients with Child‐Pugh class B HCC had a higher level of IL‐6 than those in class A group (p < .001). Similarly, patients with higher Child‐Pugh class HCC had a higher level of IL‐6 (p = .001; supplemental online Fig. 4).
Figure 2.
Correlations between post‐TACE IL‐6 levels and clinical parameters. (A): A positive correlation between post‐TACE IL‐6 levels and maximum tumor size (r = .414, p = .008). (B): A positive correlation between post‐TACE IL‐6 levels and log AFP (r = .314, p = .046). (C): Post‐TACE serum IL‐6 levels are not significantly associated with HBsAg amount (r = −.239, p = .154). (D): A positive correlation between post‐TACE IL‐6 levels and post‐TACE AST (r = .542, p < .001). (E): A positive correlation between post‐TACE IL‐6 levels and post‐TACE TBiL (r = .465, p = .003). (F): Post‐TACE serum IL‐6 levels are not significantly associated with post‐TACE NEUT (r = .241, p = .129).
Abbreviations: AFP, alpha‐fetoprotein; AST, aspartate aminotransferase; HBsAg, surface antigen of hepatitis B virus; IL‐6, interleukin‐6; NEUT, neutrophil; TACE, transarterial chemoembolization; TBiL, total bilirubin.
Discussion
Accumulated evidence indicates a key role of IL‐6 in the process of liver damage and carcinogenesis and its predictive power in HCC. However, in contrast to the existing data demonstrating the predictive role of the pretreatment IL‐6 level, our study is the first to investigate the prognostic value of the post‐treatment IL‐6 level as well as the dynamic changes of perioperative IL‐6 levels in patients with HCC undergoing TACE.
We found that IL‐6 increased substantially on 1 day after TACE, which is in accordance with a previous study including 41 patients with HCC that underwent TACE [19]. Remarkably, the post‐TACE IL‐6 level (≤12.7 pg/mL), but not the pretreatment IL‐6 level or the alteration in IL‐6, appears to be a better predictor of an OR in HCC. The explanation may be that the pretreatment IL‐6 level simply reflects the chronic inflammatory response in carcinogenesis, whereas the post‐TACE IL 6 level may represent acute immune and inflammatory response after treatment, given the strong necrosis and inflammation induced by chemoembolization. Moreover, persistent activation of the IL‐6 signaling pathway is detrimental to the liver, which may lead to cell proliferation, protection from apoptosis, chemoresistance, and increased metastatic potential in HCC [20], [21]. Neutrophils, the most common white blood cells in the circulation, are the “first responders” to insult or injury and one of the first immune cells to come into contact with tumor cells [22]. Distinctly increased neutrophils, which was interpreted as the post‐/pre‐TACE neutrophils ratio (>2.47) in our analysis, was proved to be another significant predictor for OR. In particular, a new score based on the post‐TACE IL‐6 level and post‐/pre‐TACE neutrophils ratio was found to exhibit the optimal predictive power among all the variables examined.
As previously reported, high preoperative serum IL‐6 levels were associated with large tumor sizes, advanced tumor stages, and recurrence or short survival after locoregional therapy for HCC [13], [23], [24]. In line with those results, we found that high post‐TACE plasma IL‐6 level was associated with maximum tumor size, vascular invasion, post‐TACE AST, and BCLC stage. More specifically, the post‐TACE plasma IL‐6 level showed a significantly positive correlation with maximum tumor size, baseline AFP, post‐TACE AST, and post‐TACE TBiL. Patients with higher Child‐Pugh class or BCLC stage were prone to having higher levels of post‐TACE IL‐6. It has been reported that preoperative serum IL‐6 level has some association with the HBsAg amount in patients with HCC after curative resection [13]. Interestingly, there is no significant correlation between post‐TACE plasma IL‐6 levels and baseline HBsAg in our study. This discrepancy may be due to the difference in IL‐6 detection time point and/or the varied treatments that the patients underwent between studies.
The present study has several limitations that should be mentioned. First, this study was conducted in a single center with a small sample size, and participants were treated with heterogeneous therapeutic strategies. Second, we detected only IL‐6 circulating levels, without determining its corresponding expression in HCC tissues. Thus, it was difficult to interpret the precise pathophysiologic roles. In addition, postembolization fever is the most significant adverse effect after TACE and relevant to tumor response [25], but the relationship between the post‐TACE IL‐6 level and postembolization fever is missed in our study. Finally, the follow‐up period was limited, such that we could not evaluate OS in the present analysis. Our future work is expected to provide detailed information regarding the role of IL‐6 levels in OS among patients with HCC treated with TACE.
Conclusion
Despite these limitations, collectively, these findings suggest that the post‐TACE serum IL‐6 level, but not the pretreatment level or its dynamic changes, serves as a potential candidate marker for predicting OR in TACE‐treated patients with HBV‐associated HCC. Remarkably, the diagnostic value of the new test significantly increased when combined with the post‐/pre‐TACE neutrophils ratio. A multicenter study incorporating a larger number of patients and with a prolonged observation period is required to confirm our findings. Moreover, further in‐depth investigation is required to understand the exact biological role of this cytokine in patients with HCC undergoing TACE.
See http://www.TheOncologist.com for supplemental material available online.
Acknowledgments
This study was supported by the Major Science and Technology Tackling Project in Guangzhou (201704020144) and the Major Science and Technology Projects in Guangdong Province (2017B030308006).
Contributed equally.
Author Contributions
Conception/design: Yanqin Wu
Provision of study material or patients: Wenzhe Fan, Miao Xue
Collection and/or assembly of data: Wang Yao, Yue Zhao
Data analysis and interpretation: Bihui Zhong, Shenghong Zhang
Manuscript writing: Yanqin Wu, Yu Wang
Final approval of manuscript: Yanqin Wu, Wenzhe Fan, Miao Xue, Bihui Zhong, Shenghong Zhang, Yu Wang, Wang Yao, Yue Zhao, Jiaping Li
Disclosures
The authors indicated no financial relationships.
References
- 1.Sacco R, Tapete G, Simonetti N et al. Transarterial chemoembolization for the treatment of hepatocellular carcinoma: A review. J Hepatocell Carcinoma 2017;4:105–110. [DOI] [PMC free article] [PubMed] [Google Scholar]
- 2.Finn RS, Zhu AX, Farah W et al. Therapies for advanced stage hepatocellular carcinoma with macrovascular invasion or metastatic disease: A systematic review and meta‐analysis. Hepatology 2018;67:422–435. [DOI] [PubMed] [Google Scholar]
- 3.Garbers C, Heink S, Korn T et al. Interleukin‐6: Designing specific therapeutics for a complex cytokine. Nat Rev Drug Discov 2018;17:395–412. [DOI] [PubMed] [Google Scholar]
- 4.Johnson DE, O'Keefe RA, Grandis JR. Targeting the IL‐6/JAK/STAT3 signalling axis in cancer. Nat Rev Clin Oncol 2018;15:234–248. [DOI] [PMC free article] [PubMed] [Google Scholar]
- 5.Rossi JF, Lu ZY, Jourdan M et al. Interleukin‐6 as a therapeutic target. Clin Cancer Res 2015;21:1248–1257. [DOI] [PubMed] [Google Scholar]
- 6.Guo Y, Xu F, Lu T et al. Interleukin‐6 signaling pathway in targeted therapy for cancer. Cancer Treat Rev 2012;38:904–910. [DOI] [PubMed] [Google Scholar]
- 7.Huynh PT, Beswick EJ, Coronado YA et al. CD90(+) stromal cells are the major source of IL‐6, which supports cancer stem‐like cells and inflammation in colorectal cancer. Int J Cancer 2016;138:1971–1981. [DOI] [PMC free article] [PubMed] [Google Scholar]
- 8.Lesina M, Wormann SM, Neuhofer P et al. Interleukin‐6 in inflammatory and malignant diseases of the pancreas. Semin Immunol 2014;26:80–87. [DOI] [PubMed] [Google Scholar]
- 9.Pop VV, Seicean A, Lupan I et al. IL‐6 roles ‐ Molecular pathway and clinical implication in pancreatic cancer ‐ A systemic review. Immunol Lett 2017;181:45–50. [DOI] [PubMed] [Google Scholar]
- 10.Porta C, De Amici M, Quaglini S et al. Circulating interleukin‐6 as a tumor marker for hepatocellular carcinoma. Ann Oncol 2008;19:353–358. [DOI] [PubMed] [Google Scholar]
- 11.Shao YY, Lin H, Li YS et al. High plasma interleukin‐6 levels associated with poor prognosis of patients with advanced hepatocellular carcinoma. Jpn J Clin Oncol 2017;47:949–953. [DOI] [PubMed] [Google Scholar]
- 12.Cho HJ, Kim SS, Ahn SJ et al. Low serum interleukin‐6 levels as a predictive marker of recurrence in patients with hepatitis B virus related hepatocellular carcinoma who underwent curative treatment. Cytokine 2015;73:245–252. [DOI] [PubMed] [Google Scholar]
- 13.Sheng T, Wang B, Wang SY et al. The relationship between serum interleukin‐6 and the recurrence of hepatitis B virus related hepatocellular carcinoma after curative resection. Medicine (Baltimore) 2015;94:e941. [DOI] [PMC free article] [PubMed] [Google Scholar]
- 14.Kim MJ, Jang JW, Oh BS et al. Change in inflammatory cytokine profiles after transarterial chemotherapy in patients with hepatocellular carcinoma. Cytokine 2013;64:516–522. [DOI] [PubMed] [Google Scholar]
- 15.Loosen SH, Schulze‐Hagen M, Leyh C et al. IL‐6 and IL‐8 serum levels predict tumor response and overall survival after TACE for primary and secondary hepatic malignancies. Int J Mol Sci 2018;19. [DOI] [PMC free article] [PubMed] [Google Scholar]
- 16.Bruix J, Sherman M. Management of hepatocellular carcinoma. Hepatology 2005;42:1208–1236. [DOI] [PubMed] [Google Scholar]
- 17.Zhang Y, Huang G, Wang Y et al. Is salvage liver resection necessary for initially unresectable hepatocellular carcinoma patients downstaged by transarterial chemoembolization? Ten years of experience. The Oncologist 2016;21:1442–1449. [DOI] [PMC free article] [PubMed] [Google Scholar]
- 18.Lencioni R, Llovet JM. Modified RECIST (mRECIST) assessment for hepatocellular carcinoma. Semin Liver Dis 2010;30:52–60. [DOI] [PMC free article] [PubMed] [Google Scholar]
- 19.Chao Y, Wu CY, Kuo CY et al. Cytokines are associated with postembolization fever and survival in hepatocellular carcinoma patients receiving transcatheter arterial chemoembolization. Hepatol Int 2013;7:883–892. [DOI] [PubMed] [Google Scholar]
- 20.Schmidt‐Arras D, Rose‐John S. IL‐6 pathway in the liver: From physiopathology to therapy. J Hepatol 2016;64:1403–1415. [DOI] [PubMed] [Google Scholar]
- 21.Johnson C, Han Y, Hughart N et al. Interleukin‐6 and its receptor, key players in hepatobiliary inflammation and cancer. Transl Gastrointest Cancer 2012;1:58–70. [DOI] [PMC free article] [PubMed] [Google Scholar]
- 22.Margetts J, Ogle LF, Chan SL et al. Neutrophils: Driving progression and poor prognosis in hepatocellular carcinoma? Br J Cancer 2018;118:248–257. [DOI] [PMC free article] [PubMed] [Google Scholar]
- 23.Jang JW, Oh BS, Kwon JH et al. Serum interleukin‐6 and C‐reactive protein as a prognostic indicator in hepatocellular carcinoma. Cytokine 2012;60:686–693. [DOI] [PubMed] [Google Scholar]
- 24.Pang XH, Zhang JP, Zhang YJ et al. Preoperative levels of serum interleukin‐6 in patients with hepatocellular carcinoma. Hepatogastroenterology 2011;58:1687–1693. [DOI] [PubMed] [Google Scholar]
- 25.Blackburn H, West S. Management of postembolization syndrome following hepatic transarterial chemoembolization for primary or metastatic liver cancer. Cancer Nurs 2016;39:E1–E18. [DOI] [PubMed] [Google Scholar]


