This article reports on differences in ECOG performance scores assessed by oncologists versus nurses, focusing on whether the ratings differed in accurate prediction of clinical outcomes.
Keywords: Karnofsky Performance Status, Cancer survivors, Nursing assessment, Oncologists, Treatment outcome, Retrospective studies
Abstract
Background.
The Eastern Cooperative Oncology Group Performance Status (ECOG‐PS) scale is commonly used by physicians and nurses in oncology, as it correlates with cancer morbidity, mortality, and complications from chemotherapy and can help direct clinical decisions and prognostication. This retrospective cohort study aimed to identify whether ECOG‐PS scores rated by oncologist versus nurses differ in their ability to predict clinical outcomes.
Materials and Methods.
Over 19 months, 32 oncologists and 41 chemotherapy nurses from a single academic comprehensive cancer center independently scored ECOG‐PS (range: 0–5) for a random sample of 311 patients with cancer receiving chemotherapy. Logistic regression models were fit to evaluate the ability of nurse and physician ECOG‐PS scores, as well as the nurse‐physician ECOG‐PS score difference (nurse minus physician), to predict the occurrence of chemotherapy toxicity (CTCAE v4, grade ≥3) and hospitalizations within 1 month from ECOG‐PS ratings, as well as 6‐month mortality or hospice referrals.
Results.
Physician/nurse ECOG‐PS agreement was 71% (Cohen's κ = 0.486, p < .0001). Nurse ECOG‐PS scores had stronger odds ratio for 6‐month mortality or hospice (odds ratio [OR], 3.29, p < .0001) than physician ECOG‐PS scores (OR, 2.71, p = .001). Furthermore, ECOG‐PS ratings by nurses, but not physicians, correlated with 1‐month chemotherapy toxicity (OR, 1.44, p = .021) and 1‐month hospitalizations (OR, 1.57, p = .041). Nurse‐physician disagreement, but only when physicians gave “healthier” (lower) ratings, was also associated with worse outcomes (chemotherapy toxicity OR = 1.51, p = .045; 1‐month hospitalization OR, 1.86, p = .037; 6‐month mortality or hospice OR, 2.99, p < .0001).
Conclusion.
Nurse ECOG‐PS ratings seem more predictive of important outcomes than those of physicians, and physician‐nurse disagreement in ECOG‐PS ratings predicts worse outcomes; scoring by nurses may result in additional clinical benefit.
Implications for Practice.
Nurse‐rated Eastern Cooperative Oncology Group Performance Status (ECOG‐PS) scores, compared with those rated by oncologists, better predicted hospitalizations and severe chemotherapy toxicity within 1 month from ECOG‐PS assessment, as well as mortality or hospice referrals within 6 months. Physician‐nurse disagreement in ECOG‐PS scoring was associated with worse hospitalization, chemotherapy toxicity, and mortality and hospice referral rates. Rating performance statuses of patients with cancer by nurses instead or in addition to oncologists can result in additional clinical benefits, such as improved prognostication, as well as better informed clinical decision making regarding whether or not to administer chemotherapy, the need for additional supportive care, and goals of care discussions.
Introduction
Performance status is an important indicator of general well‐being and the ability to perform activities of daily living in patients with cancer. It is frequently assessed by health care providers in both the clinical and research settings. Provider‐rated performance status has been shown in most studies to be significantly correlated with patient‐reported outcomes, which describe patients’ subjective symptomatic experience, including physical function, anxiety, depression, fatigue, sleep disturbance, and pain [1]. More importantly, performance status has also been repeatedly shown to predict important clinical outcomes, including quality of life, chemotherapy toxicity, response to chemotherapy, terminal illness, progression free survival, and overall survival in patients with cancer [2], [3], [4].
Multiple scales have been developed to quantify performance status of patients with cancer, of which the most commonly used are the Karnofsky Performance Status (KPS), which was published in 1948 [5], and the Eastern Cooperative Oncology Group Performance Status (ECOG‐PS), first described in 1982 [6]. When ranked by the same providers, ECOG‐PS and KPS scores have been found to be strongly associated with each other [7]. These performance status scales are routinely used by oncologists and other health care providers to help direct clinical decision making and inform treatment choices. They have also been incorporated into the vast majority of prognosis prediction models in patients with cancer [8].
Multiple studies have assessed the inter‐rater agreement between physicians, nurses, and other health care professionals in scoring performance status of patients with cancer. Surprisingly, physician and nurse inter‐rater agreement in KPS and ECOG‐PS scores is not always robust and has been shown to vary significantly across the reported literature (Cohen's κ coefficient ranging between 0.23 and 0.77) [9]. The majority of studies suggest that physicians tend to report “healthier” ECOG‐PS or KPS scores than nurses [9]. Despite these discrepancies, it is generally accepted practice that the physician‐rated performance status guides therapy decisions.
It remains unclear, however, whether physician and nurse performance status ratings differ in their ability to predict important clinical outcomes. This information is important, as providers in oncology and other fields such as palliative medicine frequently rely on performance status evaluations to prognosticate, predict response to chemotherapy and complications thereof, make clinical decisions, and even change the focus of care from curative to palliative intent.
The purpose of this study was to explore the concordance between physician‐ and nurse‐rated ECOG‐PS scores in a large academic comprehensive cancer center and to assess their respective associations with 1‐month significant chemotherapy toxicity and hospitalizations and 6‐month mortality or hospice referrals. This study further aimed to test whether nurse‐physician disagreement in ECOG‐PS scores is in itself a predictor of the above clinical outcomes.
Subjects, Materials, and Methods
Study Population
We conducted a retrospective cohort study in patients with various solid tumors receiving outpatient chemotherapy at the Cedars‐Sinai Medical Center Samuel Oschin Comprehensive Cancer Institute. The study was approved and was granted a waiver of consent by the institutional review board of Cedars‐Sinai Medical Center (approval no. CR00012854/Pro00041679).
As reported elsewhere [10], in an effort to minimize the inappropriate delivery of chemotherapy to patients with poor performance status at the outpatient Samuel Oschin Comprehensive Cancer Institute, the Cancer Quality Committee undertook an initiative in 2014 that required all prescribing oncologists to score and document a patient's ECOG‐PS in the electronic medical record prior to the administration of chemotherapy. Additionally, as part of this initiative, for each patient receiving chemotherapy for whom an ECOG‐PS was documented by an oncologist, chemotherapy‐administering nurses were also required to score ECOG‐PS. This was documented by the nurses on paper forms on the same day as the oncologist's ECOG‐PS rating was performed and prior to administering chemotherapy. The nurse's evaluations did not affect treatment decisions, nor were they reported back to oncologists. To assess compliance with the policy and determine concordance between nurse and physician ECOG‐PS assessments, a random audit of 1,084 of the 12,259 activated chemotherapy orders from March 2014 through October 2015 in the cancer center was performed. No specific inclusion or exclusion criteria were applied in that assessment, and the study included patients receiving chemotherapy with either therapeutic or curative intents. The quality evaluation included patients of 32 treating medical oncologists (“physician”) and 41 chemotherapy nurses (“nurse”) who prospectively and independently rated ECOG‐PS scores for their own patients with various solid and liquid malignancies undergoing chemotherapy in the infusion center.
For the purpose of this current study evaluating physician‐nurse ECOG‐PS concordance and clinical outcomes for patients with solid malignancies, we subselected from the above 1,084 activated chemotherapy orders all 489 treatment incidences for patients with solid malignancies who were receiving first‐ or advanced‐line chemotherapies for either palliative or curative intent, and for which there was both a physician and nurse ECOG‐PS score documented. The remaining 595 treatment incidences were for patients with liquid malignancies and were excluded. Whenever an included patient had more than one chemotherapy treatment incidence during the study period, we chose the most recent one along with the ECOG‐PS ratings done on the same day of the most recent treatment and excluded the rest. This selection resulted in a total of 311 patients who participated in the study.
Variables of Interest
We retrospectively collected physician and nurse ECOG‐PS scores from the aforementioned prior study (see definitions in Table 1) [6], ranging from 0 (good performance status) to 5 (deceased), for each of the 311 patients included in our current study. We then retrospectively reviewed patient electronic charts for clinical outcomes including (a) occurrence of high grade chemotherapy toxicities, defined as grade 3 or 4 toxicities, based on the Common Terminology Criteria for Adverse Events (CTCAE, version 4.0) [11] within 1 month of the studied ECOG‐PS assessment; (b) occurrence of hospitalization in our medical center within 1 month of the studied ECOG‐PS assessment (not including elective hospitalizations for procedures); and (c) occurrence of death or referral to hospice within 6 months of the studied ECOG‐PS assessment. All three clinical outcome measures above were coded as nominal variables (“yes/no”). Chart reviewers were blinded to the ECOG‐PS scores. These outcomes were chosen as they portray highly relevant information for oncology providers needed for prognostication, clinical decision making, and goals of care discussions.
Table 1. Definition of ECOG performance status scores [6].
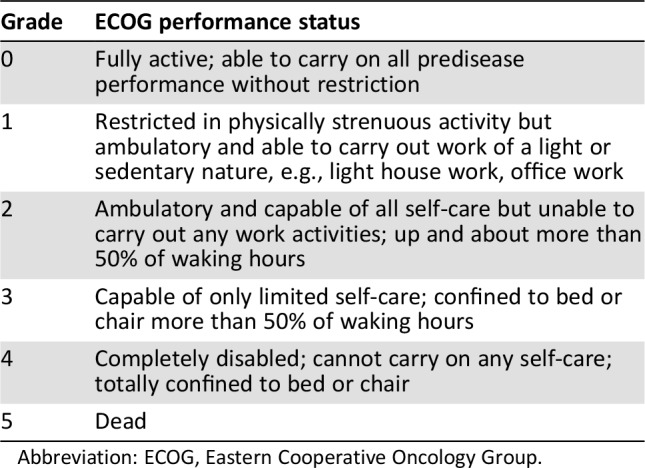
Abbreviation: ECOG, Eastern Cooperative Oncology Group.
Specific covariates collected included age, sex, race (self‐defined by patients as Non‐Hispanic white, Hispanic white, black or African American, Asian, or other), and preferred language (English or other). Treatment intents (“curative”/“palliative”) were collected based on charted documentation, as they were on the same day of the studied performance status evaluations. In cases in which intent could not be retrospectively determined, it was listed as “unclear.” Cancer stages were also collected based on clinician notes charted on the same day of the studied performance status evaluation. Cancer stages were grouped into one of four categories: stage 1, 2, 3, or 4 (for example, stage 3/3a/3b/3c were all classified as stage 3). In cases in which the stage could not be retrospectively determined, it was listed as unclear. All information was gathered by a single investigator from nursing and physician notes charted in our electronic medical record system. Integrity and accuracy of the obtained clinical outcomes data was then confirmed by a different investigator.
Statistical Analysis
Physician and nurse ECOG‐PS inter‐rater agreement was evaluated using the Cohen's κ coefficient, and correlation between these scores was calculated using the Spearman correlation test. A paired‐sample t test was used to compare the means of nurse and physician ECOG‐PS scores, and the chi‐square test was used to compare the difference in distributions of nurse and physician ECOG‐PS scores. Univariate logistic regression models were fit to evaluate the ability of nurse and physician ECOG‐PS scores, as well as of the nurse to physician score difference (calculated as nurse ECOG‐PS score minus physician ECOG‐PS score), to predict the occurrence of chemotherapy toxicity and hospitalizations within 1 month from ECOG‐PS ratings, as well as 6‐month mortality and hospice referrals. Based on the above logistic regressions, we calculated, for each of the clinical outcomes, the overall odds ratio (OR), which reflects the mean OR for every one‐point increase in nurse or physician ECOG‐PS score. We then calculated specific ORs for each ECOG‐PS score above 0, as compared with an ECOG‐PS score of 0. ORs for the nurse to physician ECOG‐PS score difference were similarly calculated, including the overall OR, as well as specific ORs for each nurse‐physician ECOG‐PS difference above −1, as compared with a difference of −1. For each reported OR, a 95% confidence interval (CI) was also calculated. The DeLong test was used to compare the areas under the curve (AUCs) for predicting capability of nurse vs physician ECOG‐PS scores. All analyses were performed in IBM SPSS Statistics, Version 24 (IBM, Armonk, NY). Analyses were two sided, with p values <.05 indicating statistical significance and p < .1 indicating marginal statistical significance.
Results
Participants
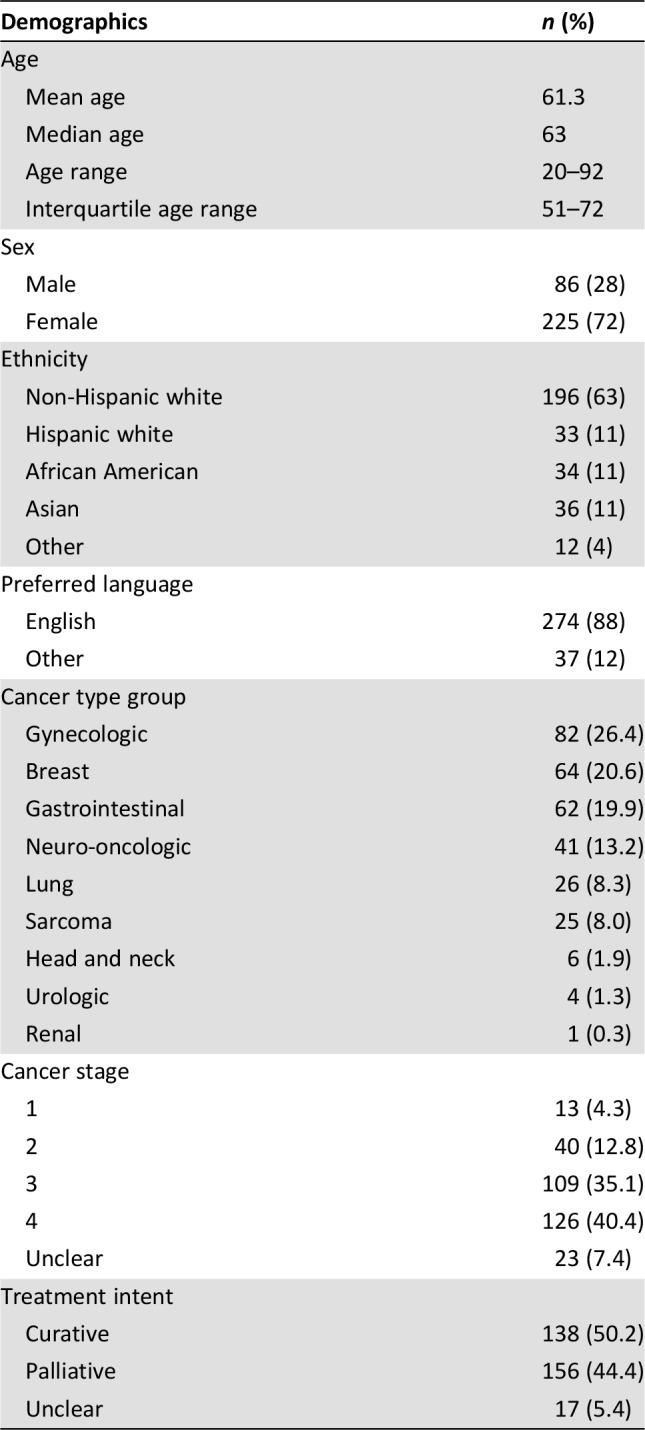
Participating patients included 86 men and 225 women (311 patients in total), with ages ranging from 20 to 92 years, a median age of 63, and an interquartile age range of 51–72. Most patients (63%) self‐identified as white, and 88% of the patients selected English as their preferred language. Participating patients’ cancer types were grouped into nine total cancer groups, most commonly gynecologic (26.4%), breast (20.6%), and gastrointestinal (19.9%). See Table 2 for full patient characteristics.
Table 2. Demographic and clinical characteristics.
Physician and Nurse ECOG‐PS Ratings
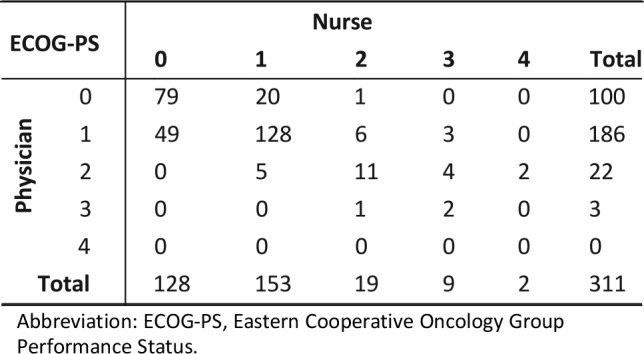
A total of 311 physician‐rated and 311 nurse‐rated ECOG‐PS scores were included in the study (one of each per patient). Physician oncologists and chemotherapy nurses had overall fair agreement in their ranking of participating patient's ECOG‐PS scores (70.7% of cases had physician‐nurse agreement; κ = 0.486, Spearman's correlation = 0.612; p < .001 for both). Mean physician ECOG‐PS score of 0.77 was higher than the mean nurse ECOG‐PS score of 0.73, but this difference was not statistically significant (t score = 1.25, p = .214). The distributions of nurse and physician ECOG‐PS scores were significantly different (chi‐square = 10.2, p = .037; see Table 3).
Table 3. Distribution of nurse and physician ECOG‐PS scores.
Abbreviation: ECOG‐PS, Eastern Cooperative Oncology Group Performance Status.
Correlations Between ECOG‐PS Scores and Clinical Outcomes
Within our study sample, a total of 30 patients (9.6%) had at least one hospitalization in our medical center within 1 month of the studied ECOG‐PS assessment, and 101 patients (32.5%) had a grade 3 or 4 chemotherapy toxicity event during the same period. Forty‐three (13.8%) patients died or were referred to hospice within 6 months of the studied ECOG‐PS assessment, 252 (81.0%) were still alive at this time point, and 16 (5.2%) has unknown status.
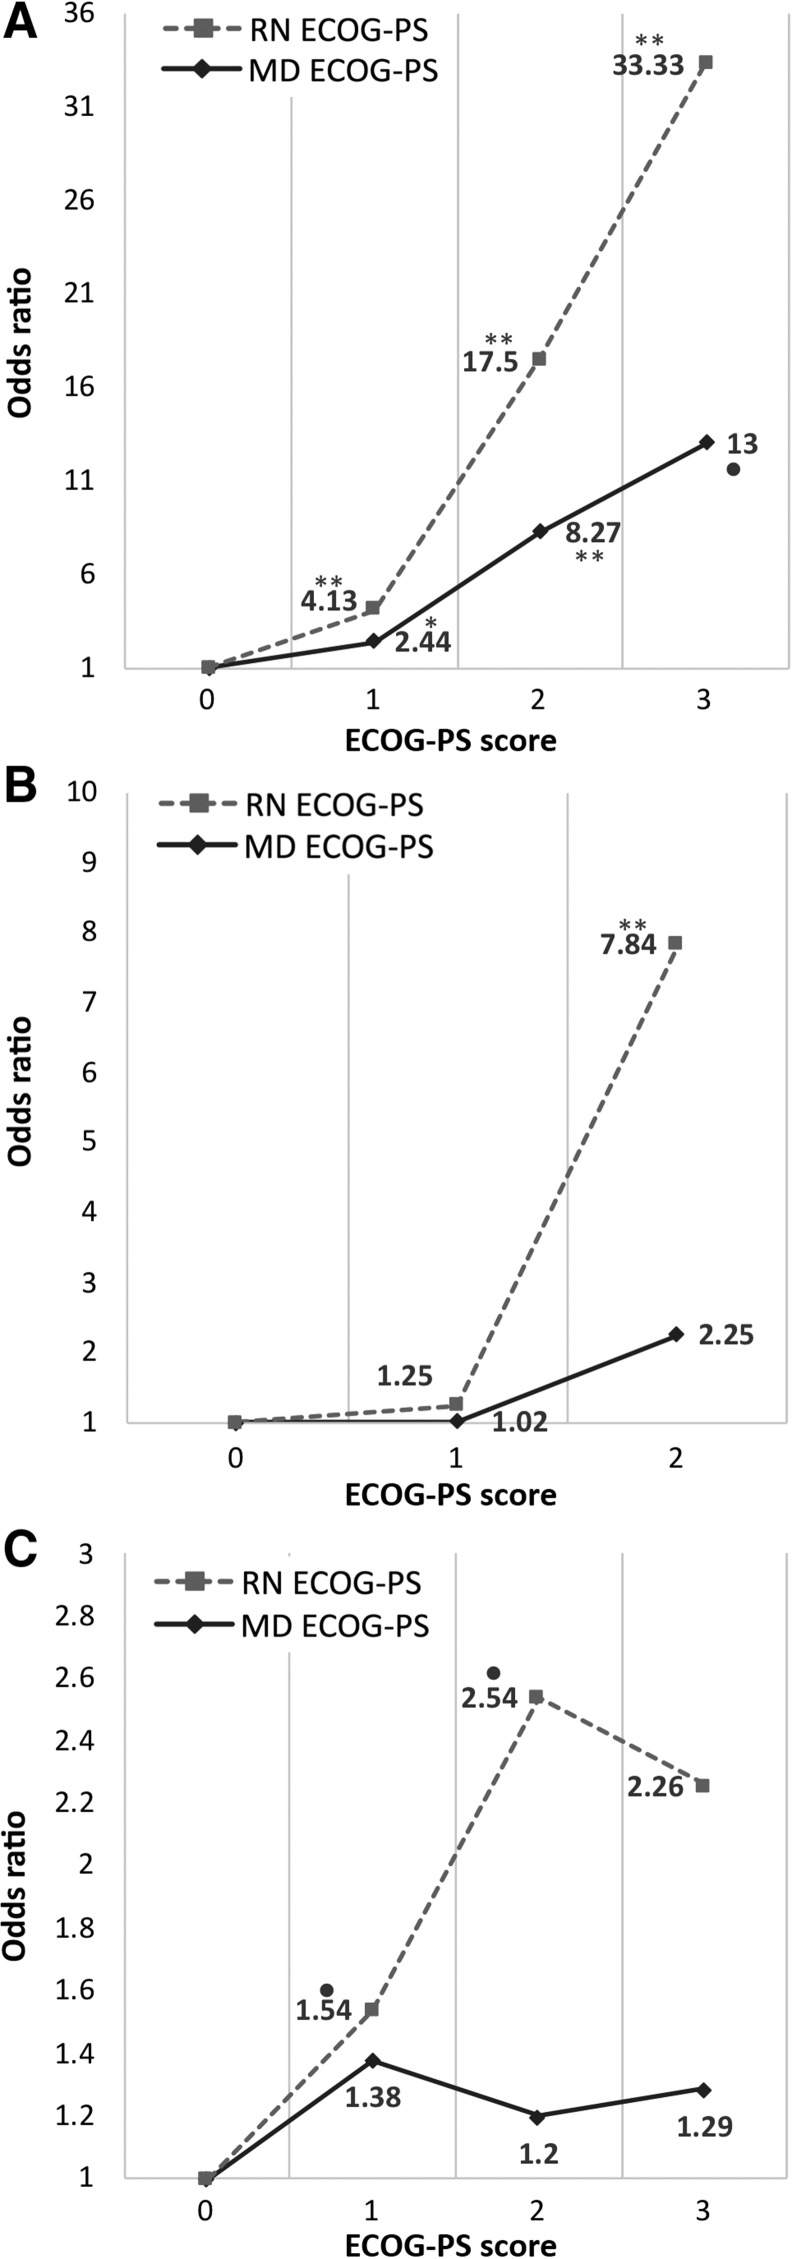
Nurse ECOG‐PS ratings were overall predictive of 1‐month grade 3–4 chemotherapy toxicity events (OR, 1.44; 95% CI, 1.06–1.96; p = .021). We then calculated specific ORs for 1‐month chemotherapy toxicity for each nurse ECOG‐PS score above 0. Compared with a nurse ECOG‐PS of 0, a nurse‐rated ECOG‐PS score of 1 was associated with an OR of 1.54 (95% CI, 0.92–2.57; p = .099). A nurse ECOG‐PS of 2 was associated with an OR of 2.54 (95% CI, 0.95–6.78; p = .063), and a nurse ECOG‐PS score of 3 had an OR of 2.26 (CI, 0.57–8.91; p = .244) for the same outcome. Physician‐rated ECOG‐PS scores were overall not significantly predictive of 1‐month grade 3–4 chemotherapy toxicity events (OR, 1.19; CI, 0.81–1.74; p = .388).
Nurse‐rated ECOG‐PS scores were significantly associated with 1‐month hospitalization rates overall (OR, 1.57; CI, 1.02–2.42; p = .041). Compared with a nurse ECOG‐PS of 0, a score of 1 had an OR of 1.25 (CI, 0.52–3.02; p = .623), and a score of 2 had an OR of 7.84 (CI, 2.48–24.8; p < .001). OR for nurse ECOG‐PS of 3 was not calculated, as only one patient who had this score was hospitalized. Physician‐rated ECOG‐PS scores were overall not significantly predictive of 1‐month hospitalizations (OR, 1.21; CI, 0.66–2.20; p = .543).
Both nurse‐ and physician‐rated ECOG‐PS scores were overall significantly predictive of 6‐month mortality or hospice referrals (for nurse: OR, 3.29; CI, 2.10–5.16; p < .0001; physician: OR, 2.71; CI, 1.54–4.76, p = .001). Compared with a nurse ECOG‐PS of 0, a nurse‐rated ECOG‐PS score of 1 was associated with an OR of 4.13 (CI, 1.64–10.43; p = .03), nurse ECOG‐PS of 2 had an OR of 17.5 (CI, 4.75–64.49; p < .0001), and a score of 3 had an OR of 33.33 (CI, 6.4–173.49; p < .0001) for this outcome. Physician ECOG‐PS score of 1 was associated with an OR of 2.44 (CI, 1.03–5.82; p = .044) compared with a score of 0, a score of 2 had an OR of 8.27 (CI, 2.44–28.03; p = .01), and a physician ECOG‐PS score of 3 was associated with an OR of 13.0 (CI, 0.732–230.76; p = .081; see Fig. 1).
Figure 1.
Odds ratios for each ECOG‐PS category, compared with ECOG‐PS = 0. Odds ratios for 6‐month mortality and hospice (A), 1‐month hospitalization (B), and 1‐month chemotoxicity (C). •, p < .1; *, p < .05; **, p < .01.
Abbreviations: ECOG‐PS, Eastern Cooperative Oncology Group Performance Status; MD, physician; RN, nurse.
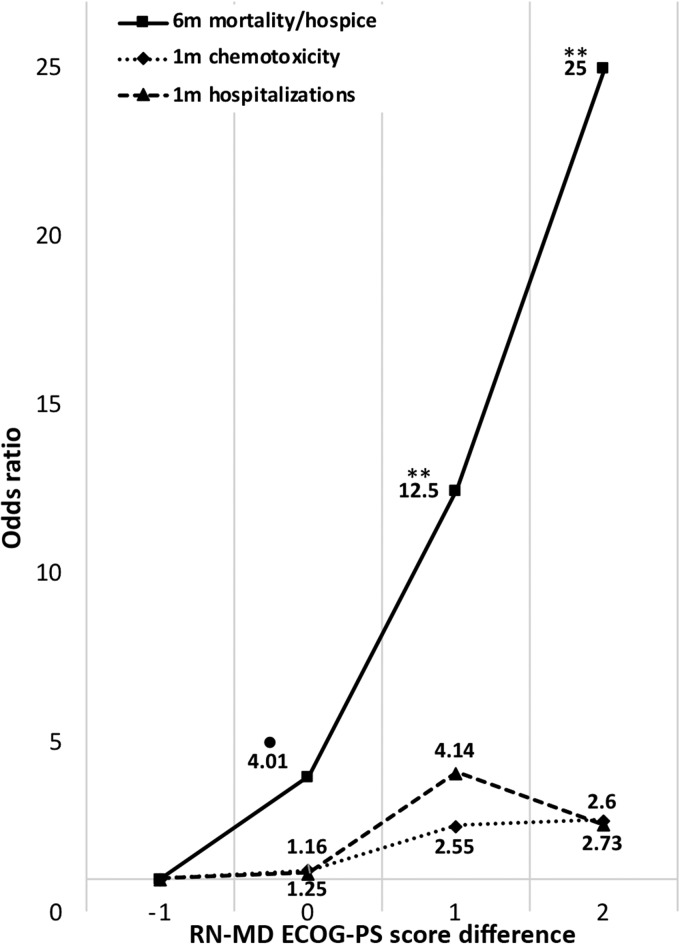
The magnitude of difference between nurse and physician ECOG‐PS scores was also overall predictive of 1‐month chemotherapy toxicity (OR, 1.51; CI, 1.01–2.27; p = .045), 1‐month hospitalization (OR, 1.86; CI, 1.04–3.39; p = .037), and 6‐month mortality or hospice referral (OR, 2.99; CI, 1.74–5.15; p < .0001). See Figure 2 for specific ORs for each nurse‐physician ECOG‐PS score difference, compared with a baseline difference (nurse minus physician ECOG‐PS score) of −1.
Figure 2.
Odds ratios for 6‐month mortality and hospice, 1‐month chemotherapy toxicity, and 1‐month hospitalizations for each nurse‐physician ECOG‐PS difference (nurse minus physician ECOG‐PS score), compared with a baseline difference of −1. •, p < .1; *, p < .05; **, p < .01.
Abbreviations: ECOG‐PS, Eastern Cooperative Oncology Group Performance Status; m, month; MD, physician; RN, nurse.
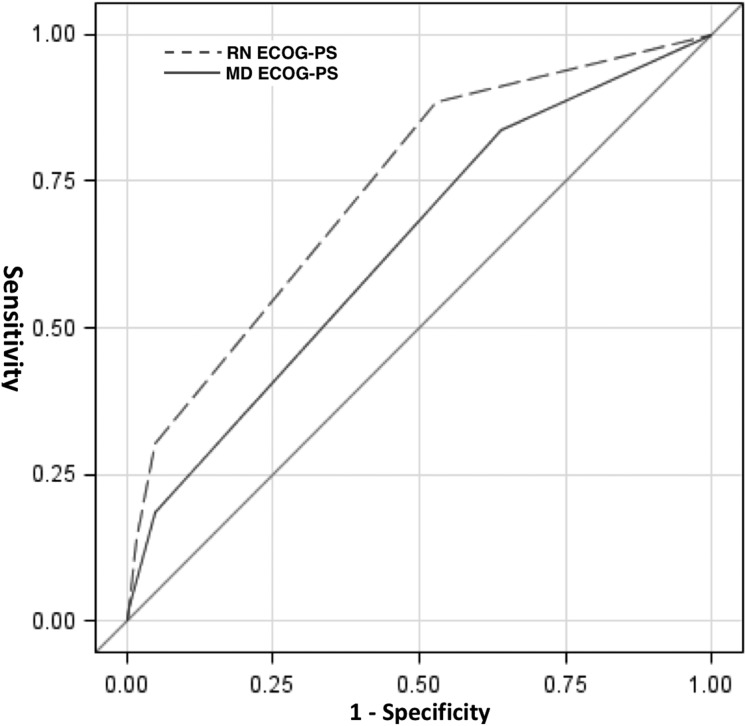
Because both nurse and physician ECOG‐PS scores were significantly predictive of 6‐month mortality/hospice referral, we prepared receiver‐operator curves for nurse and physician‐ranked ECOG‐PS scores and used the DeLong test to compare them. AUC for physician ECOG‐PS was 0.61, compared with nurse ECOG‐PS, which had an AUC of 0.71; this difference was statistically significant (chi square = 9.18, p = .025; see Fig. 3).
Figure 3.
Receiver‐operator curves for nurse and physician ECOG‐PS scores as predictors of 6‐month mortality/hospice referral.
Abbreviations: ECOG‐PS, Eastern Cooperative Oncology Group Performance Status; MD, physician; RN, nurse.
Discussion
Oncologists and other health providers of patients with cancer frequently rely on performance status assessments to make important clinical decisions, including initiation, continuation, and modification of chemotherapy and other therapies; prognosticating; and even shaping the goals of care in the palliative setting. The use of such a simple and convenient, yet somewhat crude, tool in making crucial, ethically charged medical decisions relies on the premise that it faithfully reflects the functional status of the patient and is in fact prognostic of important clinical outcomes. Indeed, as discussed above, numerous studies have shown that both the ECOG‐PS and KPS scales are strongly associated with these outcomes and can be used to direct medical decision making.
In this study, we showed that ECOG‐PS scores are more predictive of 1‐month chemotherapy toxicity, 1‐month hospitalizations, and 6‐month mortality or hospice referrals when they are rated by a nurse rather than by a physician‐oncologist. This finding is especially striking when taking into account the overall fair agreement in ECOG‐PS ratings between physicians and nurses in our study and the fact that the mean ECOG‐PS scores were similar. An additional novel finding of importance in this study was that disagreement between physician and nurse ECOG‐PS rating, but only when the physician gave healthier (lower) scores, is in itself predictive of poor prognosis in all three studied clinical outcomes. More so, this effect was in proportion to the extent of disagreement between nurse and physician ECOG‐PS scores.
There are multiple hypothetic explanations to the stronger correlations of nurse ECOG‐PS ratings with the three measured clinical outcomes. First, oncologists tend to see each patient for brief, frequent encounters over months and years. Their appreciation of the patient's current functional status may be tainted by their long‐term familiarity with the patient, such that their assessment may reflect a prior, or more “average” performance status. Indeed, increased duration of doctor‐patient relationships was previously reported to be associated with worse prognostic accuracy [12]. Chemotherapy nurses in our medical center, in contrast, have less continuity with specific patients, as they are rotated within the infusion center and are not present for the regular oncologist‐patient clinic interactions. Their assessment of each patient's functional status therefore does not rely on an established “gestalt” and requires an active assessment on every visit. Additionally, nurses may be more adept than physicians at assessing important aspects of care that interact with performance status and our studied clinical outcomes. For example, it was shown that self‐reported symptoms [13], [14], [15], [16], quality of life [17], and perceptions about the impact of cancer and chemotherapy [18] of patients with cancer were typically closer to evaluations made by nurses than to those made by physicians. This is important because self‐reported health, performance status, and symptoms of patients with cancer have been previously shown to strongly predict mortality [19], [20], [21] and chemotherapy benefit and toxicity [22], and integration of patient‐reported outcomes in clinical care of patients with cancer has also been shown to improve overall survival [23].
Another potential explanation for our primary findings emerges from the fact that it is physicians, and not nurses, who are required to make crucial decisions and direct patient care. Oncologists may inadvertently be more hesitant to give their patient a low performance status score, which may have significant implications on the treatment approach. Similarly, when meeting with their physicians, patients may try to dissimulate their symptoms because of denial, trying to please the physician, or fear that admitting to their true functional status may alter the treatment approach and take away their perceived chance of cure or prolonged life. This possible explanation is supported by the nearly consistent finding in the literature that physicians tend to rate their patients’ performance status higher than nurses do [9]; however, this specific finding was not replicated in our study.
Our study involved more than 300 patients with a wide variety of solid malignancies, as well as diverse demographic features, cancer stages, and treatment intents. Participating patients’ performance status was evaluated independently by 32 different oncologists (both academic and private) and 41 chemotherapy nurses. This suggests that our findings are less likely to be limited to specific providers, nor to specific cancer types or demographics. An additional strength of our study lies in its simple design and easy reproducibility to other cancer centers and study populations.
However, our study is not without limitations. First, the study only enrolled patients who were able to receive chemotherapy, thus restricting the range of the studied population to patients with more favorable performance status (the vast majority of our sample had an ECOG of 2 or less). Additionally, we focused on patients with cancer who actually required chemotherapy and, more specifically, regimens administered in our infusion center, rather than regimens given at home (i.e., oral regimens) or regimens requiring hospitalization. Thus, although our study population likely represents a sizable portion of oncologic patients, it tends to exclude the patients with the most favorable performance status (e.g., those with less aggressive tumors not requiring infused chemotherapy), as well as those with the worst performance status (e.g., those not able to receive chemotherapy, or those requiring hospitalization for it). Nevertheless, one can argue that our studied population can be generalized to patients for whom obtaining an accurate and prognostic performance status rating can have a greater importance in clinical decision making. In other words, it is those patients with “middle‐range” performance status who can benefit most from a more objective, accurate, and clinically relevant assessment of their performance status.
Regardless of the person making the assessment, a fundamental flaw in assessing performance status with numeric scales, such as KPS and ECOG‐PS, is the subjective nature and potential for bias and error in these evaluations. Additionally, ECOG‐PS and similar performance status scales assess functionality at a moment in time during the clinic visit but do not capture the patient's performance status longitudinally outside the clinic. One important strategy to improve performance status assessments and clinical outcomes that has gained significant attention in recent years is to incorporate patient‐reported outcomes into the clinical assessment and decision making in oncology [23]. In addition, recently, there has been an increased interest in obtaining more objective and quantifiable measures of performance status [4], [24]. For example, a recent study in our medical center tested the use of wearable activity monitors (e.g., Fitbit watches; Fitbit, San Francisco, CA) as a measure of performance status in patients with cancer. It was shown that the daily number of steps and floors climbed significantly correlated with patient‐reported physical functioning, pain, fatigue, sleep, and emotional state [25]. More importantly, the number of steps, floors climbed, and daily sleep duration significantly correlated with 1‐month chemotherapy toxicity and hospitalizations and 6‐month mortality [26]. Although currently no single measure can perfectly assess patients’ true performance status, these emerging technologies not only offer a convenient and relatively accurate assessment but also may take away a significant portion of the inherent subjectivity, bias, and emotional burden of using numeric performance status scales.
Conclusion
Overall, our findings suggest that ECOG‐PS scales have stronger associations to important clinical outcomes when they are rated by nurses rather than physicians. Physician‐nurse disagreement in ECOG‐PS scoring, when present, should warrant further assessment, as it was found to predict worse outcomes. It may be daunting to consider that the long‐term patient‐physician relationship may not be of benefit or actually become an obstacle to obtaining an objective assessment of the patient's performance status, thus potentially resulting in harmful decision making. Yet our findings do suggest a simple, inexpensive, and easy‐to‐implement intervention, namely, allowing nurses to evaluate patients’ performance status instead of or, preferably, in addition to physicians. The inclusion of nurse‐rated performance status can therefore assist palliative care and oncology providers in making more accurate prognostication and to be better informed when considering treatment options and goals of care.
Author Contributions
Conception/design: Elad Neeman, Gillian Gresham, Arvind Shinde
Provision of study material or patients: Andrew Hendifar, Richard Tuli, Robert Figlin
Collection and/or assembly of data: Elad Neeman, Navard Ovasapians, Arvind Shinde
Data analysis and interpretation: Elad Neeman, Gillian Gresham, Arvind Shinde
Manuscript writing: Elad Neeman, Gillian Gresham, Andrew Hendifar, Richard Tuli, Robert Figlin, Arvind Shinde
Final approval of manuscript: Elad Neeman, Gillian Gresham, Navard Ovasapians, Andrew Hendifar, Richard Tuli, Robert Figlin, Arvind Shinde
Disclosures
The authors indicated no financial relationships.
References
- 1.Atkinson TM, Andreotti CF, Roberts KE et al. The level of association between functional performance status measures and patient‐reported outcomes in cancer patients: A systematic review. Support Care Cancer 2015;23:3645–3652. [DOI] [PMC free article] [PubMed] [Google Scholar]
- 2.Sargent DJ, Köhne CH, Sanoff HK et al. Pooled safety and efficacy analysis examining the effect of performance status on outcomes in nine first‐line treatment trials using individual data from patients with metastatic colorectal cancer. J Clin Oncol 2009;27:1948–1955. [DOI] [PMC free article] [PubMed] [Google Scholar]
- 3.Chow E, Harth T, Hruby G et al. How accurate are physicians’ clinical predictions of survival and the available prognostic tools in estimating survival times in terminally ill cancer patients? A systematic review. Clin Oncol (R Coll Radiol) 2001;13:209–218. [DOI] [PubMed] [Google Scholar]
- 4.Kelly CM and Shahrokni A. Moving beyond Karnofsky and ECOG performance status assessments with new technologies. J Oncol 2016;2016:6186543. [DOI] [PMC free article] [PubMed] [Google Scholar]
- 5.Karnofsky DA, Abelmann WH, Craver LF et al. The use of the nitrogen mustards in the palliative treatment of carcinoma: With particular reference to bronchogenic carcinoma. Cancer 1948;1:634–656. [Google Scholar]
- 6.Oken MM, Creech RH, Tormey DC et al. Toxicity and response criteria of the Eastern Cooperative Oncology Group. Am J Clin Oncol 1982;5:649–655. [PubMed] [Google Scholar]
- 7.Taylor AE, Olver IN, Sivanthan T et al. Observer error in grading performance status in cancer patients. Support Care Cancer 1999;7:332–335. [DOI] [PubMed] [Google Scholar]
- 8.Krishnan M, Temel JS, Wright AA et al. Predicting life expectancy in patients with advanced incurable cancer: A review. J Support Oncol 2013;11:68–74. [DOI] [PubMed] [Google Scholar]
- 9.Chow R, Chiu N, Bruera E et al. Inter‐rater reliability in performance status assessment among health care professionals: A systematic review. Ann Palliat Med 2016;5:83–92. [DOI] [PubMed] [Google Scholar]
- 10.Shinde AM, Dashti A, Makoff E et al. MD and RN ECOG‐PS assessments prior to chemotherapy and concordance rates: A quality initiative at a comprehensive cancer center. J Clin Oncol 2016;34:228a. [Google Scholar]
- 11.U.S. Department of Health and Human Services . Common Terminology Criteria for Adverse Events v4.0. NIH publication no. 09‐7473. National Cancer Institute; 2009.
- 12.Christakis NA, Lamont EB. Extent and determinants of error in physicians’ prognoses in terminally ill patients: Prospective cohort study. West J Med 2000;172:310–313. [DOI] [PMC free article] [PubMed] [Google Scholar]
- 13.Nekolaichuk CL, Bruera E, Spachynski K et al. A comparison of patient and proxy symptom assessments in advanced cancer patients. Palliat Med 1999;13:311–323. [DOI] [PubMed] [Google Scholar]
- 14.Ewing G, Rogers M, Barclay S et al. Palliative care in primary care: A study to determine whether patients and professionals agree on symptoms. Br J Gen Pract 2006;56:27–34. [PMC free article] [PubMed] [Google Scholar]
- 15.Laugsand EA, Sprangers MA, Bjordal K et al. Health care providers underestimate symptom intensities of cancer patients: A multicenter European study. Health Qual Life Outcomes 2010;8:104. [DOI] [PMC free article] [PubMed] [Google Scholar]
- 16.Cirillo M, Venturini M, Ciccarelli L et al. Clinician versus nurse symptom reporting using the National Cancer Institute‐Common Terminology Criteria for Adverse Events during chemotherapy: Results of a comparison based on patient's self‐reported questionnaire. Ann Oncol 2009;20:1929–1935. [DOI] [PubMed] [Google Scholar]
- 17.Sneeuw KC, Aaronson NK, Sprangers MA et al. Evaluating the quality of life of cancer patients: Assessments by patients, significant others, physicians and nurses. Br J Cancer 1999;81:87–94. [DOI] [PMC free article] [PubMed] [Google Scholar]
- 18.Mulders M, Vingerhoets A, Breed W. The impact of cancer and chemotherapy: Perceptual similarities and differences between cancer patients, nurses and physicians. Eur J Oncol Nurs 2008;12:97–102. [DOI] [PubMed] [Google Scholar]
- 19.Shadbolt B, Barresi J, Craft P. Self‐rated health as a predictor of survival among patients with advanced cancer. J Clin Oncol 2002;20:2514–2519. [DOI] [PubMed] [Google Scholar]
- 20.Quinten C, Maringwa J, Gotay CC et al. Patient self‐reports of symptoms and clinician ratings as predictors of overall cancer survival. J Natl Cancer Inst 2011;103:1851–1858. [DOI] [PMC free article] [PubMed] [Google Scholar]
- 21.Suh SY, Leblanc TW, Shelby RA et al. Longitudinal patient‐reported performance status assessment in the cancer clinic is feasible and prognostic. J Oncol Pract 2011;7:374–381. [DOI] [PMC free article] [PubMed] [Google Scholar]
- 22.Lee CK, Stockler MR, Coates AS et al. Self‐reported health‐related quality of life is an independent predictor of chemotherapy treatment benefit and toxicity in women with advanced breast cancer. Br J Cancer 2010;102:1341–1347. [DOI] [PMC free article] [PubMed] [Google Scholar]
- 23.Basch E, Deal AM, Dueck AC et al. Overall survival results of a trial assessing patient‐reported outcomes for symptom monitoring during routine cancer treatment. JAMA 2017;318:197–198. [DOI] [PMC free article] [PubMed] [Google Scholar]
- 24.Gresham G, Schrack J, Gresham LM et al. Wearable activity monitors in oncology trials: Current use of an emerging technology. Contemp Clin Trials 2018;64:13–21. [DOI] [PMC free article] [PubMed] [Google Scholar]
- 25.Shinde AM, Gresham GK, Hendifar AE et al. Correlating wearable activity monitor data with PROMIS detected distress and physical functioning in advanced cancer patients. J Clin Oncol 2017;35(suppl):e21689a. [Google Scholar]
- 26.Gresham GK, Neeman E, Hendifar AE et al. Assessing performance status and clinical outcomes with wearable activity monitors. J Clin Oncol 2017;35(suppl):6571a. [Google Scholar]


