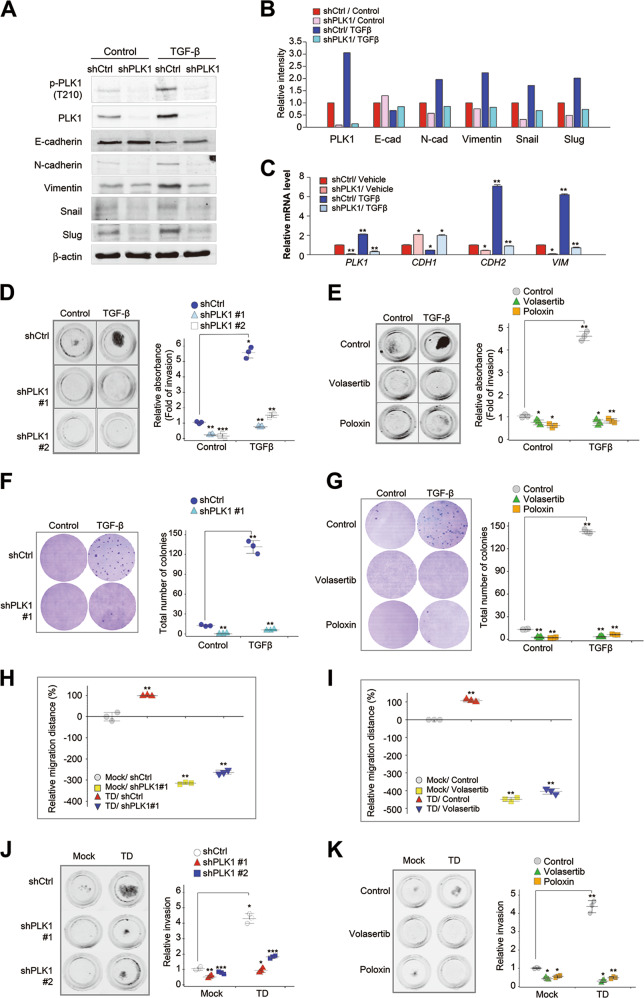
Fig. 3.
Loss of PLK1 activity blocks pro-tumorigenic and pro-metastatic activity induced by active PLK1 or TGF-β. a–c A549 cells were infected by lentiviral PLK1 shRNA #1 and then treated with TGF-β for 48 h. a Immunoblot analyses were performed using anti-PLK1, anti-pT210-PLK1, anti-N-cadherin, anti-E-cadherin, anti-vimentin, anti-snail, anti-slug, and anti-β−actin. b The band intensity values were quantified using LI-COR Odyssey software (Li-COR Biosciences), normalized, and plotted. c qRT-PCR was performed for PLK1, CDH1, CDH2, and VIM in A549 cells with depleted PLK1. *p < 0.05; **p < 0.01; ***p < 0.001 (n = 3). Data presented as mean ± SD. d A549 cells were infected by lentiviral PLK1 shRNA #1 (shPLK1#1) and #2 (shPLK1#2) and then treated with TGF-β. The cells that had been invaded on the bottom layer surface were stained with 0.05% crystal violet dye, and the relative absorbance was plotted. (n = 3). e An invasion assay was performed in TGF-β-treated A549 cells after treatment with the PLK1 inhibitors volasertib and poloxin for 5 days. The absorbance was measured at a wavelength of 590 nm, and the relative absorbance was plotted. (n = 3). Data presented as mean ± SD. f A colony formation assay was performed with A549 cells depleted of PLK1, as described in the Materials and Methods. After 4 weeks, the colonies formed in agar were counted after 0.05% crystal violet staining. *p < 0.05; **p < 0.01; ***p < 0.001. (n = 3). Data presented as mean ± SD. g A colony formation assay was performed in TGF-β-treated A549 cells after treatment with the PLK1 inhibitors volasertib and poloxin. After 4 weeks, the colonies formed in agar were counted after 0.05% crystal violet staining. *p < 0.05; **p < 0.01; ***p < 0.001. (n = 3). Data presented as mean ± SD. h–i A549 cells expressing eRFP-tagged TD were treated with h shRNA targeting human PLK1 or i volasertib, and an in vitro wound-healing assay was performed 72 h after treatment. The relative migration distance was measured and plotted. *p < 0.05; **p < 0.01; ***p < 0.001. (n = 3). j–k An invasion assay was performed using A549 cells expressing eRFP-tagged TD after treatment with j shRNA for PLK1 #1 or #2 k volasertib and poloxin. The relative absorbance was measured and plotted. *p < 0.05; **p < 0.01; ***p < 0.001. (n = 3)

