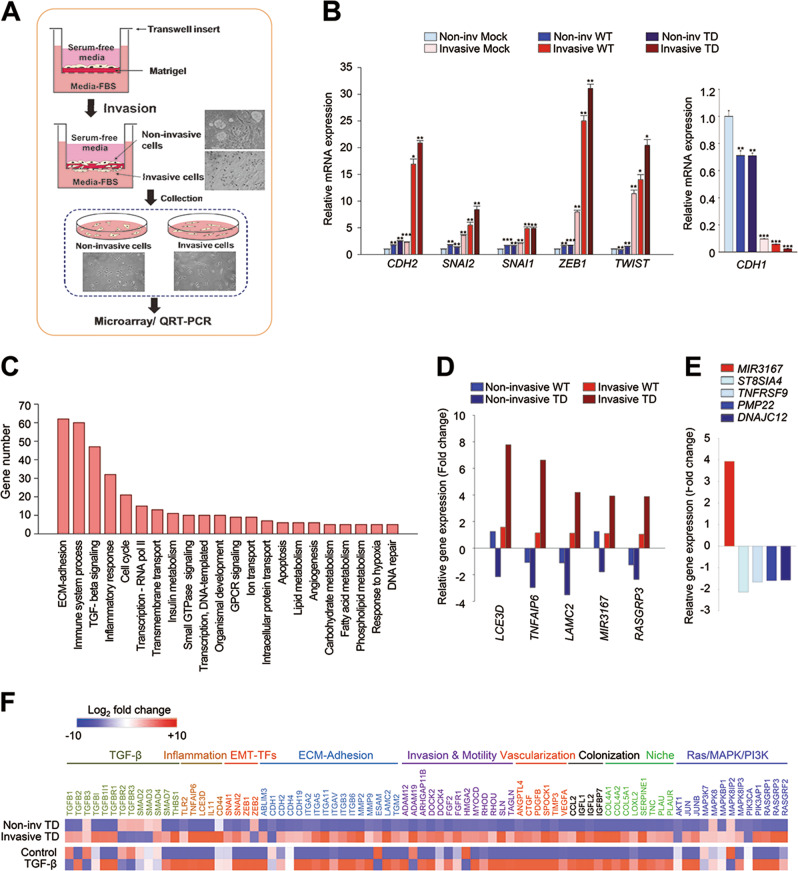
Fig. 5.
TGF-β signaling is upregulated in PLK1-driven invasive cells. a Three-dimensional culture scheme for invasive cells. b qRT-PCR was performed for CDH1, CDH2, SNAI1, SNAI2, ZEB1, and TWIST in invasive and non-invasive A549 cells expressing WT or TD-PLK1. *p < 0.05; **p < 0.01; ***p < 0.001. c Analysis of transcriptome data for gene probes with significant fold changes (>1.5) in the invasive cells expressing TD. The significant genes were categorized using the KEGG pathway. The top 20% of the 117 pathways are displayed. d Relative gene expression profile of the top five genes in invasive and non-invasive cells expressing WT and TD, respectively. e Relative gene expression profile of the targets of miRNA 3167 (ST8SIA4, TNFRSF9, PMP22, and DNAJC12) in invasive cells expressing TD. f Transcriptome comparison between the gene profiles of invasive and non-invasive A549 cells expressing TD and gene profiles of TGF-β-induced mesenchymal A549 cells (GSE 46024). The MORPHEUS program was used to visualize the expression levels of genes related to TGF-β signaling, Ras/MAPK/PI3K signaling, transcriptional factors of the EMT, ECM-adhesion, invasion, motility, vascularization, colonization, and niche in non-invasive and invasive A549 cells expressing active PLK1 (TD) and in the published transcriptome of TGF-β-treated A549 cells (GSE 46024)

