

Abstract
Background and Purpose
T helper cell 1 (Th1)‐skewed neurotoxicity contributes to the poor outcome of stroke in rodents. Here, we have elucidated the mechanism of the Th1/Th2 shift in acute ischaemic stroke (AIS) patients at hyperacute phase and have looked for a miRNA‐based therapeutic target.
Experimental Approach
MiR‐494 levels in blood from AIS patients and controls were measured by real‐time PCR. C57BL/6J mice were subjected to transient middle cerebral artery occlusion, and cortical neurons were subjected to oxygen–glucose deprivation. Luciferase reporter system, chromatin immunoprecipitation sequencing (ChIP‐Seq), and ChIP‐PCR were used to uncover possible mechanisms.
Key Results
In lymphocytes from AIS patients, there was a Th1/Th2 shift and histone deacetylase 2 (HDAC2) was markedly down‐regulated. ChIP‐seq showed that HDAC2 binding sites were enriched in regulation of Th1 cytokine production, and ChIP‐PCR confirmed that HDAC2 binding was changed at the intron of STAT4 and the promoter of T‐box transcription factor 21 (T‐bet) in lymphocytes from AIS patients. MiR‐494 was the most significantly increased miRNA in lymphocytes from AIS patients, and miR‐494‐3p directly targeted HDAC2. A strong association existed between miR‐494 and Th1 cytokines, and neurological deficit as measured by the National Institute of Health Stroke Scale (NIHSS) in AIS patients. In vitro and in vivo experiments showed that antagomir‐494 reduced Th1 shift‐mediated neuronal and sensorimotor functional damage in the mouse model of ischaemic stroke, via the HDAC2‐STAT4 pathway.
Conclusion and Implications
We demonstrated that miR‐494 inhibition prevented Th1‐skewed neurotoxicity through regulation of the HDAC2‐STAT4 cascade.
1. What is already known
There is a Th2 to Th1 shift in lymphocytes from rodent models of stroke.
HDAC2 forms a repressive complex with GATA‐3 in Th2 cells.
2. What this study adds
HDAC2 regulated Th1/Th2 balance through binding intragenic regions of STAT4 in ischaemic stroke patients.
Silencing of miR‐494 impairs neurotoxic Th1 shift via regulating HDAC2‐STAT4 cascade in ischaemic stroke.
3. What is the clinical significance
Intravenous delivery of antagomiR‐494 prevents neurological deficits following ischemic stroke, identifying a potential target.
Mechanism of miR‐494/HDAC2/STAT4 axis‐induced Th1 shift provides insights into other conditions of Th1/Th2 imbalance.
Abbreviations
- AIS
acute ischaemic stroke
- ChIP‐Seq
chromatin immunoprecipitation sequence
- HDAC2
histone deacetylase 2
- OGD
oxygen–glucose deprivation
- T‐bet
T‐box transcription factor
- Th1
T helper 1 cell
- Th2
T helper 2 cell
1. INTRODUCTION
Stroke is one of the major causes of death and long‐term disability worldwide with about 80% of cases attributed to ischaemia. Currently, the only effective treatments for acute ischaemic stroke (AIS) are thrombolysis and thrombectomy, which can only be applied to a minority of patients due to its time window constraint (Bigi et al., 2018; Wendelboe & Raskob, 2016). Widely applicable therapeutic approaches against AIS are urgently needed. The failed clinical translation of numerous neuroprotective agents in stroke therapy is partly due to the fact that most therapeutic targets are identified by experiments on the molecular mechanism of cerebral ischaemic animals, not pathogenesis of humans (Ward, 2017). To bridge the gap between animals and humans, we started to investigate potential targets in immune cells from AIS patients.
Previous clinical studies with drugs blocking cerebral invasion of neutrophils failed to show positive outcomes in AIS patients (Catanese, Tarsia, & Fisher, 2017). Recently, a critical role of T cells becomes more evident. https://www.guidetopharmacology.org/GRAC/LigandDisplayForward?ligandId=2407, which acts as a modulator of the https://www.guidetopharmacology.org/GRAC/FamilyDisplayForward?familyId=135 and inhibits the egress of lymphocytes from lymph nodes and limits their recirculation, enhanced the efficacy of alteplase administration in AIS patients (Tian et al., 2018). At present, a strategy to reduce cerebral injury by raising the proportion of neuroprotective CD4 + T‐cell subset of regulatory T cells (Treg; Joly et al., 2018; Mao et al., 2017; Zhang et al., 2018) and T helper 2 cells (Th2) (Korhonen et al., 2015) shows promising results in rodents. In patients with stroke, the number of circulating Tregs was reduced after stroke onset (Mao et al., 2017). In rodent models, stroke in C57BL/6J mice skew towards Th1 inflammatory responses, while stroke in BALB/c mice skews towards Th2 inflammatory responses (Nguyen et al., 2016). Additionally, stroke triggered a prolonged Th2‐skewed immunity in patients at the chronic stable phase (Theodorou et al., 2008; Wong et al., 2017). However, the shift of pro‐ (Th1) and anti‐inflammatory (Th2) cells in AIS patients at the hyperacute phase remains unclear. Understanding the phenotypic shift of Th1/Th2 and its underlying mechanism(s) in AIS patients at the hyperacute phase is crucial for neuroprotective treatment in the early stage of ischaemia.
Broad‐spectrum inhibitors of histone deacetylases (https://www.guidetopharmacology.org/GRAC/ObjectDisplayForward?objectId=2616) have been demonstrated to regulate Treg function and the phenotypic shift of macrophage/microglia in ischaemic stroke (Wang et al., 2015; Wang et al., 2017). Nevertheless, there is an ongoing debate about the role of https://www.guidetopharmacology.org/GRAC/ObjectDisplayForward?objectId=2616 in phenotypic transformation of immune cells. HDAC2 was up‐regulated in nigral microglia in Parkinson's disease patients (Tan et al., 2018) and formed an epigenetic blockade in microglia and prevented its beneficial effects in the brain (Mathys, Penney, & Tsai, 2018). HDAC2 also forms repressive complex with GATA binding protein 3 (GATA‐3) in Th2 cells (Hosokawa et al., 2016; Omori et al., 2003). By contrast, HDAC2 activity switched off activated inflammatory genes in patients with chronic obstructive pulmonary disease. So far, whether and how HDAC2 is involved in Th1‐Th2 shift in AIS patients is unknown. The microRNAs (miRs) offer reversible gene inactivation strategies (Cheng et al., 2017; Sun et al., 2017), and miRs treatment via intravenous infusion has entered clinical appraisal (Janssen et al., 2013; van Zandwijk et al., 2017). It is feasible to seek new therapeutic targets from endogenous miRs which change significantly and target HDAC2 in lymphocytes of AIS patients.
The aim of the current study was to (a) assess whether there is a shift in the Th1/Th2 balance in AIS patients, (b) investigate the involvement and underlying mechanism of HDAC2 in Th1/Th2 balance of AIS patients, (b) screen out and identify the most significantly changed miRNA targeting HDAC2 in lymphocytes of AIS patients through microarray analysis, and (d) investigate whether miRNA influences Th1/Th2 shift and neurological deficit in mouse models of experimental stroke, through targeting HDAC2.
2. METHODS
2.1. Clinical subjects
Patients were recruited at the Xuanwu Hospital, the First Clinical Medical College of Capital Medical University. Approval for studies on human blood samples was obtained from the Medical Ethics Committee of the Xuanwu Hospital, Capital Medical University, Beijing and registered with http://ClinicalTrials.gov (NCT03577093). AIS patients (n = 50) within 6 hr after onset of stroke symptoms were included in this study. Upon admission, the patients underwent standard neurological and general medical evaluations and assessments using the National Institute of Health Stroke Scale (NIHSS) score at admission, and ischaemic stroke was diagnosed in accordance with guidelines. The inclusion criteria and exclusion criteria were described previously (Wang et al., 2017). Age‐ and sex‐matched healthy controls (n = 45) without neurological deficit were recruited from the Medical Examination Center.
2.2. Separation of lymphocytes
Venous blood samples from AIS patients and controls were collected into an EDTA anticoagulant vacuum tube by venepuncture for routine lab assays. Lymphocytes were separated by a standard Ficoll‐Paque Plus gradient method.
2.3. Real‐time RT‐PCR
Purified RNA from lymphocytes were used as a template to synthesize cDNA using oligo‐d (T) primers and SuperScript III/RNaseOUT Enzyme Mix (Invitrogen, Carlsbad, CA, USA). For miR quantification, total RNA was purified using RNeasy Mini Kit (Qiagen, Gaithersburg, MD, USA). miRs abundance was assessed by qRT‐PCR using All‐in‐One miR qRT‐PCR Reagent Kits. Relative gene expression was calculated via the 2−ΔΔCT method, normalized, and expressed as fold change relative to U6 or β‐actin. RT‐PCR was performed in triplicate. Primer sequences are provided in Table 1.
Table 1.
Primers for real‐time PCR
| Gene name | Forward (5′‐3′) | Reverse (5′‐3′) | Application |
|---|---|---|---|
| Hsa‐miR‐494 | GGGAGGTTGTCCGTGTTGT | GTGCGTGTCGTGGAGTCG | RT‐PCR |
| Hsa‐HDAC2 | CCATAAAGGGTGCCAGGTCT | AGGCCAGTGGGAAGGTACG | RT‐PCR |
| Hsa‐IFN‐γ | TCAGATGTAGCGGATAATGGAA | ATGTATTGCTTTGCGTTGGAC | RT‐PCR |
| Hsa‐IL‐4 | ATATTTTAATTTATGAGTTTTTGAT | CTATATATACTTTATTTTATGATGAG | RT‐PCR |
| Hsa‐STAT4 | TGAGATACCACCTTACTCCTGCG | ACTACATCCATGCCAGCGTCT | ChIP‐PCR |
| Hsa‐Tet | CTCCGTGTCCCTCACTGCTT | CACTCACCCGTCTCCCTTGT | ChIP‐PCR |
| Mmu‐miR‐494 | GGGAGGTTGTCCGTGTTGT | GTGCGTGTCGTGGAGTCG | RT‐PCR |
| β‐actin(H) | GTGGCCGAGGACTTTGATTG | CCTGTAACAACGCATCTCATATT | RT‐PCR |
| U6 | GCTTCGGCAGCACATATACTAAAAT | CGCTTCACGAATTTGCGTGTCAT | RT‐PCR |
2.4. ChIP‐Seq and ChIP‐PCR
The lymphocytes of AIS patients was cross‐linked in 1% formaldehyde at room temperature for 20 min. ChIP samples from three controls and three patients were pooled for library construction and NGS using Illumina Genome Analyzer IIx. Then the whole cell extracts were sonicated before immunoprecipitation with HDAC2 antibody (Abcam, Cat#7029). The purity and concentration of DNA samples were determined with Qubit® Fluorometer. DNA samples were end‐repaired, A‐tailed, and adaptor‐ligated using TruSeq Nano DNA Sample Prep Kit (FC‐121‐4002, Illumina). Fragments of ~200–1,500 bp were size‐selected using AMPure XP beads. The final size of the library was confirmed by Agilent 2100 Bioanalyzer. The samples were diluted to a final concentration of 8 pM, and cluster generation was performed on the Illumina cBot using HiSeq 3000/4000 PE Cluster Kit (PE‐410‐1001, Illumina). Sequencing was performed on Illumina HiSeq 4000 using HiSeq 3000/4000 SBS Kit (FC‐410‐1003, Illumina). Image and base calling, solexa CHASTITY quality filter, human genome (UCSC hg19) alignment, peak detection, and peak annotation were analysed. The ChIP samples from each sample served as negative inputs for peak calling. The immunoprecipitation was eluted from the beads using 50 μl of elution buffer, and immunoprecipitated DNA was extracted, purified, and then used to amplify target DNA sequences by RT‐qPCR using specific primers in triplicate (Table 1).
2.5. MicroRNA microarray analysis
RNAs of lymphocytes from AIS patients (n = 3) and controls (n = 2) were extracted using Trizol reagent (Invitrogen, Carlsbad, CA, USA), and processed for microRNA microarray analysis using Agilent Human miRNA microarray Rel 12.0 (Agilent Technologies, Santa Clara, CA, USA). The random variance model corrected t test (RVM‐T test) was applied to filter the differentially expressed genes for the healthy control and two groups of patients. After the significance analysis and false discovery rate (FDR) analysis, the differentially expressed genes were selected according to the P value threshold. Hierarchical clustering was carried out using correlation distance as the distance metric and average linkage between clusters. Targetscan, miRanda, and miRBase target prediction database were used to determine the predicted target genes. The intersection genes between the target genes and the differentially expressed genes analysed by multiClassDif analysis, and corresponding miRNAs were analysed in the next step. The overlapping targets predicted by the three databases were subjected to the Kyoto encyclopaedia of genes and genomes (KEGG, RRID:SCR_012773) pathway analysis, performed by the Fisher's exact test and χ‐square test, and the threshold of significance was defined by P value and FDR. The selection criterion for significant KEGG pathway terms was P value < .01.
2.6. Luciferase assays
HEK293T cells (ATCC, Manassas, VA, USA, RRID:CVCL_0063) were co‐transfected with either a scrambled control miR or miR‐494 mimics and the luciferase constructs of HDAC2 3′‐UTR (wild type or site‐directed mutation). Cells were harvested after 48 hr, and a dual luciferase assay was performed in triplicate using a Dual‐Luciferase® Reporter Assay System (Promega E1910).
2.7. Animals
All animal care and experimental procedures were approved by the Institutional Animal Care and Use Committee of Capital Medical University. Animal studies are reported in compliance with the ARRIVE guidelines and the Basel declaration including the 3Rs concept (Kilkenny, Browne, Cuthill, Emerson, Altman, & Group, 2010; McGrath & Lilley, 2015) and with the recommendations made by the British Journal of Pharmacology. Male C57BL/6J mice (2 months of age, 22–25 g of weight, RRID:IMSR_JAX:000664) were purchased from Vital River Laboratory Animal Technology Co. Ltd (Beijing, China) and were maintained in standard‐housing open‐top cages (34 × 16 × 16 cm) at a specific pathogen‐free facility at 22–24°C with a relative humidity of 50–60% and on a 12‐hr:12‐hr light:dark cycle, with ad libitum access to water and standard laboratory chow diet.
2.8. Mouse model of transient middle cerebral artery (MCA) occlusion
Focal brain ischaemic model was developed by transient intraluminal filament occlusion of the right middle cerebral artery (MCAO) which has been well accepted as a stroke model (Hata et al., 1998). Surgeries and all stroke outcome assessments were performed by investigators blinded to experimental group assignments. Focal cerebral ischaemia was induced by transient middle cerebral artery (MCA) occlusion. Briefly, mice were anaesthetized with enflurane, and the right common carotid artery (CCA) was exposed. A nylon filament with a 0.19‐mm‐diameter silicon tip was inserted to obstruct the flow of blood to the right MCA for a period of 45 min after which it was removed to allow for reperfusion. The local cerebral blood flow was observed using a transcranial laser Doppler (LDF, PeriFlux System 5000; Perimed, Sweden) to confirm occlusion of the MCA. Sham‐operated mice underwent the same anaesthesia surgical procedures without MCAO. The ipsilateral cerebral blood flow decreased to 15% to ≈25% of baseline. Body temperature was monitored and maintained at 37.0 ± 0.5°C using a heating lamp during surgery. After recovering from anaesthesia, mice were returned to the regular sterilized cages with some wetted food. All procedures were carried out to minimize the number of animals used (n = 10 per group) and their suffering. Animals were excluded from the stroke analysis, if they died within the first 24 hr.
2.9. Animal grouping and intravenous administration of antagomir‐494
Mice were randomly divided into four groups, counterbalancing body weight variation across groups: (1) Sham group: the mice underwent the same procedure as other groups without insertion of the suture; (2) MCAO + control group; (3) MCAO + antagomir‐494 group; (4) MCAO + antagomir‐494 + HDAC1/2 inhibitor https://www.guidetopharmacology.org/GRAC/LigandDisplayForward?ligandId=7006 group. Romidepsin (FK228), dissolved in 10% DMSO, was injected intravenously immediately after MCAO at a dose of 0.5 mg·kg−1. The agomir‐494, antagomir‐494, and transfection reagent were purchased from GenePharma (Suzhou, China). Before MCAO, mice were treated with the mixture of 60 μl miR‐494 antagomir or control (20 μmol·L−1) + 60‐μl transfection reagent through the tail vein. Sequences were 5′‐UGAAACAUACACGGGAAACCUC‐3′ (agomir‐494), 5′‐GAGGUUUCCCGUGUAUGUUUCA‐3′ (antagomir‐494), and 5′‐CAGUACUUUUGUGUAGUACAA‐3′ (nonsense control; Suzhou, China).
2.10. Adhesive removal test
The tape removal test was conducted before MCAO, as well as at 1 and 3 days after reperfusion. Mice with adhesive tape (30 mm2) stuck to the distal radial section of the left paw were placed in a transparent glass cage. The time taken to sense and the time taken to tear off the tape were both recorded, with a maximum time of 120 s in each test. Each mouse was tested three times, and the average time taken to sense and to remove the adhesive tape were calculated.
2.11. Flow cytometry analysis
We added red blood cell lysis buffer (eBioscience, San Diego, CA, USA) to 200 μl of blood. We dissociated whole spleens in RBC lysis buffer, using a 40‐μm nylon cell strainer. After centrifugation, cells were suspended in 2% FBS in PBS. For flow cytometric analysis, cells were placed in staining buffer at a concentration of 106 cells·ml−1 for splenocytes and 2 × 10⁵ cell·ml−1 for blood cells. Cells were stained with rat anti‐mouse CD3, CD4, CD8, LY6G, CD11b, CD16, and CD206 (BD Bioscience, New Jersey, USA). Mouse BD Fc Block™ was then incubated with various fluorescently tagged antibodies (FITC, PE, PerCP/PECy5.5, and APC). Intracellular https://www.guidetopharmacology.org/GRAC/LigandDisplayForward?ligandId=4968 and https://www.guidetopharmacology.org/GRAC/LigandDisplayForward?ligandId=4996 staining was assessed using the fixation/permeabilization reagents according to the manufacturer's instructions (eBioscience). The samples were then run on a BD Accuri™ C6 under a fluorescence flow cytometry analysis.
2.12. 2,3,5‐Triphenyl‐2H‐tetrazolium chloride (TTC) staining
Mice were killed 72 hr after reperfusion, and their brains were quickly removed. Infarct volume was detected by TTC staining. Volume calculation with oedema correction was performed blindly using the following formula: 100 × (contralateral hemisphere volume – non‐infarct ipsilateral hemisphere volume)/contralateral hemisphere volume. Volume calculation with oedema correction was performed blindly using the following formula: swelling (% contralateral hemispheric volume) = (contralateral hemisphere volume – non‐infarct ipsilateral hemisphere volume)/contralateral hemisphere volume×100.
2.13. TUNEL/NeuN staining
The frozen sections were blocked with 0.3% (w/v) BSA in PBS at room temperature for 1 hr. Sections were incubated with primary antibodies (NeuN, Millipore, Cat#MAB377, RRID:AB_2298772) overnight at 4°C. After incubating with Alexa Fluor 488 AffiniPure Donkey Anti‐Mouse IgG (H + L; Jackson, Cat#715–545‐150), all sections were counterstained with DAPI. The images were digitized using an Olympus Fluoview FV1000 microscope (Olympus, Japan). The number of positive NeuN/TUNEL staining was calculated and analysed in the region of the ischaemic peripheral cortex with ImageJ software (National Institutes of Health, Bethesda, Maryland, USA, RRID:SCR_003070).
2.14. Multiplex analysis of cytokine protein expression
Plasma and 2 μg·μl−1 brain samples (25 μl) were measured in the MSD Mouse Pro‐Inflammatory V‐Plex Plus Kit using a SECTOR Imager 6000 (Mesoscale Discovery, Rockville, USA) plate reader according to the manufacturer's instructions. Data were analysed using MSD Discovery Workbench software.
2.15. Western blotting
Protein extraction from tissue material, sample preparation, SDS polyacryl amide gel electrophoresis, western blotting, and blot developing have been extensively described elsewhere. Primary antibodies used were anti‐https://www.guidetopharmacology.org/GRAC/FamilyDisplayForward?familyId=990 (Abcam, Cat#235946), anti‐T‐box transcription factor 21 (https://www.guidetopharmacology.org/GRAC/ObjectDisplayForward?objectId=2316; Abcam, Cat#91109), anti‐signal transducer and activator of transcription 6 (https://www.guidetopharmacology.org/GRAC/ObjectDisplayForward?objectId=2993; Abcam, Cat#32520), anti‐GATA binding protein 3 (GATA‐3; Abcam, Cat#106625), and anti‐β‐actin. For detection of proteins, the Pierce ECL Substrate kit (Thermo Scientific, IL, USA) was used on a BioRad Imager facility (Chemidoc XRS, BioRad, CA, USA). The immuno‐related procedures used comply with the recommendations made by the British Journal of Pharmacology (Alexander et al., 2018).
2.16. Human T cell culture
Human Jurkat T cells (ATCC, Manassas, VA, USA, RRID:CVCL_C831) were cultivated in RPMI‐1640 medium containing HEPES and sodium bicarbonate (Sigma‐Aldrich, St. Louis, MO, USA), and supplemented with 10% FBS and 2‐mM l‐glutamine at 37°C in a humidified atmosphere containing 5% CO2. Human siRNA directed against STAT4, T‐bet, and a scrambled silencer select negative control siRNA were purchased (Santa Cruz, CA, USA). Cells were transfected with control (20 nM), agomir‐494 (20 nM), agomir‐494 (20 nM) + STAT4 siRNA (20 nM), or agomir‐494 (20 nM) + T‐bet siRNA (20 nM). After 2‐day cultivation, Jurkat T cells were stimulated with PHA (20 μM) and LPS (1 μg·ml−1), respectively. Cell proliferation was measured by CCK‐8 at 24 hr after induction. The media and cells were collected to detect the concentration of IFN‐γ and IL‐4 by elisa and RT‐PCR, respectively.
2.17. Cortical neuron cultures and oxygen–glucose deprivation
Oxygen–glucose deprivation (OGD) was used as an in vitro model of cerebral ischaemia. Cortices from embryonic day 14 brains of C57BL/6J mice were dissected and suspended in Krebs buffer containing trypsin (Sigma‐Aldrich). After 15‐min incubation at 37°C, fresh buffer with DNAse was added. The content was gently mixed and centrifuged at 230 x g for 3 min. The cell pellet was resuspended into neurobasal/B27/l‐glutamine/gentamicin medium. The viable cells were plated on culture plates pre‐coated with poly‐d‐lysine at 200,000 cells per well. Seven‐day‐old cortical neurons were used to induce hypoxia by incubation in a hypoxia chamber for 3 hr at oxygen concentration of 1% without glucose. Jurkat T Cells were transfected with control (20 nM) or agomir‐494 (20 nM). After 2‐day cultivation, cells were stimulated with PHA (20 μM) for 24 hr. Then neurons were exposed to conditioned medium from Jurkat T cells for 6 hr. After 24‐hr incubation of normal medium, the cell injury was assessed by immunofluorescence staining and high‐content screening assay for TUNEL and neurite outgrowth.
2.18. High‐content screening assay
The 96‐well plate was blocked with 0.3% (w/v) BSA in PBS at room temperature for 1 hr. The cells were incubated with primary antibodies against microtubule‐associated protein 2 (MAP‐2; catalogue 4542, CST, MA, USA) and synaptophysin (catalogue 32127, Abcam) overnight at 4°C. After incubating with fluorescent‐conjugated secondary IgG antibodies, all sections were counterstained with DAPI. Neurite outgrowth evaluation was observed under a phase‐contrast microscope using a 10× objective of ImageXpress Micro XLS System (ImageXpress Micro XLS System, Molecular Devices, USA). Sixteen areas of neuron were acquired in each well. Neurite length was measured using the MetaXpress (RRID:SCR_016654). In this multi‐parameter assay, the software segments the neuronal cell body and analyses fluorescently labelled neurites with respect to their total length, branches, processes, and total area spots. The description of the immunohistochemical procedures complies with the BJP Guidelines (Alexander et al., 2018).
2.19. Data and statistical analysis
The data and statistical analysis comply with the recommendations of the British Journal of Pharmacology on experimental design and analysis in pharmacology (Curtis et al., 2018). Grouping was performed in a randomized manner. Statistical analysis was performed using SPSS 23.0 (RRID:SCR_002865). The optimum sample sizes and animal numbers were determined by prior experience, and our preliminary data to achieve statistical significance. Data were expressed as the mean ± SD in all studies. An independent samples t test was used for two‐group comparisons. Statistical significance for multiple group comparisons was calculated by one‐way ANOVA followed by Tukey–Kramer post hoc test (only in those tests where F achieved the necessary level of statistical significance; P < .05). Receiver operator characteristic (ROC) curve analysis was performed to calculate the predictive power of the sensitivity and specificity for the diagnosis of ischaemic stroke. The overall diagnostic accuracy of the models was assessed using the area under the receiver operating characteristic curve (AUC). For correlation analyses, the Spearman correlation coefficient ( R ) was calculated. Data were considered statistically significant when a value of P ≤ .05 was achieved. All measurements were undertaken in at least three technical replicates.
2.20. Nomenclature of targets and ligands
Key protein targets and ligands in this article are hyperlinked to corresponding entries in http://www.guidetopharmacology.org, the common portal for data from the IUPHAR/BPS Guide to PHARMACOLOGY (Harding et al., 2018), and are permanently archived in the Concise Guide to PHARMACOLOGY 2017/18 (Alexander, Christopoulos et al., 2017; Alexander, Fabbro et al., 2017; Alexander, Kelly et al., 2017).
3. RESULTS
3.1. Lymphocytes of AIS patients exhibit a Th1 to Th2 shift
The total number of lymphocytes tended to decrease but there was no statistical difference between numbers in AIS patients within 6 hr after the onset of symptom and those from age‐matched controls (Figure 1a). https://www.guidetopharmacology.org/GRAC/LigandDisplayForward?ligandId=4968 and IL‐4 are markers of Th1 and Th2 subsets of CD4+ T cells respectively. RT‐PCR analysis revealed that lymphocytic IFN‐γ expression was decreased in lymphocytes from AIS patients (Figure 1b), while IL‐4 expression was increased (Figure 1c), and resulting a Th1 to Th2 shift in circulating lymphocytes from AIS patients (Figure 1d).
Figure 1.
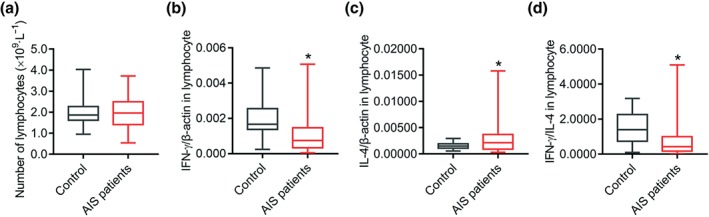
The Th1 to Th2 shift observed in lymphocytes of AIS patients. (a) The number of lymphocytes in blood of controls (n = 45) and AIS patients (n = 50) at the hyperacute stage. (b–d) Phenotypic marker of Th1 and Th2 lymphocytes, IFN‐γ and IL‐4, of controls (n = 27) and AIS patients (n = 43) was measured by quantitative PCR, and IFN‐γ and IL‐4 levels were calculated. *P < .05, significantly different from control. AIS, acute ischaemic stroke
3.2. HDAC2 regulated Th1 shift through binding intragenic regions of STAT4 and T‐bet of AIS patients
To investigate whether and how HDAC2 was involved in regulating the Th1/Th2 balance in lymphocytes of AIS patients, we performed a RT‐PCR and ChIP‐Seq experiment. Our results showed that lymphocytic HDAC2 was decreased markedly in AIS patients (Figure 2a). ChIP‐Seq analysis found that distribution of DNA‐binding sites of HDAC2 included promoter (1.8%), introns (28.74%), exons (6.38%), and intergenic regions (14.75%; Figure 2b). The promoter region was defined as ±2 kbp of the transcription start sites (TSS; Figure 2c). Gene ontology analysis revealed gene enrichment in regulation of Th1‐Th2 cytokine production (Figure 2d) and identified enriched DNA‐binding sites in many key regulators involved in Th1 and Th2 cell differentiation such as STAT4 and T‐bet. UCSC genome browser demonstrated that HDAC2 occupancy was higher in the promoter region of the T‐bet gene, but lower in the intron region of the STAT4 gene in lymphocytes of AIS patients (Figure 2e,f); ChIP‐PCR confirmed this result (Figure 2g–i). This finding reveals a link between HDAC2 and the transcription factors STAT4 and T‐bet in regulation of Th1 shift following AIS.
Figure 2.
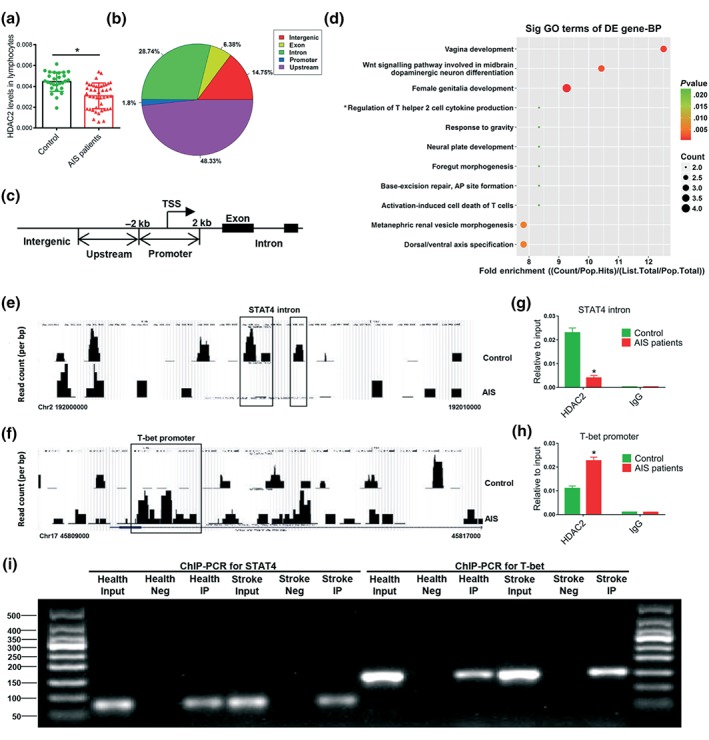
HDAC2 regulated Th1/Th2 balance through binding intragenic regions of STAT4 and T‐bet of AIS patients. (a) Histone deacetylase 2 (HDAC2) mRNA levels in lymphocytes of controls (n = 27) and AIS patients (n = 43) were measured by quantitative PCR. Chromatin immunoprecipitation sequencing (ChIP‐Seq) analysis of promoter and intragenic regions of all genes was performed in lymphocytes of AIS patients' immunoprecipitated using HDAC2 or rabbit IgG as a negative control (b–f). (b) Distribution of HDAC2 genomic binding relative to known genes. (c) The promoter region was defined as ±2 kbp of the transcriptional start sites (TSS). (d) Gene ontology (GO) biological process showing the fold enrichment dot plot. Only significantly enriched (P < .05) terms are shown. (e, f) HDAC2 ChIP‐Seq profiles at the promoter of T‐box transcription factor 21 (T‐bet) and intron of STAT4 locus in lymphocytes of AIS patients versus healthy controls. (g, h) Validation of ChIP‐seq results by chromatin immunoprecipitation PCR (ChIP‐qPCR). Data and error bars represent the mean ± SEM. N = 3. *P < .05, significantly different from control. (i) Representative images of ChIP‐PCR. AIS, acute ischaemic stroke
3.3. The most robustly up‐regulated miR‐494 in lymphocyte of AIS patients directly targets HDAC2
In order to find miRNA that can target HDAC2 in AIS patients, we profiled miRNAs in lymphocytes of AIS patients and controls. We chose to focus on miR‐494, because it exhibited the most robust up‐regulation (Figure 3a). Interestingly, functional annotation analysis revealed that its target genes were involved in regulating immune response and neuronal function via four pathways ‐ focal adhesion, TGF‐β signalling, amyotrophic lateral sclerosis, and glutamatergic synapse (Curcio, Salazar, Mele, Canzoniero, & Duarte, 2016; Kahl et al., 2018; Li, Concepcion, Meng, & Zhang, 2017; Schmitt & Ueno, 2015) (Figure 3b). Therefore, targeting inhibition of up‐regulated miR‐494 might be a potential therapeutic strategy for cerebral ischaemia. Subsequently, we assayed miR‐494 levels in lymphocytes and neutrophils of 76 AIS patients and 52 age‐matched control volunteers by RT‐PCR, and found them to be increased significantly within 6 hr after cerebral ischaemia (Figure 3c). The corresponding baseline characteristics are summarized in Table 2. ROC analysis showed that the AUCs for miR‐494 levels in lymphocytes were 0.662, indicating a diagnostic potential of miR‐494 in AIS patients (Figure 3d). Then we analysed the characteristics of the sequence of miR‐494. It is localized on chromosome 14q in humans and comprises an immature pre‐miR‐494 as well as the products miR‐494‐5p and miR‐494‐3p (Figure 3e). The miR‐494 sequence, especially the miR‐494‐3p sequence, is conserved among mammals (Figure 3f). Analysis of the 3′UTR nucleotides 1,186–1,208 of HDAC2 mRNA revealed a potential binding site for miR‐494‐3p (Figure 3g). Using a luciferase reporter system, agomir‐494 significantly suppressed the luciferase activities containing HDAC2 binding sites. Mutations of this reporter construct within the predicted miR‐494 binding sites abolished the luciferase responsiveness (Figure 3h). Furthermore, lymphocytic HDAC2 levels inversely correlated with miR‐494 levels (Figure 3i). Therefore, miR‐494 targets HDAC2 directly in the lymphocytes from AIS patients.
Figure 3.
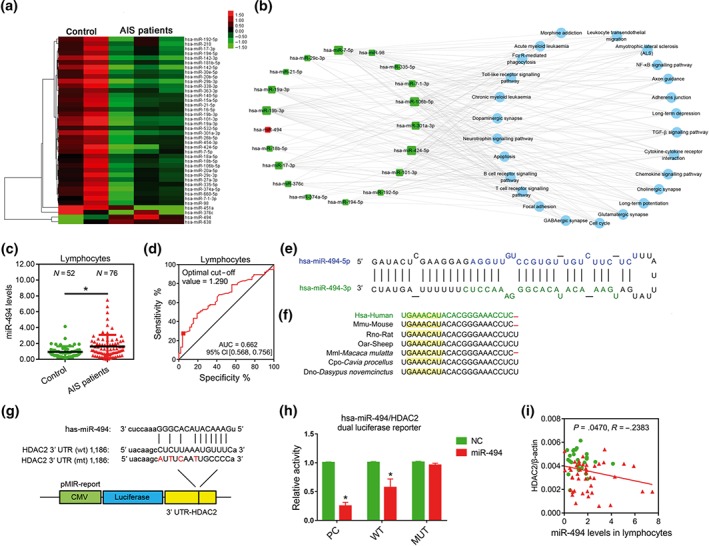
The most robustly up‐regulated miR‐494 in lymphocyte directly targets HDAC2 in AIS patients. (a) Heat map depicting the expression profile of all microRNAs in lymphocytes of controls (N = 2) and AIS patients within 6 hr after stroke symptom onset (N = 3) with changes greater than twofold. (b) MiRNA‐pathway network in lymphocytes. The red squares represent up‐regulated miRNAs, the green squares represent down‐regulated miRNAs, and the blue circle represents the path regulated by the miRNAs. The size of the miRNAs squares represents the number of its target pathways. (c) MiR‐494 levels in lymphocytes of controls and AIS patients were measured by quantitative PCR. (d) Receiver‐operating characteristic curve analysis for sensitivity and specificity of the diagnosis of miR‐494 levels. (e) Full sequence of the mature miR‐494 and organization of the miR‐494‐5p and miR‐494‐3p structures. (f) Schematic representation of mammalian miR‐494‐3p sequence preservation. The yellow region is the seed sequence. (g) Schematic representation of the putative miR‐494‐3p target sites in the 3′UTR of HDAC2 of humans. (h) Luciferase assay. HEK293T cells were co‐transfected with either a scrambled miR control or miR‐494 mimics and the luciferase constructs of HDAC2 3′‐UTR (wild type or site‐directed mutation). Cells were harvested after 48 hr, and a dual luciferase assay was performed. N = 6. *P < .05, significantly different from NC. (i) Correlation between expression of HDAC2 and miR‐494 levels in lymphocytes of controls and AIS patients. AIS, acute ischaemic stroke
Table 2.
Baseline characteristics of AIS patients and health volunteers
| Characteristics | AIS patients (n = 43) | Health control (n = 26) (n = 8) | P value |
|---|---|---|---|
| Age (years) | 60.41 ± 10.11 | 57.96 ± 10.13 | .1809 |
| Gender (M/F) | 54/22 | 36/16 | |
| Hypertension, n (%) | 25 (32.89) | 16 (30.76) | |
| Diabetes, n (%) | 16 (21.05) | 8 (15.38) | |
| Hyperlipidaemia, n (%) | 18 (23.68) | 9 (17.30) |
Note. P value is calculated with t test (*) to compare continuous variables.
Abbreviation: AIS, acute ischaemic stroke.
3.4. Elevated lymphocytic miR‐494 is correlated with Th1 cytokines and neurological function in AIS patients
The findings described above initiated further exploration of whether miR‐494 is related to phenotype switch of lymphocytes in AIS patients. As expected, lymphocytic miR‐494 levels were positively associated with the number of lymphocyte as well as lymphocyte to neutrophil ratio (Figure 4a,b). Moreover, miR‐494 level was correlated inversely with the Th1 cytokine IFN‐γ but not the Th2 cytokine IL‐4 (Figure 4c,d). To further assess whether miR‐494 levels could reflect the degree of neurological deficit after AIS, its correlation with NIHSS score at admission was analysed. Notably, lymphocytic miR‐494 levels were directly correlated with NIHSS scores at admission (Figure 4e). This finding indicates a significant correlation between elevated miR‐494 and Th1 response in AIS patients, emphasizing that the up‐regulation of lymphocytic miR‐494 levels could influence the neurological function deficit after AIS.
Figure 4.
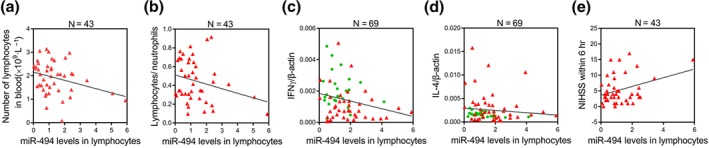
Elevated lymphocytic miR‐494 is correlated with Th1 cytokine marker and neurological function of AIS patients. Spearman correlation coefficient (R) was calculated to test the correlation between miR‐494 levels and, in (a), the number of lymphocytes, with R= − .3067; P < .05; in (b), the lymphocyte/neutrophil ratio, with R= − .2618, P > .05; in (c), the Th1 phenotypic marker IFN‐γ, with R= − .2660; P < .05; in (d), the Th2 marker IL‐4, with R= − .1034, P > .05 (d), and in (e), the NIHSS scores at admission, with R= .3339: P < .05. Controls (n = 45), AIS patients (n = 50). AIS, acute ischaemic stroke
3.5. Intravenous injection of antagomir‐494 corrects Th2‐Th1 shift and improves neurological outcomes in MCAO mice
Consistent with the clinical data, miR‐494 levels were increased significantly in leukocytes, plasma, and ipsilateral brain tissue of the ischaemic stroke model (MCAO) in mice (Figure 5a). We therefore tested whether inhibition of miR‐494 in blood could change cerebral injury and neurological deficit in experimental stroke. The percentage of T‐helper cells (CD3+CD4+, Figure 5b) was decreased in the spleen 3 days after reperfusion, compared with values in the sham mice, which was slightly reversed by antagomir‐494. Importantly, antagomir‐494 reduced Th1 proportion (CD3+CD4+IFN‐γ+) in the spleen significantly, and up‐regulated the Th2 proportion (CD3+CD4+IL‐4+) slightly, thereby clearly reducing the Th1/Th2 cell ratio (Figure 5c,). In accordance with previous reports (Chen et al., 2018), the splenic mass of animals after MCAO was markedly decreased, which was not changed after antagomir‐494 administration (Figure 5d). Sensory and motor function was assessed using the sticky‐tape removal test. Intravenous injection of antagomir‐494 markedly improved neurological function in MCAO mice at 24 hr or 72 hr after reperfusion (Figure 5e). Accordingly, infarct volume and neuronal apoptosis also improved at 72 hr after reperfusion (Figure 5f,g). These in vivo data demonstrated that the functional improvement of the effects of cerebral ischaemia by the antagomir‐494 was achieved by correcting the Th1/Th2 imbalance.
Figure 5.
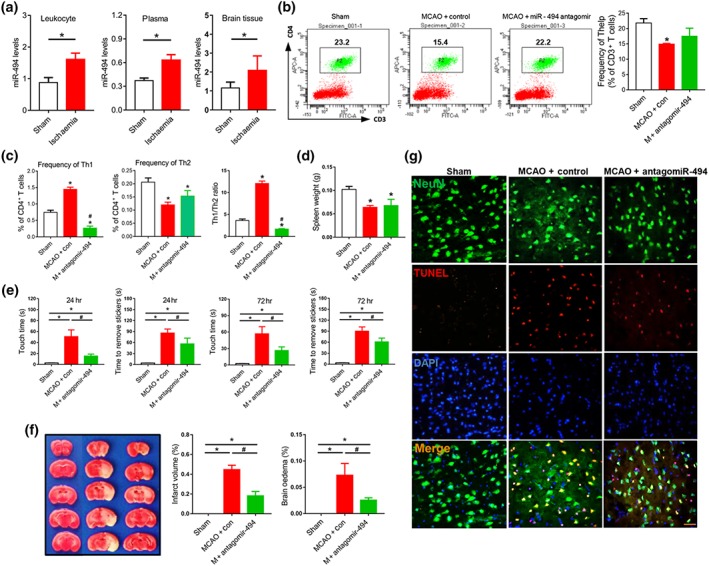
Intravenous injection of antagomir‐494 corrects Th1/Th2 imbalance and improves neurological outcome of MCAO mice. (a) MiR‐494 levels in leukocytes, ipsilateral brain tissue, and plasma of sham and middle cerebral artery occlusion (MCAO) mice subjected to 45‐min ischaemia were measured by quantitative PCR. N = 10. (b–g) Transient MCAO was performed in wild‐type mice for 45‐min ischaemia and 72‐hr reperfusion. Before MCAO, mice were treated with the mixture of 60‐μl antagomir‐494 or control (20 μmol·L−1) + 60‐μl transfection reagent through the tail vein. (b) FACS analysis of Thelp lymphocytes (CD3+CD4+) in mouse spleen. N = 10. (c) FACS analysis of Th1 lymphocytes (CD3+CD4+IFN‐γ+) and Th2 lymphocytes (CD3+CD4+IL‐4+) in mouse spleen. N = 10. (d) Spleen weight of mice. N = 10. (e) Adhesive removal test was used to assess sensorimotor deficits in control‐ and antagomir‐494‐treated mice MCAO after 24 hr or 72 hr of reperfusion or sham. N = 10. (f) Mice were killed 3 days after reperfusion, and brain slices were processed for 2,3,5‐triphenyl‐2H‐tetrazolium chloride (TTC) staining and calculation of cerebral infarct and brain oedema volume. N = 6. (g) Neuronal apoptosis was determined by NeuN/TUNEL assay. Scale bar, 50 μm. N = 6. *P < .05, significantly different from sham. # P < .05, significantly different from MCAO + control
3.6. MiR‐494 acts as a driver of Th1 shift‐mediated neurotoxic response in vitro
To identify whether miR‐494‐treated T cells could directly affect hypoxia‐induced neuronal injury, we established an in vitro model where primary neurons after OGD were cultured with conditioned medium from activated T cells (Figure 6a). High content analysis for axonal marker MAP‐2 and TUNEL staining (Figure 6b) revealed that treatment of OGD‐neurons with the PHA‐activated lymphocyte medium did not lead to neuronal injury, compared with normal lymphocyte medium. However, there was a substantial increase in neuronal apoptosis and axonal injury when OGD‐neurons were exposed to conditioned medium of PHA‐activated T cells plus agomir‐494 treatment (Figure 6c,d,). elisa and RT‐PCR showed that substantial IFN‐γ release in the medium was generated by PHA stimulation in T cells, which was further elevated after agomir‐494 treatment (Figure 6e,f,). Concurrently, IL‐4 levels in PHA‐activated T cells were decreased after agomir‐494 treatment (Figure 6g). Importantly, the human PHA‐stimulated Jurkat T cell expressed markedly higher amounts of Th1 transcription factors STAT4 and T‐bet protein than the control group, which was further increased by agomir‐494 (Figure 6h,i). the Th2 transcription factor STAT6 was not changed after PHA or after agomir‐494 treatment (Figure 6j), while PHA‐induced GATA‐3 up‐regulation in Jurkat T cells was inhibited by agomir‐494 (Figure 6k). Collectively, these findings indicate that miR‐494 could act as a molecular switch for a Th1 shift and highlighted a critical role of miR‐494 in controlling the transcriptional activation of STAT4 and T‐bet. Therefore, we hypothesized that the elevated levels of miR‐494 inhibit HDAC2, probably leading to increased histone acetylation at the intron region of STAT4 or the promoter region of T‐bet to increase their transcription, thereby increasing Th1 cytokine production in lymphocytes.
Figure 6.
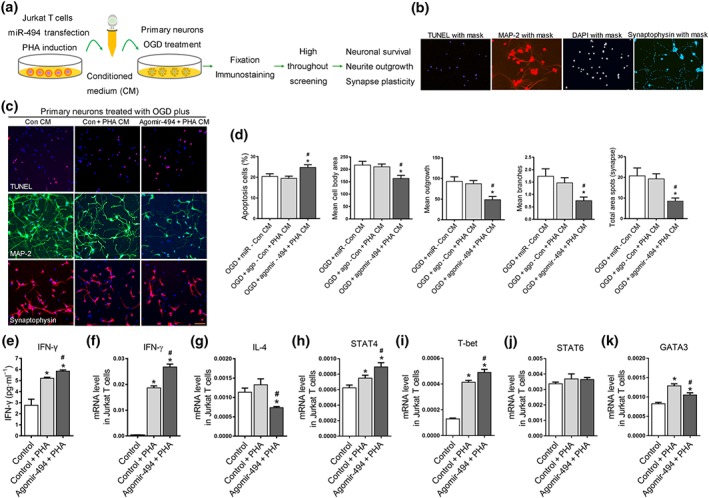
MiR‐494 acts as a driver of Th1 shift‐mediated neurotoxic response. Jurkat T cells were transfected with control (20 nM) and agomir‐494 (20 nM). After 2‐day cultivation, Jurkat T cells were stimulated with PHA (20 μM) for 24 hr. Primary mouse cortical neurons following 2‐hr OGD were cultured with or without conditioned medium for 24 hr. (a) Experimental design for neuron and lymphocyte experiment in vitro. (b) Image with mask‐based high‐content analysis technology for TUNEL, neurite morphology, and synaptic spots. (c, d) Representative images and statistical analysis for neuronal TUNEL staining and neurite morphology analysis. Images were taken with a 10× objective. Scale bar, 50 μm. (e) IFN‐γ releases by lymphocytes detected by quantitative PCR. (f, g) Expression of IFN‐γ and IL‐4 in lymphocytes measured by quantitative PCR. (h–k) RT‐PCR for mRNA levels of key transcription factor of Th1/Th2 shift including STAT4, STAT6, T‐bet, and GATA‐3. N = 6. *P < .05, significantly different from control medium. # P < .05, significantly different from PHA conditioned medium
3.7. HDAC2 mediated antagomir‐494 induced Th2 shift in ischaemic stroke mice
An inhibitor of HDAC2 was used to explore the hypothesis presented above and multiplex MSD assay was used to assess the Th1/Th2 cytokine panel in plasma and brain tissue. Plasma Th1 cytokines https://www.guidetopharmacology.org/GRAC/LigandDisplayForward?ligandId=819 and https://www.guidetopharmacology.org/GRAC/LigandDisplayForward?ligandId=5074 levels were increased 3 days after reperfusion in MCAO mice compared with sham and these CXCL1 levels were decreased after antagomir‐494 treatment (Figure 7a). Also, the reduced plasma levels of the anti‐inflammatory cytokines IL‐4, https://www.guidetopharmacology.org/GRAC/LigandDisplayForward?ligandId=4997, and https://www.guidetopharmacology.org/GRAC/LigandDisplayForward?ligandId=4975 following stroke were increased after antagomir‐494 treatment (Figure 7b). FK228 reversed antagomir‐494‐induced reduction of TNF‐α and up‐regulation of IL‐4 in plasma (Figure 7a,b). In addition, Th1 and Th2 cytokines were significantly higher in the ipsilateral hemispheres than the sham group, and Th1 cytokines CXCL1, TNF‐α, and IFN‐γ were lower following antagomir‐494 treatment (Figure 7c,d). Collectively, these data demonstrated that HDAC2 partly mediated the decreased Th1 shift post‐stroke, induced by antagomir‐494, and that the HDAC2 inhibitor partly reversed this antagomir‐494‐induced Th1 shift. Thus, antagomir‐494 impedes the Th1 shift in circulating T cells after cerebral ischaemic stroke in mice, in a HDAC2‐dependent manner.
Figure 7.
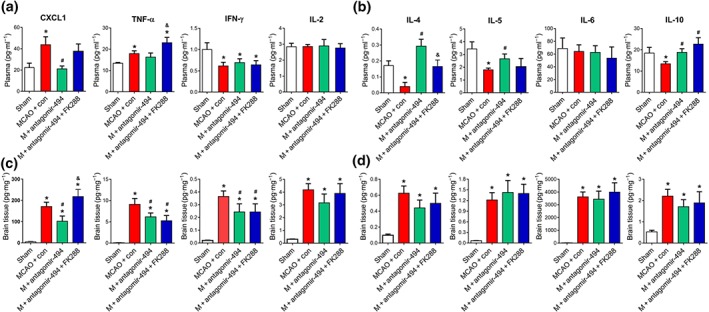
HDAC2 mediated antagomir‐494 induced Th2 shift in cerebral ischaemic miceMice were treated with antagomir‐494 or control, HDAC2 inhibitor, or saline and allowed 72‐hr survival after MCAO. Multiplex analysis of cytokine protein expression in mouse plasma (a, b) and ipsilateral brain tissue (c, d). N = 6. MCAO, transient middle cerebral artery occlusion. *P < .05, significantly different from sham. # P < .05, significantly different from MCAO + control. & P < .05, significantly different from MCAO + antagomir‐494
3.8. MiR‐494 regulated STAT4 though HDAC2 following stroke
To explore whether miR‐494 affects the transcription of STAT4 or T‐bet through HDAC2, an HDAC2 inhibitor was used. STAT4 and T‐bet levels in the spleen were raised in the MCAO mice and were decreased by antagomir‐494, which was reversed by FK228 (Figure 8a–c). Levels of STAT6 were down‐regulated, and those of GATA‐3 were unchanged in the MCAO mice; and neither of them was influenced by antagomir‐494 or FK228 treatment (Figure 8d,e).
Figure 8.
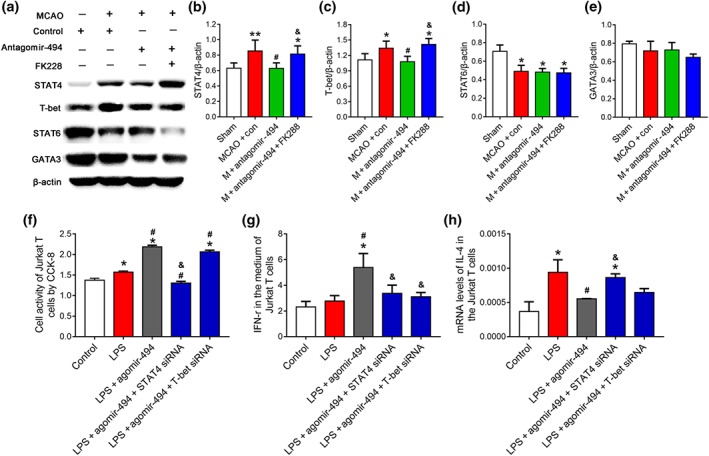
MiR‐494 regulated STAT4 and T‐bet though interaction with HDAC2 following stroke. Mice were treated with antagomir‐494 or control, HDAC2 inhibitor, or saline and allowed 72‐hr survival after middle cerebral artery occlusion (MCAO). (a–e) Western blot for protein levels of key transcription factors of Th1/Th2 shift including STAT4, STAT6, T‐box transcription factor 21 (T‐bet), and GATA binding protein 3 (GATA3). N = 6. *P < .05, significantly different from sham. # P < .05, significantly different from MCAO + control. & P < .05, significantly different from MCAO + antagomir‐494. Jurkat T cells were transfected with control (20 nM), agomir‐494 (20 nM), miR‐494 agomir (20 nM) + STAT4 siRNA (20 nM), or agomir‐494 (20 nM) + T‐bet siRNA (20 nM). After 2‐day cultivation, Jurkat T cell was stimulated with LPS (1 μg·ml−1) for 24 hr. (f) Cell activity detected by CCK‐8 assay. (g) Levels of IFN‐γ in the medium of Jurkat T cells were assessed using elisa. (h) Levels of IL‐4 in Jurkat T cells were assessed using real‐time PCR. N = 6. *P < .05, significantly different from control. # P < .05, significantly different from LPS. & P < .05, significantly different from LPS + agomir‐494
To further investigate whether the up‐regulation of STAT4 or T‐bet mediated the effects of agomir‐494, we used siRNAs of STAT4 and T‐bet and cell activity of Jurkat T cells and cytokine production was detected by CCK‐8, elisa, and RT‐PCR. The Jurkat T cells exhibited higher activity upon LPS induction; this was further increased by agomir‐494 and reversed by STAT4 siRNA but not T‐bet (Figure 8f). In addition, IFN‐γ was higher in the medium of Jurkat T cells following agomir‐494‐treatment and reversed by both STAT4 and T‐bet siRNA (Figure 8g). IL‐4 was higher in Jurkat T cells following LPS induction, and agomir‐494 decreased its mRNA levels, which was reversed by STAT4 siRNA but not T‐bet (Figure 8h). Together, this indicated that agomir‐494 mediated the Th1 shift in a STAT4‐dependent manner.
4. DISCUSSION
To the best of our knowledge, this study is the first to demonstrate that a Th1 to Th2 shift occurred in circulation of AIS patients at the hyperacute phase, within 6h of onset. We further showed that HDAC2, a potential epigenetic switch of phenotypic shift of immune cells, was down‐regulated in lymphocytes of AIS patients and regulated the Th1 shift through binding intragenic regions of STAT4 and T‐bet. Hence, we have provided an alternative pathway of transcriptional repression of STAT4 through epigenetic modifications at intron. The reduced HDAC2 levels had an inverse correlation with the most significantly up‐regulated miR‐494, in lymphocytes of AIS patients. Finally, this study uncovered a novel inflammatory pathway of clinical relevance, through which inhibition of miR‐494 reduced the Th1 shift‐mediated neurotoxicity, by regulation of the HDAC2‐STAT4 pathway, in AIS.
We showed for the first time that a Th1 to Th2 shift occurred in lymphocyte of AIS patients, within 6 hr of stroke onset. Neutrophils have long been the primary therapeutic target for acute cerebral ischaemia, and higher neutrophil counts are associated with poor outcome in AIS patients. However, there is little clinical information on lymphocytes in AIS patients. It was recently demonstrated that the number of circulating regulatory T cells in AIS patients was dramatically reduced soon after stroke onset (Mao et al., 2017). In rodents, stroke skews the T cells towards Th1 inflammatory responses in C57BL/6J mice, whereas stroke skewed BALB/c and FVB mice towards Th2 inflammatory responses (Kim et al., 2014; Nguyen et al., 2016). Clinically, a significantly lower ratio of IFN‐γ and IL‐4‐producing T cells has been observed in stroke patients at the chronic stable phase (Theodorou et al., 2008). Additionally, stroke triggered a prolonged Th2‐skewed immunity in patients on days 1, 2, 7 and 90 days after admission, as shown by multiplex immunoassay of cytokines levels in the plasma (Wong et al., 2017). Even though the shift between Th1 and Th2 subsets showed variability in different species or between mouse strains, the data generally support the concept that Th1‐prone immunity in mouse results in a more severe functional outcome after stroke compared to Th2‐prone mice (Kim et al., 2014; Zierath, Kunze, Fecteau, & Becker, 2015). Our study revealed that Th1 and Th2 were both decreased, resulting in a Th1 to Th2 shift of AIS patients even at hyperacute stage. Therefore, up‐regulating the number of Th2 cells at the hyperacute stage became a reasonable strategy for ameliorating the effects of AIS.
A major finding of this study is that HDAC2 regulated the Th1/Th2 balance through binding intragenic regions of STAT4 and T‐bet of AIS patients. Lymphocytic HDAC2 was decreased markedly in AIS patients. ChIP‐seq and ChIP‐PCR demonstrated that HDAC2 directly binds intron or promoter regions of STAT4 and T‐bet respectively, in lymphocytes of AIS patients. As most studies have shown that HDAC2 mediates epigenetic gene silencing (Gonzalez‐Zuniga et al., 2014; Salmon, Gomez, Greene, Shankman, & Owens, 2012; Zhang et al., 2015), HDAC2 might act as a negative regulator of the Th1 shift following ischaemic stroke. We further showed that inhibition of HDAC2 increased the levels of STAT4. Our results are seemingly in conflict with Su et al. and Camelo et al., who showed that endogenous HDAC activity played a crucial role in inhibiting Th2 immunity (Su, Becker, Kozyrskyj, & Hayglass, 2008) and that the HDAC inhibitor TSA reduced Th1 mRNAs in splenocytes in experimental autoimmune encephalomyelitis (Camelo et al., 2005). However, this discrepancy can be explained by the fact that the above two studies used a broad‐spectrum inhibitor of HDAC, not a specific inhibitor of HDAC2. Our data were supported by the additional finding that HDAC2 maintains CD4+ T cell lineage integrity (Ellmeier, 2015) and that mice with conditional deletion of HDAC2 in CD4+ T cells have elevated IL‐17 expression and severe colitis (Singh et al., 2018). Moreover, HDAC2 inhibition aggravated mitochondrial dysfunction and the secretion of pro‐inflammatory cytokines in monocytes (Qu et al., 2016).
Next, we set out to identify miRs that target and regulate HDAC2 expression in AIS. By combining microarray analysis and RT‐PCR, miR‐494 was screened out and identified as showing the greatest increase in lymphocytes of AIS patients. It has previously been reported that miR‐494 was down‐regulated in human infarcted hearts (Wang et al., 2010), and elevated levels of urinary miR‐494 may be a specific biomarker for human acute kidney injury (Lan et al., 2012). With their properties of relative stability, specificity, and reproducibility, ncRNAs are considered to be promising as biomarkers and better candidates than proteins and genes for ischaemic stroke (Karakas & Zeller, 2017; Tiedt et al., 2017). Therefore, miR‐494 may represent a potential non‐invasive biomarker for AIS. We identified miR‐494 as a potential HDAC2‐targeting miR, using in silico prediction tools. Indeed, miR‐494‐3p directly binds the 3′‐UTR of the Hdac2 gene, as determined by our luciferase assay. Our study was also the first to identify an inverse relationship between the expression levels of miR‐494 and its target gene, HDAC2, in lymphocytes of both healthy controls and AIS patients. Therefore, the most robust up‐regulated miR‐494 in lymphocyte of AIS patients directly targets HDAC2.
MiR‐494 has opposing effects for ischaemia–reperfusion injuries, as it contributes to kidney injury by targeting activating transcription factor 3 (Lan et al., 2012), but mitigates cardiac and hepatic ischaemia–reperfusion injury by activating the PTEN/PI3k/Akt pathway (Su et al., 2017; Wang et al., 2010). MiR‐494 also has opposite effect on nerve injury, which directly inhibits neural apoptosis and improves functional recovery in rats with spinal cord injury in vivo (Zhu et al., 2017). On the contrary, it aggravates OGD‐induced cell injury of PC12 cells (Song et al., 2017) and miR‐494 inhibition attenuated MPP+‐induced neurotoxicity in SH‐SY5Y cells (Geng, Zhang, Liu, & Chen, 2018). In the present study, bioinformatics analyses indicated that in addition to affecting neurological function, miR‐494 also targets focal adhesion and the TGF‐β pathway, which are involved in infiltration of immune cells and differentiation of T lymphocytes (Li et al., 2017). More importantly and specifically, the up‐regulation of lymphocytic miR‐494 was closely correlated with Th1 cytokines and neurological function deficits in AIS patients, suggesting that miR‐494 could also be a therapeutic target for regulating lymphocytes to improve neurological outcome in AIS. In line, we showed for the first time that in the mouse MCAO model, intravenous injection of antagomir‐494 reduced acute ischaemic cerebral injury and improved functional outcomes, leading to a rebalance of the Th1/Th2 ratio in vivo and in vitro. Similar to our results, decidual mesenchymal stem cells, overexpressing miR‐494, inhibited M2 macrophage polarization (Zhao et al., 2016). Our results are, to the best of our knowledge, the first time a functional interaction between a miRNA and a Th1/Th2 shift during AIS has been reported.
Infusion of the antagomir‐494 increased histone H3 acetylation by https://www.guidetopharmacology.org/GRAC/FamilyDisplayForward?familyId=872 p300 in the amygdala (Shakespear et al., 2018), and miR‐494 modulated the progression of Parkinson's disease models by targeting NAD‐dependent deacetylase https://www.guidetopharmacology.org/GRAC/FamilyDisplayForward?familyId=848#2709 (Geng et al., 2018), suggesting its regulatory role in histone acetylation. We identified HDAC2 mediated antagomir‐494 induced Th2 shift in ischaemic stroke mice. Hence, HDAC2 links miR‐494 and two pivotal transcription factors STAT4/or T‐bet in promotion of a Th1 shift (Ma et al., 2018; Webb, Siminovitch, & Hirschfield, 2015). As HDAC2 mediates epigenetic gene silencing (Gonzalez‐Zuniga et al., 2014; Salmon et al., 2012; Zhang et al., 2015), thus, miR‐494‐depressed HDAC2 might lead to the up‐regulation of STAT4 and T‐bet. In line with this knowledge, we found that miR‐494 overexpression resulted in accumulation of STAT4 and T‐bet in lymphocyte and enhanced Th1 activity in vitro. We further showed that down‐regulation of STAT4 and T‐bet is due to the inhibition of miR‐494 in vivo and silencing of HDAC2 led to STAT4 and T‐bet protein turnover. However, STAT4 siRNA was more effective than T‐bet siRNA in blocking the miR‐494‐induced Th1 shift in vitro, which supported a greater part played by STAT4 in the association of miR‐494 with Th1 transformation. Our data strongly support the efficacy of down‐regulation of the miR‐494/HDAC2/STAT4 pathway in the Th1 shift, in the context of AIS, as shown in Figure 9.
Figure 9.
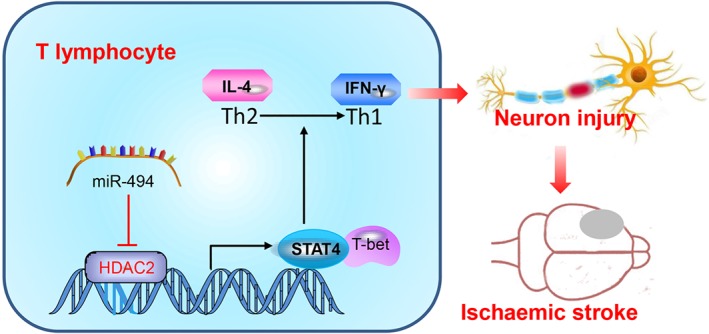
Schematic representation of the proposed molecular mechanism. Our finding indicates that silencing of miR‐494 impairs the neurotoxic Th1 shift by regulating the HDAC2‐STAT4 pathway in ischaemic stroke
Besides, miR‐494 also targets GATA‐3, a transcriptional factor for Th2 cell differentiation. The dual functions of miR‐494 on promoting Th1 and inhibiting Th2 caused an elevated Th1/Th2 ratio. The HDAC inhibitor TSA increased expression of GATA‐3 (Yashiro, Kubo, Ogawa, Okumura, & Nishiyama, 2015), but the regulation of HDAC especially HDAC2 on STAT4 and T‐bet expression was unavailable. Indeed, our findings indicate that the ability of antagomir‐494 to restore HDAC2 function and repress STAT4 represents a new approach to selectively and effectively block STAT4 signalling. Therefore, extending our studies to other human conditions of Th1/Th2 imbalance would be a promising next step for exploring the therapeutic application of antagomir‐494.
In conclusion, we present evidence that elevated levels of miR‐494 in blood are a good marker for the diagnosis and prognosis of ischaemic stroke, and inhibition of miR‐494 in the blood can reverse the process of Th1 phenotype switching and prevent ischaemic neuronal damage, supporting a potential role for miR‐494 and HDAC2 in a variety of immune‐related diseases. Monitoring the state of the miR‐494/HDAC2/STAT4 axis could identify patients at risk of progression and recurrence of stroke and provide insights for the development of specific immunomodulatory therapeutic strategies. We recognize two limitations of our present study. The AIS patient data indicate that their ages are range between 50 and 70 years and the sexes include males as well as females. However, our in vivo study included only male young adults. In our further studies, we will consider using ageing mice to further demonstrate this molecular mechanism. In addition, as the delivery of the antagomir‐494 by intravenous injection does allow specific targeting of lymphocytes, we cannot conclude now that regulating Th1 phenotypic transformation is the only or the most important neuroprotective mechanism of miR‐494. Additionally, as infection is a leading cause of mortality in the post‐acute phase of ischaemic stroke, it would be essential to monitor the immune status of patients receiving miR‐494‐antagomir therapy.
AUTHOR CONTRIBUTIONS
H.Z. and G.L. conducted study design, experiments, data analysis, and manuscript preparation. R.W. and S.M. performed molecular biology experiments. Q.M., F.L., and P.L. collected blood samples from human patients. Z.T. and S.Z. participated in the animal experiments. Z.H. and F.Y. participated in the animal experiments and histology experiment. X.J. designed clinical experiment. Y.L. designed and managed the research.
CONFLICT OF INTEREST
The authors declare no conflicts of interest.
DECLARATION OF TRANSPARENCY AND SCIENTIFIC RIGOUR
This Declaration acknowledges that this paper adheres to the principles for transparent reporting and scientific rigour of preclinical research as stated in the BJP guidelines for https://bpspubs.onlinelibrary.wiley.com/doi/full/10.1111/bph.14207, https://bpspubs.onlinelibrary.wiley.com/doi/full/10.1111/bph.14208, and https://bpspubs.onlinelibrary.wiley.com/doi/full/10.1111/bph.14206, and as recommended by funding agencies, publishers and other organisations engaged with supporting research.
ACKNOWLEDGEMENTS
This work was supported by the National Natural Science Foundation of China (81771413, 81771412, and 81571280), the Beijing Natural Science Foundation Program and Scientific Research Key Program of Beijing Municipal Commission of Education (KZ201810025041), and the Distinguished Professor of Cheung Kong Scholars Program (T2014251).
Zhao H, Li G, Wang R, et al. Silencing of microRNA‐494 inhibits the neurotoxic Th1 shift via regulating HDAC2‐STAT4 cascade in ischaemic stroke. Br J Pharmacol. 2020;177:128–144. 10.1111/bph.14852
Haiping Zhao and Guangwen Li contributed equally to this work.
REFERENCES
- Alexander, S. P. H. , Christopoulos, A. , Davenport, A. P. , Kelly, E. , Marrion, N. V. , Peters, J. A. , … CGTP Collaborators (2017). The concise guide to pharmacology 2017/18: G protein‐coupled receptors. British Journal of Pharmacology, 174(Suppl 1), S17–S129. 10.1111/bph.13878 [DOI] [PMC free article] [PubMed] [Google Scholar]
- Alexander, S. P. H. , Kelly, E. , Marrion, N. V. , Peters, J. A. , Faccenda, E. , Harding, S. D. , … CGTP Collaborators (2017). The concise guide to pharmacology 2017/18: Other proteins. British Journal of Pharmacology, 174(Suppl 1), S1–S16. 10.1111/bph.13882 [DOI] [PMC free article] [PubMed] [Google Scholar]
- Alexander, S. P. H. , Roberts, R. E. , Broughton, B. R. S. , Sobey, C. G. , George, C. H. , Stanford, S. C. , … Ahluwalia, A. (2018). Goals and practicalities of immunoblotting and immunohistochemistry: A guide for submission to the British Journal of Pharmacology . British Journal of Pharmacology, 175, 407–411. 10.1111/bph.14112 [DOI] [PMC free article] [PubMed] [Google Scholar]
- Bigi, S. , Dulcey, A. , Gralla, J. , Bernasconi, C. , Melliger, A. , Datta, A. N. , … Steinlin, M. (2018). Feasibility, safety, and outcome of recanalization treatment in childhood stroke. Annals of Neurology, 83, 1125–1132. 10.1002/ana.25242 [DOI] [PubMed] [Google Scholar]
- Camelo, S. , Iglesias, A. H. , Hwang, D. , Due, B. , Ryu, H. , Smith, K. , … Dangond, F. (2005). Transcriptional therapy with the histone deacetylase inhibitor trichostatin A ameliorates experimental autoimmune encephalomyelitis. Journal of Neuroimmunology, 164, 10–21. 10.1016/j.jneuroim.2005.02.022 [DOI] [PubMed] [Google Scholar]
- Catanese, L. , Tarsia, J. , & Fisher, M. (2017). Acute ischemic stroke therapy overview. Circulation Research, 120, 541–558. 10.1161/CIRCRESAHA.116.309278 [DOI] [PubMed] [Google Scholar]
- Chen, C. , Jiang, W. , Liu, Z. , Li, F. , Yang, J. , Zhao, Y. , … Hu, X. (2018). Splenic responses play an important role in remote ischemic preconditioning‐mediated neuroprotection against stroke. Journal of Neuroinflammation, 15, 167 10.1186/s12974-018-1190-9 [DOI] [PMC free article] [PubMed] [Google Scholar]
- Cheng, H. S. , Besla, R. , Li, A. , Chen, Z. , Shikatani, E. A. , Nazari‐Jahantigh, M. , … Fish, J. E. (2017). Paradoxical suppression of atherosclerosis in the absence of microRNA‐146a. Circulation Research, 121, 354–367. 10.1161/CIRCRESAHA.116.310529 [DOI] [PMC free article] [PubMed] [Google Scholar]
- Curcio, M. , Salazar, I. L. , Mele, M. , Canzoniero, L. M. , & Duarte, C. B. (2016). Calpains and neuronal damage in the ischemic brain: The Swiss knife in synaptic injury. Progress in Neurobiology, 143, 1–35. 10.1016/j.pneurobio.2016.06.001 [DOI] [PubMed] [Google Scholar]
- Curtis, M. J. , Alexander, S. , Cirino, G. , Docherty, J. R. , George, C. H. , Giembycz, M. A. , … Ahluwalia, A. (2018). Experimental design and analysis and their reporting II: Updated and simplified guidance for authors and peer reviewers. British Journal of Pharmacology, 175, 987–993. 10.1111/bph.14153 [DOI] [PMC free article] [PubMed] [Google Scholar]
- Ellmeier, W. (2015). Molecular control of CD4+ T cell lineage plasticity and integrity. International Immunopharmacology, 28, 813–817. 10.1016/j.intimp.2015.03.050 [DOI] [PubMed] [Google Scholar]
- Geng, L. , Zhang, T. , Liu, W. , & Chen, Y. (2018). miR‐494‐3p modulates the progression of in vitro and in vivo Parkinson's disease models by targeting SIRT3. Neuroscience Letters, 675, 23–30. 10.1016/j.neulet.2018.03.037 [DOI] [PubMed] [Google Scholar]
- Gonzalez‐Zuniga, M. , Contreras, P. S. , Estrada, L. D. , Chamorro, D. , Villagra, A. , Zanlungo, S. , … Alvarez, A. R. (2014). c‐Abl stabilizes HDAC2 levels by tyrosine phosphorylation repressing neuronal gene expression in Alzheimer's disease. Molecular Cell, 56, 163–173. 10.1016/j.molcel.2014.08.013 [DOI] [PubMed] [Google Scholar]
- Harding, S. D. , Sharman, J. L. , Faccenda, E. , Southan, C. , Pawson, A. J. , Ireland, S. , … NC‐IUPHAR (2018). The IUPHAR/BPS guide to pharmacology in 2018: Updates and expansion to encompass the new guide to Immunopharmacology. Nucleic Acids Research, 46, D1091–D1106. 10.1093/nar/gkx1121 [DOI] [PMC free article] [PubMed] [Google Scholar]
- Hata, R. , Mies, G. , Wiessner, C. , Fritze, K. , Hesselbarth, D. , Brinker, G. , & Hossmann, K. A. (1998). A reproducible model of middle cerebral artery occlusion in mice: Hemodynamic, biochemical, and magnetic resonance imaging. Journal of Cerebral Blood Flow and Metabolism: Official Journal of the International Society of Cerebral Blood Flow and Metabolism, 18, 367–375. 10.1097/00004647-199804000-00004 [DOI] [PubMed] [Google Scholar]
- Hosokawa, H. , Tanaka, T. , Endo, Y. , Kato, M. , Shinoda, K. , Suzuki, A. , … Nakayama, T. (2016). Akt1‐mediated Gata3 phosphorylation controls the repression of IFNγ in memory‐type Th2 cells. Nature Communications, 7, 11289 10.1038/ncomms11289 [DOI] [PMC free article] [PubMed] [Google Scholar]
- Janssen, H. L. , Reesink, H. W. , Lawitz, E. J. , Zeuzem, S. , Rodriguez‐Torres, M. , Patel, K. , … Hodges, M. R. (2013). Treatment of HCV infection by targeting microRNA. The New England Journal of Medicine, 368, 1685–1694. 10.1056/NEJMoa1209026 [DOI] [PubMed] [Google Scholar]
- Joly, A. L. , Seitz, C. , Liu, S. , Kuznetsov, N. V. , Gertow, K. , Westerberg, L. S. , … Andersson, J. (2018). Alternative Splicing of FOXP3 controls regulatory T cell effector functions and is associated with human atherosclerotic plaque stability. Circulation Research, 122, 1385–1394. 10.1161/CIRCRESAHA.117.312340 [DOI] [PubMed] [Google Scholar]
- Kahl, A. , Blanco, I. , Jackman, K. , Baskar, J. , Milaganur Mohan, H. , Rodney‐Sandy, R. , … Hochrainer, K. (2018). Cerebral ischemia induces the aggregation of proteins linked to neurodegenerative diseases. Scientific Reports, 8, 2701 10.1038/s41598-018-21063-z [DOI] [PMC free article] [PubMed] [Google Scholar]
- Karakas, M. , & Zeller, T. (2017). A biomarker ocular: Circulating microRNAs toward diagnostics for acute ischemic stroke. Circulation Research, 121, 905–907. 10.1161/CIRCRESAHA.117.311758 [DOI] [PubMed] [Google Scholar]
- Kilkenny, C. , Browne, W. , Cuthill, I. C. , Emerson, M. , Altman, D. G. , & Group NCRRGW (2010). Animal research: Reporting in vivo experiments: The ARRIVE guidelines. British Journal of Pharmacology, 160, 1577–1579. [DOI] [PMC free article] [PubMed] [Google Scholar]
- Kim, H. A. , Whittle, S. C. , Lee, S. , Chu, H. X. , Zhang, S. R. , Wei, Z. , … Sobey, C. G. (2014). Brain immune cell composition and functional outcome after cerebral ischemia: Comparison of two mouse strains. Frontiers in Cellular Neuroscience, 8, 365. [DOI] [PMC free article] [PubMed] [Google Scholar]
- Korhonen, P. , Kanninen, K. M. , Lehtonen, S. , Lemarchant, S. , Puttonen, K. A. , Oksanen, M. , … Malm, T. (2015). Immunomodulation by interleukin‐33 is protective in stroke through modulation of inflammation. Brain, Behavior, and Immunity, 49, 322–336. 10.1016/j.bbi.2015.06.013 [DOI] [PubMed] [Google Scholar]
- Lan, Y. F. , Chen, H. H. , Lai, P. F. , Cheng, C. F. , Huang, Y. T. , Lee, Y. C. , … Lin, H. (2012). MicroRNA‐494 reduces ATF3 expression and promotes AKI. Journal of the American Society of Nephrology: JASN, 23, 2012–2023. 10.1681/ASN.2012050438 [DOI] [PMC free article] [PubMed] [Google Scholar]
- Li, B. , Concepcion, K. , Meng, X. , & Zhang, L. (2017). Brain‐immune interactions in perinatal hypoxic‐ischemic brain injury. Progress in Neurobiology, 159, 50–68. 10.1016/j.pneurobio.2017.10.006 [DOI] [PMC free article] [PubMed] [Google Scholar]
- Ma, X. , Nakayamada, S. , Kubo, S. , Sakata, K. , Yamagata, K. , Miyazaki, Y. , … Tanaka, Y. (2018). Expansion of T follicular helper‐T helper 1 like cells through epigenetic regulation by signal transducer and activator of transcription factors. Annals of the Rheumatic Diseases, 77, 1354–1361. 10.1136/annrheumdis-2017-212652 [DOI] [PubMed] [Google Scholar]
- Mao, L. , Li, P. , Zhu, W. , Cai, W. , Liu, Z. , Wang, Y. , … Hu, X. (2017). Regulatory T cells ameliorate tissue plasminogen activator‐induced brain haemorrhage after stroke. Brain: A Journal of Neurology, 140, 1914–1931. 10.1093/brain/awx111 [DOI] [PMC free article] [PubMed] [Google Scholar]
- Mathys, H. , Penney, J. , & Tsai, L. H. (2018). A developmental switch in microglial HDAC function. Immunity, 48, 476–478. 10.1016/j.immuni.2018.03.010 [DOI] [PubMed] [Google Scholar]
- McGrath, J. C. , & Lilley, E. (2015). Implementing guidelines on reporting research using animals (ARRIVE etc.): New requirements for publication in BJP . British Journal of Pharmacology, 172, 3189–3193. 10.1111/bph.12955 [DOI] [PMC free article] [PubMed] [Google Scholar]
- Nguyen, T. V. , Frye, J. B. , Zbesko, J. C. , Stepanovic, K. , Hayes, M. , Urzua, A. , … Doyle, K. P. (2016). Multiplex immunoassay characterization and species comparison of inflammation in acute and non‐acute ischemic infarcts in human and mouse brain tissue. Acta Neuropathologica Communications, 4, 100 10.1186/s40478-016-0371-y [DOI] [PMC free article] [PubMed] [Google Scholar]
- Omori, M. , Yamashita, M. , Inami, M. , Ukai‐Tadenuma, M. , Kimura, M. , Nigo, Y. , … Nakayama, T. (2003). CD8 T cell‐specific downregulation of histone hyperacetylation and gene activation of the IL‐4 gene locus by ROG, repressor of GATA. Immunity, 19, 281–294. 10.1016/S1074-7613(03)00210-3 [DOI] [PubMed] [Google Scholar]
- Qu, X. , Yu, H. , Jia, B. , Yu, X. , Cui, Q. , Liu, Z. , … Chu, Y. (2016). Association of downregulated HDAC 2 with the impaired mitochondrial function and cytokine secretion in the monocytes/macrophages from gestational diabetes mellitus patients. Cell Biology International, 40, 642–651. 10.1002/cbin.10598 [DOI] [PubMed] [Google Scholar]
- Salmon, M. , Gomez, D. , Greene, E. , Shankman, L. , & Owens, G. K. (2012). Cooperative binding of KLF4, pELK‐1, and HDAC2 to a G/C repressor element in the SM22α promoter mediates transcriptional silencing during SMC phenotypic switching in vivo. Circulation Research, 111, 685–696. 10.1161/CIRCRESAHA.112.269811 [DOI] [PMC free article] [PubMed] [Google Scholar]
- Schmitt, N. , & Ueno, H. (2015). Regulation of human helper T cell subset differentiation by cytokines. Current Opinion in Immunology, 34, 130–136. 10.1016/j.coi.2015.03.007 [DOI] [PMC free article] [PubMed] [Google Scholar]
- Shakespear, M. R. , Iyer, A. , Cheng, C. Y. , Das Gupta, K. , Singhal, A. , Fairlie, D. P. , & Sweet, M. J. (2018). Lysine deacetylases and regulated glycolysis in macrophages. Trends in Immunology, 39, 473–488. 10.1016/j.it.2018.02.009 [DOI] [PubMed] [Google Scholar]
- Singh, A. K. , Khare, P. , Obaid, A. , Conlon, K. P. , Basrur, V. , DePinho, R. A. , & Venuprasad, K. (2018). SUMOylation of ROR‐γt inhibits IL‐17 expression and inflammation via HDAC2. Nature Communications, 9, 4515 10.1038/s41467-018-06924-5 [DOI] [PMC free article] [PubMed] [Google Scholar]
- Song, S. , Lin, F. , Zhu, P. , Wu, C. , Zhao, S. , Han, Q. , & Li, X. (2017). Extract of Spatholobus suberctus Dunn ameliorates ischemia‐induced injury by targeting miR‐494. PLoS ONE, 12, e0184348 10.1371/journal.pone.0184348 [DOI] [PMC free article] [PubMed] [Google Scholar] [Retracted]
- Su, R. C. , Becker, A. B. , Kozyrskyj, A. L. , & Hayglass, K. T. (2008). Epigenetic regulation of established human type 1 versus type 2 cytokine responses. The Journal of Allergy and Clinical Immunology, 121, 57–63 e53. [DOI] [PubMed] [Google Scholar]
- Su, S. , Luo, Liu, X. , Liu, J. , Peng, F. , Fang, C. , & Li, B. (2017). miR‐494 up‐regulates the PI3K/Akt pathway via targetting PTEN and attenuates hepatic ischemia/reperfusion injury in a rat model. Bioscience Reports, 37, BSR20170798. [DOI] [PMC free article] [PubMed] [Google Scholar]
- Sun, Y. , Yang, Z. , Zheng, B. , Zhang, X. H. , Zhang, M. L. , Zhao, X. S. , … Wen, J. K. (2017). A novel regulatory mechanism of smooth muscle α‐actin expression by NRG‐1/circACTA2/miR‐548f‐5p axis. Circulation Research, 121, 628–635. 10.1161/CIRCRESAHA.117.311441 [DOI] [PubMed] [Google Scholar]
- Tan, Y. , Delvaux, E. , Nolz, J. , Coleman, P. D. , Chen, S. , & Mastroeni, D. (2018). Upregulation of histone deacetylase 2 in laser capture nigral microglia in Parkinson's disease. Neurobiology of Aging, 68, 134–141. 10.1016/j.neurobiolaging.2018.02.018 [DOI] [PubMed] [Google Scholar]
- Theodorou, G. L. , Marousi, S. , Ellul, J. , Mougiou, A. , Theodori, E. , Mouzaki, A. , & Karakantza, M. (2008). T helper 1 (Th1)/Th2 cytokine expression shift of peripheral blood CD4+ and CD8+ T cells in patients at the post‐acute phase of stroke. Clinical and Experimental Immunology, 152, 456–463. 10.1111/j.1365-2249.2008.03650.x [DOI] [PMC free article] [PubMed] [Google Scholar]
- Tian, D. C. , Shi, K. , Zhu, Z. , Yao, J. , Yang, X. , Su, L. , … Shi, F. D. (2018). Fingolimod enhances the efficacy of delayed alteplase administration in acute ischemic stroke by promoting anterograde reperfusion and retrograde collateral flow. Annals of Neurology, 84, 717–728. 10.1002/ana.25352 [DOI] [PMC free article] [PubMed] [Google Scholar]
- Tiedt, S. , Prestel, M. , Malik, R. , Schieferdecker, N. , Duering, M. , Kautzky, V. , … Dichgans, M. (2017). RNA‐Seq identifies circulating miR‐125a‐5p, miR‐125b‐5p, and miR‐143‐3p as potential biomarkers for acute ischemic stroke. Circulation Research, 121, 970–980. 10.1161/CIRCRESAHA.117.311572 [DOI] [PubMed] [Google Scholar]
- van Zandwijk, N. , Pavlakis, N. , Kao, S. C. , Linton, A. , Boyer, M. J. , Clarke, S. , … Reid, G. (2017). Safety and activity of microRNA‐loaded minicells in patients with recurrent malignant pleural mesothelioma: A first‐in‐man, phase 1, open‐label, dose‐escalation study. The Lancet Oncology, 18, 1386–1396. 10.1016/S1470-2045(17)30621-6 [DOI] [PubMed] [Google Scholar]
- Wang, G. , Shi, Y. , Jiang, X. , Leak, R. K. , Hu, X. , Wu, Y. , … Chen, J. (2015). HDAC inhibition prevents white matter injury by modulating microglia/macrophage polarization through the GSK3β/PTEN/Akt axis. Proceedings of the National Academy of Sciences of the United States of America, 112, 2853–2858. 10.1073/pnas.1501441112 [DOI] [PMC free article] [PubMed] [Google Scholar]
- Wang, J. , Zhao, H. , Fan, Z. , Li, G. , Ma, Q. , Tao, Z. , … Luo, Y. (2017). Long noncoding RNA H19 promotes neuroinflammation in ischemic stroke by driving histone deacetylase 1‐dependent M1 microglial polarization. Stroke, 48, 2211–2221. 10.1161/STROKEAHA.117.017387 [DOI] [PubMed] [Google Scholar]
- Wang, X. , Zhang, X. , Ren, X. P. , Chen, J. , Liu, H. , Yang, J. , … Fan, G. C. (2010). MicroRNA‐494 targeting both proapoptotic and antiapoptotic proteins protects against ischemia/reperfusion‐induced cardiac injury. Circulation, 122, 1308–1318. 10.1161/CIRCULATIONAHA.110.964684 [DOI] [PMC free article] [PubMed] [Google Scholar]
- Ward, N. S. (2017). Restoring brain function after stroke—Bridging the gap between animals and humans. Nature Reviews Neurology, 13, 244–255. 10.1038/nrneurol.2017.34 [DOI] [PubMed] [Google Scholar]
- Webb, G. J. , Siminovitch, K. A. , & Hirschfield, G. M. (2015). The immunogenetics of primary biliary cirrhosis: A comprehensive review. Journal of Autoimmunity, 64, 42–52. 10.1016/j.jaut.2015.07.004 [DOI] [PMC free article] [PubMed] [Google Scholar]
- Wendelboe, A. M. , & Raskob, G. E. (2016). Global burden of thrombosis: Epidemiologic aspects. Circulation Research, 118, 1340–1347. 10.1161/CIRCRESAHA.115.306841 [DOI] [PubMed] [Google Scholar]
- Wong, C. H. , Jenne, C. N. , Tam, P. P. , Leger, C. , Venegas, A. , Ryckborst, K. , … Kubes, P. (2017). Prolonged activation of invariant natural killer T cells and TH2‐skewed immunity in stroke patients. Frontiers in Neurology, 8, 6. [DOI] [PMC free article] [PubMed] [Google Scholar]
- Yashiro, T. , Kubo, M. , Ogawa, H. , Okumura, K. , & Nishiyama, C. (2015). PU.1 suppresses Th2 cytokine expression via silencing of GATA3 transcription in dendritic cells. PLoS ONE, 10, e0137699. [DOI] [PMC free article] [PubMed] [Google Scholar]
- Zhang, H. , Xia, Y. , Ye, Q. , Yu, F. , Zhu, W. , Li, P. , … Hu, X. (2018). In vivo expansion of regulatory T cells with IL‐2/IL‐2 antibody complex protects against transient ischemic stroke. The Journal of Neuroscience: The Official Journal of the Society for Neuroscience, 38, 10168–10179. 10.1523/JNEUROSCI.3411-17.2018 [DOI] [PMC free article] [PubMed] [Google Scholar]
- Zhang, Q. , Zhao, K. , Shen, Q. , Han, Y. , Gu, Y. , Li, X. , … Cao, X. (2015). Tet2 is required to resolve inflammation by recruiting Hdac2 to specifically repress IL‐6. Nature, 525, 389–393. 10.1038/nature15252 [DOI] [PMC free article] [PubMed] [Google Scholar]
- Zhao, G. , Miao, H. , Li, X. , Chen, S. , Hu, Y. , Wang, Z. , & Hou, Y. (2016). TGF‐β3‐induced miR‐494 inhibits macrophage polarization via suppressing PGE2 secretion in mesenchymal stem cells. FEBS Letters, 590, 1602–1613. 10.1002/1873-3468.12200 [DOI] [PubMed] [Google Scholar]
- Zhu, H. , Xie, R. , Liu, X. , Shou, J. , Gu, W. , Gu, S. , & Che, X. (2017). MicroRNA‐494 improves functional recovery and inhibits apoptosis by modulating PTEN/AKT/mTOR pathway in rats after spinal cord injury. Biomedicine & Pharmacotherapy = Biomedecine & Pharmacotherapie, 92, 879–887. [DOI] [PubMed] [Google Scholar]
- Zierath, D. , Kunze, A. , Fecteau, L. , & Becker, K. (2015). Promiscuity of autoimmune responses to MBP after stroke. Journal of Neuroimmunology, 285, 101–105. 10.1016/j.jneuroim.2015.05.024 [DOI] [PMC free article] [PubMed] [Google Scholar]