

Abstract
The prevalence of obesity-associated conditions raises new challenges in clinical medication. Although altered expression of drug-metabolizing enzymes (DMEs) has been shown in obesity, the impacts of obese levels (overweight, obesity, and severe obesity) on the expression of DMEs have not been elucidated. Especially, limited information is available on whether parental obese levels affect ontogenic expression of DMEs in children. Here, a high-fat diet (HFD) and three feeding durations were used to mimic different obese levels in C57BL/6 mice. The hepatic expression of five nuclear receptors (NRs) and nine DMEs was examined. In general, a trend of induced expression of NRs and DMEs (except for Cyp2c29 and 3a11) was observed in HFD groups compared to low-fat diet (LFD) groups. Differential effects of HFD on the hepatic expression of DMEs were found in adult mice at different obese levels. Family-based dietary style of an HFD altered the ontogenic expression of DMEs in the offspring older than 15 days. Furthermore, obese levels of parental mice affected the hepatic expression of DMEs in offspring. Overall, the results indicate that obese levels affected expression of the DMEs in adult individuals and that of their children. Drug dosage might need to be optimized based on the obese levels.
Key words: Diet-induced obesity, Overweight, High-fat diet, Drug-metabolizing enzymes, Nuclear receptors, Ontogenic expression
Abbreviations: 4-HA, adult mice fed with 4 weeks HFD; 4-LA, adult mice fed with 4 weeks LFD; 7-ER, 7-ethoxyresorufin; 8-HA, adult mice fed with 8 weeks HFD; 8-LA, adult mice fed with 8 weeks LFD; 18-HA, adult mice fed with 18 weeks HFD; 18-LA, adult mice fed with 18 weeks LFD; AhR, aryl hydrocarbon receptor; BMI, body mass index; CAR, constitutive androstane receptor; CHZ, chlorzoxazone; CYP2E1, cytochrome P450 2E1; DIO, diet-induced obesity; DMEs, drug-metabolizing enzymes; EFV, efavirenz; Gapdh, glyceraldehyde-3-phosphate dehydrogenase; HFD, high-fat diet; HNF4α, hepatocyte nuclear factor 4 alpha; LFD, low-fat diet; MDZ, midazolam; MPA, mobile phase A; MPB, mobile phase B; NADPH, nicotinamide adenine dinucleotide phosphate; NAFLD, non-alcoholic fatty liver disease; NRs, nuclear receptors; O-4-HA, offspring from parental mice fed with 4 weeks HFD; O-4-LA, offspring from parental mice fed with 4 weeks LFD; O-8-HA, offspring from parental mice fed with 8 weeks HFD; O-8-LA, offspring from parental mice fed with 8 weeks LFD; O-18-HA, offspring from parental mice fed with 18 weeks HFD; O-18-LA, offspring from parental mice fed with 18 weeks LFD; PBS, phosphate-buffered saline; PPARα, peroxisome proliferator-activated receptor alpha; PXR, pregnane X receptor; RSF, resorufin; RT-qPCR, real-time quantitative PCR; SD, standard deviation; SULT1A1, sulfotransferase 1A1; UGT1A1, uridine diphosphate glucuronosyltransferase 1A1
Graphical abstract
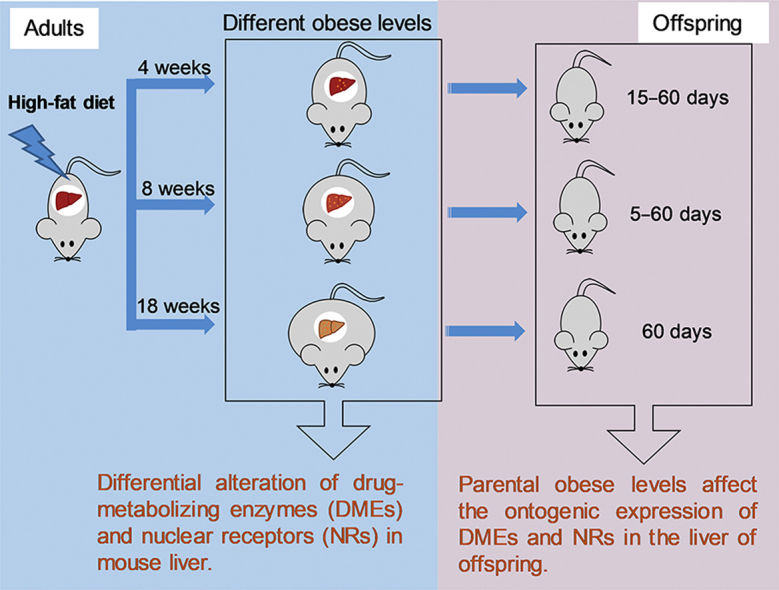
A high-fat diet and three feeding durations were used to mimic different obese levels in mice. The hepatic expression of five nuclear receptors and nine drug-metabolizing enzymes (DMEs) was examined. The results indicate that obese levels affected expression of the DMEs in adult individuals and that of their children. Drug dosage might need to be optimized based on the obese levels.
1. Introduction
Globally, overweight and obesity, which are defined as a body mass index (BMI) greater than 25 and 30 kg/m2, respectively, have become a serious epidemic health issue1, 2. In 2016, overweight and obesity affected more than 39% of adult population (1.9 billion) and 18% of children (340 million) worldwide, according to the updated data from the World Health Organization3, 4. Strikingly, the incidence of overweight and obesity continues rising at an alarming rate5, 6, 7, 8.
The prevalence of overweight and obesity elevates the incidence of many diseases, including type 2 diabetes, non-alcoholic fatty liver disease (NAFLD), cardiovascular diseases, and cancer9. For instance, the incidence rate of NAFLD in the general population is 20%–30%, whereas this prevalence increases dramatically to 80%–90% in the obese adult population10, 11. Overweight and obese populations consume on average more medications than non-obese individuals12, 13. Notably, it is well-documented that overweight and obese patients are more vulnerable to drug-induced toxicity as a consequence of altered drug metabolism in both adult and pediatric patients14, 15, 16, 17, 18. Thus, it is critical to elucidate mechanisms contributing to the dysregulated drug metabolism in overweight and obese individuals.
Evidence from a few clinical studies has shown that changed in vivo activities of drug-metabolizing enzymes (DMEs) may be accused for altering the drug metabolism in obese populations19, 20, 21. For example, induced cytochrome P450 2E1 (CYP2E1) activity was found to be associated with the high-risk of acetaminophen-induced liver injury in obese adults15, 22. However, these researches were confined to simply comparing the differential pharmacokinetics between (morbidly) obese and non-obese populations. There is a clue indicating that the degrees of obesity could impact the activity of DMEs20. Whereas, far less information is available in overweight adults on whether overweight alters activities of DMEs as well as the differential effects of obese levels (overweight, obesity, and severe obesity). Especially, the impacts of overweight and obesity on the expression of DMEs in children at younger ages have not been elucidated. Importantly, solutions for these questions have great significance for precision medicine as the proportion of overweight is much higher than that of obesity in humans and the prevalence of childhood obesity is increasing more dramatically than that of adult obesity2.
To investigate the causes, consequences, and the treatment of obesity, many animal models have been built, including monogenic models, e.g., ob/ob mice and db/db mice, as well as polygenic models, e.g., diet-induced obesity (DIO)23, 24. Though monogenic models are useful to study the role of specific targets or pathways in obesity, the DIO models are considered to better mimic the conditions of human obesity25, 26. Among the various models, the high-fat diet (HFD) DIO model in C57BL/6 mice is the most widely used25, 27. Studies in animal models of obesity also found altered expression of DMEs, as well as nuclear receptors (NRs), including constitutive androstane receptor (Car), pregnane X receptor (Pxr), hepatocyte nuclear factor 4 alpha (Hnf4α), and peroxisome proliferator-activated receptor alpha (Pparα)13, 28, 29, 30. Whereas, similar to the clinic researches, these scattered animal studies were limited to evaluate the expression of DMEs and NRs in the obese group versus the control group. Additionally, contradictory results were found due to differential experimental designs, such as strains, age, gender, and feeding durations of the animals as well as the animal models29, 31. As male mice are more sensitive than female mice to HFD, only male mice were recruited in most previous studies. Limited information is available on the consequence of an HFD-consumption on the expression of DMEs in female mice.
The goal of this work is to determine the impact of obese levels on hepatic expression of NRs and DMEs. In this study, C57BL/6 mice were fed with a low-fat diet (LFD) or HFD for different feeding durations to mimic different obese levels. The effects of HFD-feeding durations were comprehensively investigated on the expression of NRs and DMEs as well as the enzyme activities of selected DMEs in the liver of adult mice. Given the fact that childhood obesity is mostly owing to a family-based dietary style32, 33, the impacts of family-based consumption of an HFD were also studied on the ontogenic expression of NRs and DMEs in the liver of offspring mice. In addition, the consequences of HFD-feeding durations of parental mice on the hepatic expression of NRs and DMEs in the offspring were demonstrated in the present study. The generated knowledge may help to develop optimal dosage selections for overweight and obese populations in health care practice.
2. Materials and methods
2.1. Chemicals and reagents
Efavirenz (EFV) was purchased from TCI America lnc. (Portland, OR, USA). Chlorzoxazone (CHZ), 6-OH-CHZ, 7-ethoxyresorufin (7-ER), and nicotinamide adenine dinucleotide phosphate (NADPH) were obtained from Cayman Chemical (Ann Arbor, MI, USA). Midazolam (MDZ) and resorufin (RSF) were purchased from Sigma–Aldrich, lnc. (St. Louis, MO, USA). Formic acid and acetonitrile were purchased from Fisher Scientific Co. (Pittsburgh, PA, USA). Phosphate-buffered saline (PBS) was obtained from Research Products International Corp. (Mount Prospect, IL, USA).
2.2. Animal experiments
Male and female C57BL/6 mice (8-week old) were purchased from the Jackson laboratory- (Bar Harbor, ME, USA) and used for breeding. All mice were housed and bred under the standard conditions in the Animal Care Service Facility at the University of Connecticut (Storrs, CT, USA) in accordance with the animal care guidelines provided by the American Association for Animal Laboratory Sciences. All mice were allowed ad libitum access to food and water. The use of animals in the present study was approved by the Institutional Animal Care and Use Committee at the University of Connecticut.
A flow chart for the experimental design of the current study is shown in Supporting information Fig. S1. Briefly, both male and female mice (4–5 weeks old) were maintained on either a LFD containing 10 kcal% from fat (D12450J, Research Diets, New Brunswick, NJ, USA) or an HFD containing 60 kcal% from fat (D12492, Research Diets). Compositions of the diets are shown in Table 1. After 4, 8, or 18 weeks of diet treatment, some mice were sacrificed and liver tissues were collected to study the impacts of obese levels on the expression of NRs and DMEs in adult mice. The remaining mice with a LFD or HFD were mated and still maintained on a LFD or HFD, respectively, to assess the effects of parental obese levels on the expression of NRs and DMEs in offspring mice. Offspring younger than 21 days were fostered by the maternal mice. After weaning at day 21, the offspring had free access to food and water. All offspring were maintained on the same diet as their parental mice. Offspring mice were sacrificed at different ages after birth (days 5, 10, 15, 20, 30, or 60), and liver tissues were collected for further analyses. Body weight of all mice was monitored during the study. Liver tissues were weighted when the mice were sacrificed.
Table 1.
Composition of diets.
| Formula | LFD (# D12450J) | HFD (# D12492) |
|---|---|---|
| Fat (lard), kcal% | 10 | 60 |
| Protein, kcal% | 20 | 20 |
| Carbohydrate, kcal% | 70 | 20 |
| Energy density, kcal/g | 3.82 | 5.21 |
All values were obtained from Research Diets product data sheets (https://researchdiets.com/opensource-diets/dio-series-diets).
2.3. RNA isolation and real-time quantitative PCR (RT-qPCR)
Total RNAs were isolated from frozen liver tissues using a TRIzol reagent (Life Technologies, Guilford, CT, USA) according to the manufacture's protocols. The concentrations of total RNAs were quantified spectrophotometrically at 260 nm and the purities were confirmed by 260/280 using a NanoDrop 2000c spectrophotometer (Thermo Fisher Scientific, Waltham, MA, USA). The cDNAs were synthesized from total RNAs using an iScript Reverse Transcription Supermix (Bio–Rad Laboratories, Hercules, CA, USA) according to the manufacture's protocols. RT-qPCR was performed using a CFX96 Real-Time System (Bio–Rad Laboratories). The mRNA expression of aryl hydrocarbon receptor (Ahr) and glyceraldehyde-3-phosphate dehydrogenase (Gapdh) was determined using an iTaq Universal SYBR Green Supermix (Bio–Rad Laboratories) with specific primers. The sequences of the primers were as follows: Ahr (sense), 5′-ACCAGAACTGTGAGGGTTGG-3′; Ahr (anti-sense), 5′-CTCCCATCGTATAGGGAGCA-3′; Gapdh (sense), 5′-GGTGAAGGTCGGTGTGAAC-3′; Gapdh (anti-sense), 5′-GAGTGGAGTCATAACTGGAAC-3′. The mRNA expression of other genes was measured using a TaqMan gene expression assays (Thermo Fisher Scientific). The identification numbers of each gene are listed in Table 2. Relative mRNA expression levels were calculated by normalizing examined genes against Gapdh using the 2−ΔΔCt method. In the study of ontogenic expression, the differences of mRNA expression were also expressed as 2−ΔCt compared to Gapdh as described in a previous study34.
Table 2.
TaqMan assay used for RT-qPCR.
| Gene | Assay ID |
|---|---|
| Nr1i3 (Car) | Mm01283978_m1 |
| Nr1i2 (Pxr) | Mm01344139_m1 |
| Hnf4α | Mm00433964_m1 |
| Pparα | Mm00440939_m1 |
| Cyp1a1 | Mm00487218_m1 |
| Cyp1a2 | Mm00487224_m1 |
| Cyp2e1 | Mm00491127_m1 |
| Cyp2b10 | Mm01972453_s1 |
| Cyp2c29 | Mm00725580_s1 |
| Cyp3a11 | Mm00731567_m1 |
| Cyp3a16 | Mm00655824_m1 |
| Ugt1a1 | Mm02603337_m1 |
| Sult1a1 | Mm00467072_m1 |
| Gapdh | Mm99999915_g1 |
2.4. Enzyme activities in mouse liver S9
Liver S9 was obtained by homogenizing liver tissue in 1× PBS (pH 7.4) followed by centrifugation at 9800 rpm (Centrifuge 5415R, Eppendorf, Hamburg, Germany) for 30 min. Protein concentrations were measured using a Pierce BCA Protein Assay Kit (Thermo Fisher Scientific). To determine the enzyme activities of CYP1A, 2B10, 2E1, and 3A, 7-ER, EFV, CHZ, and MDZ were used as probe substrates and the formation of RSF, 8-OH-EFV, 6-OH-CHZ, and 1-OH-MDZ was detected, respectively35, 36, 37, 38. Incubations were performed in 1× PBS (pH 7.4), containing 1 μg/μL S9, 1 mmol/L NADPH, and the probe substrate (10 μmol/L 7-ER, 30 μmol/L EFV, 100 μmol/L CHZ, or 15 μmol/L MDZ, respectively). After 10 min of incubation, the reactions were terminated by adding 100 μL of ice-cold acetonitrile/methanol (1:1, v/v).
After 10 min of centrifugation at 15,000 rpm (Centrifuge 5415R, Eppendorf, Hamburg), a 2 μL aliquot of supernatant was injected into a SYNAPT G2-S QTOFMS system (Waters Corp., Milford, MA, USA) for metabolite analysis. Chromatographic separation of metabolites was performed on an Acquity UPLC BEH C18 column (50 mm × 2.1 mm, 1.7 mm; Waters Corp.). Mobile phase A (MPA) consisted of 0.1% formic acid in water and mobile phase B (MPB) consisted of 0.1% formic acid in acetonitrile. The gradient for aqueous extraction began at 5% MPB and held for 0.5 min, followed by 1.9 min linear gradient to 95% MPB, held for 2 min, and decreased to 5% MPB for column equilibration. The flow rate of the mobile phase was 0.5 mL/min and the column temperature was maintained at 50 °C. The G2-S QTOFMS system was operated in a resolution mode (for RSF, 8-OH-EFV, and 1-OH-MDZ) or sensitive mode (for 6-OH-CHZ) with electrospray ionization. The source and desolvation temperatures were set at 150 °C and 500 °C, respectively. Nitrogen was applied as the cone gas (50 L/h) and desolvation gas (800 L/h). The capillary and cone voltages were set at 0.8 kV and 40 V. The data were acquired in a positive (for 1-OH-MDZ) or negative (for RSF, 8-OH-EFV, and 6-OH-CHZ) ionization mode. QTOFMS was calibrated with sodium formate and monitored by the intermittent injection of lock mass leucine encephalin (m/z = 556.2771) in real time. QuanLynx software (Waters Corp.) was used for quantification of the concentrations of metabolites.
Enzyme reactions were validated to be linear over a 10-min incubation period. The linear ranges of detection for RSF, 8-OH-EFV, 6-OH-CHZ, and 1-OH-MDZ were 1–500, 1–1000, 1–1000, and 1–1000 ng/mL, respectively.
2.5. Statistical analysis
Data are presented as the mean ± standard deviation (SD). Statistical analyses were performed using IBM SPSS 25 (IBM, Armonk, NY, USA). A comparison between two groups was performed using an unpaired Student's t-test. A value of P < 0.05 was considered to be significant.
3. Results
3.1. Consequences of obese levels on adult mice
An experiment illustrated in Fig. 1A was performed to investigate the consequences of obese levels on adult mice. An HFD-induced obesity model was used in the current study as it is more closely imitated the status of human obesity than other genetically modified models23, 26. Both male and female C57BL/6 mice (4–5 weeks) were fed with a LFD (10 kcal% from fat) or HFD (60 kcal% from fat) for a series of durations (4, 8, or 18 weeks) to mimic different obese levels in humans. Body weight of the mice was monitored during the study. At the end of each feeding duration, livers were weighted and collected to determine the expression of NRs and DMEs.
Figure 1.

Impacts of HFD-feeding durations on the body weight gain, liver weight, and liver appearance of adult mice. (A) A schematic study design. Male and female mice (4–5 weeks old) were fed with either a LFD or HFD for 4, 8, or 18 weeks (n = 3–7 per group). Body weight gain (B) and liver weight (C) of both male and female adult mice after different feeding durations under a LFD or HFD were measured. (D) Representative liver images from each group. Data are depicted as mean ± SD. Each dot represents a value from one mouse. Statistical significance between two groups was determined by an unpaired Student's t-test. *P < 0.05, **P < 0.01, ***P < 0.001, HFD versus the corresponding LFD groups.
In this study, adult mice fed with a LFD for 4, 8, or 18 weeks were referred to as 4-LA, 8-LA, or 18-LA, respectively; adult mice fed with an HFD for 4, 8, or 18 weeks were referred to as 4-HA, 8-HA, or 18-HA, respectively.
3.1.1. Impacts of HFD-feeding duration on body weight and liver of adult mice
As seen in Fig. 1B, consumption of an HFD led to a higher gained body weight in both genders compared to the corresponding LFD groups. Moreover, along with extended feeding duration, the gained body weight increased in both male and female adult mice. Whereas, lower gained body weight was observed in females compared to males in the same feeding duration groups (Fig. 1B).
Consistent with the heavier gained body weight of mice with a longer feeding duration, liver weight increased along with feeding duration extended (Fig. 1C). However, significantly heavier liver weight was only found in male 18-HA mice compared to the male LFD groups (Fig. 1C). A slightly lighter liver weight was seen in the male 4-HA group (Fig. 1C). No difference in liver weight was observed between the HFD groups and the corresponding LFD groups in females (Fig. 1C).
Representative liver photos from each group are shown in Fig. 1D. Consistent with the trend of the body weight gain, more severe fat accumulation was observed in the liver of 18-HA mice than that of 4-HA mice. There was less fat accumulation in the liver of females in comparison with the male groups fed with same weeks of HFD.
Taken together, these results suggest that HFD-feeding durations affect the levels of obesity in both genders and males are more susceptible to HFD than females in mice.
3.1.2. Effects of HFD-feeding duration on the hepatic expression of NRs and DMEs in adult mice
To explore whether obese levels affect the expression of NRs and DMEs in mouse liver, the hepatic mRNA expression of 5 NRs (Car, Pxr, Hnf4α, Pparα, and Ahr) and 9 DMEs (Cyp1a1, 1a2, 2b10, 2c29, 2e1, 3a11, 3a16, Ugt1a1, and Sult1a1), as well as the enzyme activities of CYP1A, 2B, 2E1, and 3A, were measured in this study (Fig. 2).
Figure 2.

Effects of HFD-feeding durations on the hepatic expression of NRs and DMEs in adult mice. Male and female mice (4–5 weeks old) were fed with either a LFD or HFD for 4, 8, or 18 weeks (n = 3–7 per group). At the end of each period, liver tissues were collected to determine the mRNA expression levels of NRs and DMEs and the enzyme activities of selected DMEs. (A)–(K) The mRNA expression levels were determined using the RT-qPCR method and normalized to Gapdh. The relative mRNA expression levels were calculated using the 2−ΔΔCt method compared to the LFD groups. (L) Enzyme activities of CYP1A, 2B, 2E, and 3A in four random selected male adult mice after 8 weeks with a LFD or HFD were determined by the UPLC-QTOFMS method and expressed as the formation rates of RSF, 8-OH-EFV, 6-OH-CHZ, and 1-OH-MDZ, respectively. Data are depicted as mean ± SD. Each dot represents a value from one mouse. Statistical significance between two groups was determined by an unpaired Student's t-test. *P < 0.05, **P < 0.01, ***P < 0.001, HFD versus the corresponding LFD groups.
Compared to the corresponding LFD groups, HFD-fed male mice were found to have a comparatively higher mRNA expression of Car (∼2.0-fold) and Pparα (∼1.6-fold) in all three HFD groups (Fig. 2A and D). The mRNA expression of Pxr was only increased in the 4-HA group in comparison with the related LFD group in males (Fig. 2B). For the mRNA expression of Hnf4α, consumption of an HFD for 4 weeks resulted in a 2.0-fold induced expression in males compared to the male 4-LA group (Fig. 2C). Interestingly, the upregulated effects of HFD on Hnf4α were attenuated in longer feeding duration groups as no difference was seen between 8-LA and 8-HA groups, while a 40% reduced expression in the 18-HA group compared to the related LFD group (Fig. 2C). In females, increased mRNA expression of Hnf4α and Pparα was observed in the mice fed with an HFD for 8 weeks but not 4 or 18 weeks versus the corresponding LFD groups (Fig. 2C and D). For the mRNA level of Ahr, only an induced expression was observed in female mice with an HFD, but not in males (Fig. 2E). However, there was no difference in the mRNA expression of Car and Pxr between the LFD and HFD groups for all three feeding durations in the liver of female mice (Fig. 2A and B).
Gene-specific and gender-different effects of HFD on the mRNA expression of DMEs were also found (Fig. 2F–K). For Cyp1a1, only the longest (18 weeks) feeding duration of HFD led to a slightly induced expression in males, whereas the shorter (4 and 8 weeks) but not the longest feeding durations of HFD increased its expression in females (Fig. 2F). Compared to the related LFD groups, elevated mRNA expression of Cyp1a2 and 2e1 was only observed in the male 4-HA group (Fig. 2G and I). However, the mRNA expression of Ugt1a1 was higher in the 8-HA and the 18-HA groups but not the 4-HA group in males (Fig. 2J). Notably, consumption of an HFD for all three durations resulted in significantly higher mRNA expression of Cyp2b10 in males not in females (Fig. 2H). Moreover, the induction extent of Cyp2b10 was bigger in the groups with 4 weeks HFD (46-fold) than that of 8 and 18 weeks. In females, consistent with the increased mRNA expression of Hnf4α and Pparα, the mRNA expression of Cyp1a2, 2e1, Ugt1a1, and Sult1a1 was only higher in the 8-HA group not another two groups compared to the corresponding LFD groups. No difference in the mRNA expression of Cyp2c29, 3a11, and 3a16 was seen between the LFD and the HFD groups for all three feeding durations (data not shown).
The enzyme activities of CYP1A, 2B, 2E, and 3A were tested with four random selected male livers from the mice fed with a LFD or HFD for 8 weeks. As seen in Fig. 2L, the enzyme activity of CYP2B (8-OH-EFV) was 1.7-fold higher in the liver of 8-HA mice, while no difference in the enzyme activities of CYP1A (RSF), 2E (6-OH-CHZ), and 3A (1-OH-MDZ) compared to the LFD group. These results were consistent with the mRNA expression of corresponding DMEs.
Taken together, these findings indicate that the obese levels of the DIO model, which were built by maintained for different durations of an HFD, affect the expression of NRs and DMEs in mice liver and these effects are gene and gender specific.
3.2. Consequences of consumption of an HFD on offspring mice
Given that parental factors, e.g., dietary style and genetic background, are highly associated with childhood obesity32, the consequences of family-based consumption of an HFD were next investigated on offspring. As depicted in Fig. 3A, parental mice were mated after fed with a LFD or HFD for 8 weeks. Offspring mice were sacrificed at different ages (postnatal days 5, 10, 15, 20, 30, or 60) and body weight and liver weight were measured. Liver tissues were collected to determine the expression of NRs and DMEs.
Figure 3.

Impacts of parental HFD on the body weight and liver weight of offspring. (A) A schematic study design. After being fed with either a LFD or HFD for 8 weeks at an age of 4–5 weeks, mice were mated. The offspring were sacrificed at different ages after birth (n = 3–6 per group). Body weight (B) and liver weight (C) of offspring were measured. Data are depicted as mean ± SD. Each dot represents a value from one mouse. Statistical significance between two groups was determined by an unpaired Student's t-test. *P < 0.05, **P < 0.01, ***P < 0.001, HFD versus the age-matched LFD groups.
In this study, offspring from parental mice fed with a LFD or HFD for 8 weeks were referred as O-8-LA or O-8-HA, respectively.
3.2.1. Impacts of consumption of an HFD on the body weight and liver weight of offspring mice
As seen in Fig. 3B, consumption of an HFD resulted in increased body weight of offspring mice compared to the related LFD group at postnatal day 5. Moreover, the body weight of 60-day male offspring and 20-day female offspring in the HFD groups was higher than that of age-matched LFD groups (Fig. 3B). Consistent with the increased body weight, the liver weight of O-8-HA offspring at day 5 was heavier than that of the LFD-groups for both genders (Fig. 3C). However, decreased liver weight was observed in the O-8-HA mice in comparison with the O-8-LA mice at 30-day age in both male and female mice (Fig. 3C).
3.2.2. Effects of consumption of an HFD on the hepatic expression of NRs in offspring mice
Generally, consumption of an HFD led to increased mRNA expression of NRs in offspring older than 20 days compared to the age-matched LFD groups (Fig. 4). The mRNA expression of Car was higher in both days 30 and 60 offspring from HFD-fed mice than that of O-8-LA mice (Fig. 4A). The mRNA expression of Pxr and Hnf4α in the liver of 30-day offspring was also induced by HFD (Fig. 4B and C). For Pparα, elevated expression was only observed in O-8-HA mice at day 60 compared to the related LFD groups (Fig. 4D). Higher expression of Ahr was seen in the O-8-HA mice at day 60 for males and day 30 for females compared to the LFD groups (Fig. 4E).
Figure 4.

Effects of parental HFD on the hepatic expression of NRs in offspring. The offspring derived from parental mice fed with a LFD or HFD for 8 weeks were sacrificed at different ages after birth (n = 3–6 per group). The liver tissues were collected to determine the mRNA expression levels of NRs. The mRNA expression levels were measured using the RT-qPCR method and calculated using the 2−ΔΔCt method with normalizations to Gapdh. Data are depicted as mean ± SD. Each dot represents a fold change in gene expression of one mouse. Statistical significance between two groups was determined by an unpaired Student's t-test. *P < 0.05, **P < 0.01, ***P < 0.001, HFD versus the age-matched LFD groups.
3.2.3. Effects of consumption of an HFD on the ontogenic expression of DMEs in offspring livers
It is well-established that liver is not fully developed in newborns and children and undergoes a period of maturation, during which many DMEs display distinct ontogenic expression patterns and the metabolic function is not comparable to that of adult39, 40. Fig. 5 shows that altered ontogenetic expression of DMEs in the offspring livers by consumption of an HFD.
Figure 5.

Effects of parental HFD on the ontogenic expression patterns of DMEs in offspring liver. The offspring derived from parental mice fed with a LFD or HFD for 8 weeks were sacrificed at different ages after birth (n = 3–6 per group). The liver tissues were collected to determine the mRNA expression levels and enzyme activities of DMEs. (A)–(F) The mRNA expression levels were measured using the RT-qPCR method and normalized to Gapdh. The upper panels (relative mRNA expression levels) were calculated using the 2−ΔΔCt method compared to the LFD groups. The lower panels (mRNA expression levels) were expressed as 2–[Ct(DMEs) − Ct(Gadph)]. (G) Enzyme activities of CYP1A, 2B, 2E, and 3A in four random selected male offspring at day 30 from the LFD or HFD group were determined by the UPLC–QTOFMS method and expressed as the formation rates of RSF, 8-OH-EFV, 6-OH-CHZ, and 1-OH-MDZ, respectively. Data are depicted as mean ± SD. Each dot represents a value from one mouse. Statistical significance between two groups was determined by an unpaired Student's t-test. *P < 0.05, **P < 0.01, ***P < 0.001, HFD versus the age-matched LFD groups.
Compared to the age-matched LFD groups, the relative mRNA expression of Cyp1a1 in the O-8-HA mice was decreased at day 5 in both genders, whereas increased at days 30 and 60 in females (Fig. 5A, upper panel); however, the alteration may contribute little to drug metabolism due to the low basal expression level of Cyp1a1 in mouse liver (Fig. 5A, lower panel). The fold change of Cyp1a2 mRNA expression was significantly higher in the O-8-HA groups at days 30 and 60 for both males and females compared to age-related O-8-LA groups (Fig. 5B, upper panel). Moreover, consumption of an HFD altered the ontogenic pattern of Cyp1a2 expression (Fig. 5B, lower panel). In LFD groups, the ontogenic pattern of Cyp1a2 was adolescent-enriched, which had the highest expression level at days 15 and 20 after birth; however, in the HFD groups, it was an adult-enriched pattern, which had a trend to keep growing with age (Fig. 5B, lower panel). Similarly, the relative expression of Cyp2e1 was increased in the days 30 and 60 male offspring from the HFD-fed mice and its ontogenic expression pattern changed from an adolescent-enriched pattern to an adult-enriched pattern in both males and females; whereas, a decreased expression of Cyp2e1 was seen in the female offspring at day 20 by consumption of an HFD (Fig. 5C). The relative expression of Cyp3a16 (a neonatal-enriched pattern) was decreased in 15-day male and 60-day female offspring, as well as increased at 20-day male offspring, by consumption of an HFD compared to the age-related LFD groups (Fig. 5D). Higher relative mRNA expression of Ugt1a1 at day 30 and lower relative mRNA expression of Sult1a1 at days 20 and 30 were seen in the O-8-HA groups compared to the corresponding LFD groups (Fig. 5E and F, upper panel). For Ugt1a1 and Sult1a1, no dramatically altered mRNA expression levels were observed after birth as other DMEs (Fig. 5E and F; lower panel). Both the relative expression levels and ontogenic patterns of Cyp2b10, 2c29, and 3a11 showed no difference between the HFD groups and the related LFD groups (data not shown).
The enzyme activities of CYP1A, 2B, 2E, and 3A in the liver of four random selected 30-day male O-8-HA or O-8-LA mice are shown in Fig. 5G. Comparable levels of enzyme activities of CYPs were found between the HFD groups and the corresponding LFD groups.
Overall, these results suggest that family-based consumption of an HFD alters the hepatic expression of DMEs in offspring at day 5 or older than 15 days and changes the ontogenic patterns of DMEs in mouse liver.
3.3. Consequences of obese levels of parental mice on offspring mice
Then, whether obese levels of parental mice were associated with the impacts on offspring mice was assessed. As depicted in Fig. 6A, parental mice were mated after fed with a LFD or HFD for different durations (4 or 18 weeks) to mimic different obese levels. Based on the result in the offspring from mice fed with an HFD for 8 weeks, the livers of offspring mice older than postnatal day 15 were collected in this study.
Figure 6.

Impacts of HFD-feeding durations of parental mice on the body weight and liver weight of offspring. (A) A schematic study design. After being fed with either a LFD or HFD for 4 or 18 weeks at an age of 4–5 weeks, mice were mated. The offspring were sacrificed at different ages after birth (n = 3–6 per group). Body weight and liver weight of offspring were measured. (B) Body weight and liver weight of male and female offspring (postnatal days 15, 20, 30, or 60) derived from parental mice fed with a LFD or HFD for 4 weeks. (C) Body weight and liver weight of male offspring (postnatal day 60) derived from parental mice fed with a LFD or HFD for 18 weeks. Data are depicted as mean ± SD. Each dot represents a value from one mouse. Statistical significance between two groups was determined by an unpaired Student's t-test. **P < 0.01, ***P < 0.001, HFD versus the age-matched LFD groups.
In this study, offspring from parental mice fed with a LFD for 4 or 18 weeks were referred to as O-4-LA or O-18-LA, respectively; offspring from parental mice fed with an HFD for 4 or 18 weeks were referred to as O-4-HA or O-18-HA, respectively.
3.3.1. Impacts of HFD-feeding durations of parental mice on the body weight and liver weight of offspring
For the offspring from mice fed with a LFD or HFD for 4 weeks, the body weight of O-4-HA mice was higher than that of the O-4-LA mice at postnatal days 20 and 60 (Fig. 6A). Consistent with the increased body weight at day 20, the liver weight of 20-day O-4-HA mice was heavier than that of 20-day O-4-LA mice (Fig. 6B).
Due to the impaired fertility on mice by consumption of an HFD41, 42, 43, 44, few offspring were obtained from the mice fed with an HFD for 18 weeks. Thus, only data of male O-18-LA and O-18-HA mice at day 60 after birth were analyzed here. As seen in Fig. 6C, the body weight of day 60 male offspring in the HFD group is higher than that of the LFD group. However, there is no difference in the liver weight between the LFD groups and the HFD groups (Fig. 6C).
3.3.2. Effects of HFD-feeding durations of parental mice on the hepatic expression of NRs in offspring mice
In the liver of 20-day O-4-HA mice, the mRNA expression of Car in both genders, Pparα in females, and Ahr in males was decreased compared to the corresponding LFD groups (Fig. 7A, D, and E). The mRNA expression of Pxr at 15-day age in the O-4-HA group was also lower than that of the O-4-LA group in females (Fig. 7B). Increased mRNA expression of Car and Hnf4α was seen in the liver of 30-day male offspring from 4-HA mice in comparison with the age-matched LFD groups (Fig. 7A and C). Moreover, the mRNA expression of Pxr was higher in female O-4-HA group at day 60, while Pparα at both days 30 and 60 in both genders compared to the related LFD groups (Fig. 7B and D).
Figure 7.

Effects of HFD-feeding durations of parental mice on the hepatic expression of NRs in offspring. After being fed with either a LFD or HFD for 4 or 18 weeks, mice were mated. The offspring were sacrificed at different ages after birth (n = 3–6 per group). The liver tissues were collected to determine the mRNA expression levels of NRs. (A)–(E) The mRNA expression of NRs in the liver of offspring derived from LFD- or HFD-fed parental mice for 4 weeks. (F) The mRNA expression levels of NRs in the liver of offspring derived from LFD- or HFD-fed parental mice for 18 weeks. The mRNA expression levels were measured using the RT-qPCR method and calculated using the 2−ΔΔCt method with normalizations to Gapdh. Data are depicted as mean ± SD. Each dot represents a fold change in gene expression of one mouse. Statistical significance between two groups was determined by an unpaired Student's t-test. *P < 0.05, **P < 0.01, ***P < 0.001, HFD versus the age-matched LFD groups.
For the 60-day male O-18-HA mice, the hepatic mRNA expression of Hnf4α and Pparα was significantly increased in comparison with the related LFD groups (Fig. 7F). There was no difference in the expression of Car, Pxr, and Ahr between the O-18-HA and O-18-LA mice at day 60.
3.3.3. Effects of HFD-feeding durations of parental mice on the hepatic expression of DMEs in offspring mice
In the liver of 15-day offspring from 4-HA mice, decreased mRNA expression of Cyp2c29 but not the other DMEs was observed compared to the related LFD groups (Fig. 8). Consistent with the reduced expression of Car and Ahr in the male O-4-HA group at day 20, the mRNA expression levels of Cyp1a1, 1a2, 2c29, 2e1, 3a11, Ugt1a1, and Sult1a1 were decreased as well in comparison with the O-4-LA group at day 20 (Fig. 8). Thirty-day old offspring in the O-4-HA group had a higher hepatic mRNA expression of Cyp1a1, 1a2, 2e1, and Ugt1a1 in males, as well as Cyp1a1 and 2b10 in females, than that of the corresponding O-4-LA groups. Strikingly, reduced hepatic expression of Cyp2c29, 3a11, and Sult1a1 was found in the O-4-HA mice at day 60 compared to the age-related O-4-LA mice (Fig. 8).
Figure 8.

Effects of HFD-feeding durations of parental mice on the hepatic expression levels of DMEs in offspring. (A)–(H) The mRNA expression levels of DMEs in the liver of offspring derived from LFD- or HFD-fed parental mice for 4 weeks (n = 5–6 per group). The mRNA expression levels were determined using the RT-qPCR method and calculated using the 2–ΔΔCt method with normalizations to Gapdh. Data are depicted as mean ± SD. Each dot represents a fold change in gene expression of one mouse. Statistical significance between two groups was determined by an unpaired Student's t-test. *P < 0.05, **P < 0.01, ***P < 0.001, HFD versus the age-matched LFD groups.
There was no difference in the hepatic mRNA expression of DMEs between the O-18-LA group and the O-18-HA group (data not shown).
In summary, the data indicate that obese levels of parental mice are associated with the consequences of consumption of an HFD on offspring mice.
4. Discussion
The present study demonstrated that obese levels were associated with the consequences of consumption of an HFD on the hepatic expression of NRs and DMEs in a mouse model. Maintenance on an HFD (family-based dietary style) altered the ontogenetic expression of NRs and DMEs was also illustrated in the liver of offspring mice. Furthermore, obese levels of parental mice contributed to the differential effects of HFD were observed on the hepatic expression of NRs and DMEs in offspring. To the best of our knowledge, this is the first study systematically demonstrating the impacts of obese levels on hepatic expression of NRs and DMEs in both adults and offspring in mice.
Animal models are extremely helpful in understanding obesity. However, a standard threshold for obesity in animals like BMI in humans has not been developed45. In this study, the feeding durations of 4, 8, and 18 weeks were selected to mimic different levels of obesity in male mice based on previous researches. In most studies, male mice maintained on an HFD for 4 weeks were considered as a short-term HFD, which featured with obviously higher bodyweight than that of LFD groups in males46; HFD feeding for 8 weeks was considered to sufficiently build a DIO model47, 48, 49; mice fed with an HFD for over 12 weeks were commonly used as obesity-induced disease models, which could be referred to as severe obesity50, 51. Some researchers have attempted to evaluate the degree of obesity by comparing body weight of the experimental groups to the control groups52, 53, 54. The values that are 10%–25% (mostly 20%) greater body weight than the control groups as overweight or moderate obesity and greater than 40% as severe obesity45, 52, 55, 56. In the present study, the body weight of male mice after 8 weeks of HFD was 19% higher than the related LFD groups, which were consider as moderate obesity (Supporting information Table S1). After consumption of an HFD for 18 weeks, the body weight of males was 54% higher and that of females was 19% heavier than the gender-matched LFD groups, which were considered as severe obesity and moderate obesity, respectively (Table S1). Though this classification is rough, it is reasonable to mimic different stages of obesity and/or overweight as greater differences in body weight gained between LFD and HFD groups were observed in the longer duration groups, indicating that obese levels became more severe (Fig. 1B). In the further study, a more precise method, such as dual-energy X-ray absorptiometry, may be used to evaluate the specific status of individual animals and standard assessment of obese levels in animal models is desiderated.
A number of researches have reported that obesity could alter the expression of DMEs and may subsequently change the metabolism of drugs19, 29. However, it is difficult to draw conclusions out of these studies because the differential experimental designs. It is also unclear whether obese levels (overweight, obesity, and severe obesity) are factors that contribute to the controversial results in the previous studies. Here, feeding duration, which referred to different obese levels, affected the impacts of an HFD on the hepatic expression of DMEs in an adult mouse model was demonstrated (Fig. 2). In general, consumption of an HFD led to an increased expression of Cyp1a1, 1a2, 2b10, and 2e1 as well as an elevated expression of Ugt1a1 and Sult1a1, whereas no effects on the expression of Cyp2c29, 3a11, and 3a16 in adult mice (Fig. 2). Similar to our findings, clinical studies also suggested trends of higher clearance values mediated by most DMEs (except for CYP3A4) in obese as compared with non-obese individuals, indicating an increase in the enzyme activities of DMEs19. Furthermore, when corrected for body weight, for example, CYP1A2-mediated clearance in obese versus non-obese subject showed both higher and lower values in different studies19. This phenomenon can be explained by our data. As seen in Fig. 2G, consumption of an HFD for 4 weeks resulted in a significant increased expression of Cyp1a2, while mice fed with an HFD for 18 weeks showed a heavier body weight but a trend of decreased expression of Cyp1a2. Thus, varied results may be obtained due to individuals at different obese levels were recruited in different studies. Consistent with the trend of an induced expression of Cyp2e1 in the HFD mice versus the LFD counterparts in this study, Tomankova et al.57 reported an increased activity of CYP2E1 in monosodium glutamate-induced obese mice. However, studies, which conducted in ob/ob mice, observed a decreased activity of CYP2E129. For CYP3A11, studies using male ICR mice or CD1 mice fed with an HFD demonstrated a significantly decrease of Cyp3a11 expression, whereas no difference was observed in the current study58, 59. As species, strain, and gene background of animal models are well-documented factors affecting the consequences of obesity, data may be not comparable between studies conducted by different study groups. Though our data provide a new insight into the role of obese levels in the drug metabolism, these impacts should be confirmed in different animal models even in humans in the future studies. Experiments related to in vivo enzyme activities of DMEs will also be performed in future.
Different effects by genders on the expression of NRs and DMEs by HFD consumption were observed. Consistent with previous studies, male mice were more susceptible to an HFD than female mice in the current study as heavier body weight gain and more severe lipid accumulation in the liver were seen in males (Fig. 1B and D). It's also well documented that the basal expression of DMEs has sexual dimorphism60. The phenomenon that differential effects of an HFD consumption for same durations on males and females may be due to the sexual dimorphism and lipid accumulation. However, how these two factors work and the underlying molecular mechanisms have not been investigated in this study.
In the current study, the enzyme activities of DMEs in one group from adult or offspring mice were measured in vitro (Figure 2, Figure 5G). The enzyme activities of DMEs in male mice were investigated as male mice appeared to have more significantly phenotypic alterations (including body weight and liver appearance) than female mice (Fig. 1). For offspring, day-30 offspring mice were selected as representative over others for two reasons. One reason is that mice at day-30 could provide sufficient liver samples to conduct the experiments of enzyme activities. The other reason is that the alteration of most drug-metabolizing enzymes and nuclear receptors occurred at day 30 in this study. A discrepancy in the expression at levels of mRNAs and enzyme activities was observed (Figure 2, Figure 5). Generally, compared to the related mRNAs expression, relatively decreased enzyme activities were found in the current study. For instance, consumption of an HFD for 8 weeks led to a 13-fold increase of Cyp2b10 expression at mRNA level, whereas only a 1.7-fold induction at the level of enzyme activity in comparison with the related LFD groups (Fig. 2H and L). Compared to the 30-day O-8-LA group, the expression of Cyp1a2 was 2.7-fold higher at mRNA level in the 30-day O-8-HA group, but no statistical difference at the level of enzyme activity (Fig. 5B and G). Actually, inconsistence effects at the levels of mRNA and enzyme activities/proteins occurred in many cases61, 62. Factors involving in multiple levels can influence to the correlation of mRNA-protein/enzyme activities, including post-transcriptional regulation (e.g., microRNAs and long non-coding RNAs), post-translational modification (e.g., protein phosphorylation and sulfation), and RNA modifications (e.g., m6A and m5C)63, 64, 65. In the current study, it is unclear what factors contribute to the discrepancy in the expression of DMEs at mRNA and protein levels. Further studies will be conducted to address this question.
It's well-established that nuclear receptor PPARα plays vital roles in the hepatic metabolism of fatty acids and obesity66, 67. Recently, increasing evidences show that NRs, including PXR, CAR, and HNF4α, are also associated with the development of obesity30, 68, 69. Given that PXR, CAR, HNF4α, and PPARα are all key transcriptional regulators of DMEs, it is reasonable to assume that altered expression of these nuclear receptors is an underlying mechanism contributing to the changed expression of DMEs by an HFD. In adult male mice, significantly increased expression of Car and Pxr was observed in all HFD groups as well as elevated expression of Pxr and Hnf4α in the HFD group for 4 weeks compared to the corresponding LFD groups (Fig. 2). Induced expression of Hnf4α and Pparα was found in the female mice fed with an HFD for 8 weeks, which was accompanied by increased expression of Cyp1a2, 2e1, Ugt1a1, and Sult1a1 (Fig. 2). Similar phenomena were seen in offspring groups. For instance, higher expression levels of nuclear receptors (Car, Pxr, Hnf4α, and Pparα) were demonstrated in the HFD groups at days 30 and/or 60 compared to the age-related LFD groups, while the expressions of DMEs, including Cyp1a1, 1a2, 2e1, Ugt1a1, and Sult1a1, were also induced in these groups (Figure 4, Figure 5). Consistent with our results, Yoshinari and colleagues70 reported increased Car levels as well as Cyp2b10 in db/db mice. Reduced Car and Pxr levels were accompanied by decreased expression of DMEs, e.g., Cyp3a11, 2b10, and Ugt1a1 in a study using male CD1 mice fed with an HFD58. These findings indicate that altered expression of DMEs may due to the changed levels of nuclear receptors by consumption of an HFD. The deeper molecular mechanism on how HFD or obesity influences expression of nuclear receptors and subsequently alters the expression of DMEs needs to be investigated in the future.
The consequences of maternal consumption of an HFD on the body composition as well as the hepatic expression of DMEs in the offspring have been addressed in several previous studies71, 72, 73. In previous studies, a temporary HFD-fed maternal mouse model was used. However, childhood obesity is highly associated with the family-based life style and obese parents32, 74. Thus, the present study also aims to combine these two factors together to assess the impacts of obese levels of parental mice on the expression of drug processing genes in the offspring mice. For the O-8-HA mice (offspring from parental mice fed with an HFD for 8 weeks), induced expression levels of Cyp1a1, 1a2, 2e1, Ugt1a1, and Sult1a1 were only observed at days 30 and/or 60 compared to the corresponding LFD groups (Fig. 5). However, in the livers of 20-day O-4-HA mice (offspring from parental mice fed with an HFD for 4 weeks), decreased expression of Cyp1a1, 1a2, 2e1, Ugt1a1, and Sult1a1 was also found (Fig. 8). Moreover, induced expression of Cyp2b10 at day 20, as well as decreased expression of Cyp2c29 and 3a11 at days 20 and 60, was seen in the livers of O-4-HA mice versus the O-4-LA groups, whereas no changes were found in the O-8-HA and O-18-HA groups compared to the corresponding LFD groups (Fig. 5). These results together suggest parental obese levels affect the expression of drug processing genes in the offspring liver. Due to the severely impaired fertility by an HFD consumption42, 44, limited offspring mice were obtained especially for the O-18-HA group. The sample size in the further study will be enlarged. Strikingly, an HFD consumption for 4 or 8 weeks was observed to increase the expression of most NRs and DMEs in the adult mice (Fig. 2). To explore how obese levels of parental mice and the family-based dietary style influence the expression of NRs and DMEs in the offspring, RNA-sequencing experiments are under conducting.
5. Conclusions
The current study demonstrates that an HFD tends to induce the expression of most DMEs and NRs and obese levels influence the impacts of an HFD on expression of DMEs and NRs in the mouse liver. Consumption of an HFD can alter the ontogenic expression in the liver of offspring. Furthermore, our results indicate that obese levels of parental mice affect the hepatic expression of DMEs and NRs in offspring. These findings provide a new insight into the drug metabolism in overweight and obese populations.
Acknowledgments
This work was supported by the National Institutes of Health (Grant R01GM118367 to Xiao-bo Zhong, USA). Pei Wang was supported by the China Scholarship Council (Grant 201707040007).
Footnotes
Peer review under the responsibility of Chinese Pharmaceutical Association and Institute of Materia Medica, Chinese Academy of Medical Sciences.
Supporting data to this article can be found online at https://doi.org/10.1016/j.apsb.2019.10.009.
Author contributions
Pei Wang, Lirong Zhang, and Xiao-bo Zhong designed the study. Pei Wang, Xueyan Shao, Yifan Bao, Junjie Zhu, and Liming Chen performed the experiments. Pei Wang and Xiao-bo Zhong analyzed the data and wrote the manuscript. Lirong Zhang and Xiaochao Ma revised the manuscript. Xiao-bo Zhong obtained the funding and supervised the whole study. All the authors approved the final version of the manuscript.
Conflicts of interest
The authors have no conflicts of interest to declare.
Appendix A. Supplementary data
The following are the Supplementary data to this article:
References
- 1.World Health Organization. reportObesity: preventing and managing the global epidemic. Report of a WHO consultation (WHO Technical Report Series 894). Available from: https://www.who.int/nutrition/publications/obesity/WHO_TRS_894/en/. [PubMed]
- 2.NCD Risk Factor Collaboration (NCD-RisC) Worldwide trends in body-mass index, underweight, overweight, and obesity from 1975 to 2016: a pooled analysis of 2416 population-based measurement studies in 128.9 million children, adolescents, and adults. Lancet. 2017;390:2627–2642. doi: 10.1016/S0140-6736(17)32129-3. [DOI] [PMC free article] [PubMed] [Google Scholar]
- 3.Liu J.X., Wang Y.T., Lin L.G. Small molecules for fat combustion: targeting obesity. Acta Pharm Sin B. 2019;9:220–236. doi: 10.1016/j.apsb.2018.09.007. [DOI] [PMC free article] [PubMed] [Google Scholar]
- 4.World Health Organization. Fact sheets: obesity and overweight. Available from: https://www.who.int/news-room/fact-sheets/detail/obesity-and-overweight.
- 5.Zhang Y.X., Wang Z.X., Zhao J.S., Chu Z.H. The current prevalence and regional disparities in general and central obesity among children and adolescents in Shandong, China. Int J Cardiol. 2017;227:89–93. doi: 10.1016/j.ijcard.2016.11.135. [DOI] [PubMed] [Google Scholar]
- 6.Stokes A., Collins J.M., Grant B.F., Hsiao C.W., Johnston S.S., Ammann E.M. Prevalence and determinants of engagement with obesity care in the United States. Obesity. 2018;26:814–818. doi: 10.1002/oby.22173. [DOI] [PMC free article] [PubMed] [Google Scholar]
- 7.Ahirwar R., Mondal P.R. Prevalence of obesity in India: a systematic review. Diabetes Metab Syndr. 2019;13:318–321. doi: 10.1016/j.dsx.2018.08.032. [DOI] [PubMed] [Google Scholar]
- 8.GBD 2015 Obesity Collaborators Health effects of overweight and obesity in 195 countries over 25 years. N Engl J Med. 2017;377:13–27. doi: 10.1056/NEJMoa1614362. [DOI] [PMC free article] [PubMed] [Google Scholar]
- 9.Hurt R.T., Kulisek C., Buchanan L.A., McClave S.A. The obesity epidemic: challenges, health initiatives, and implications for gastroenterologists. Gastroenterol Hepatol. 2010;6:780–792. [PMC free article] [PubMed] [Google Scholar]
- 10.Bellentani S., Scaglioni F., Marino M., Bedogni G. Epidemiology of non-alcoholic fatty liver disease. Dig Dis. 2010;28:155–161. doi: 10.1159/000282080. [DOI] [PubMed] [Google Scholar]
- 11.Temple J.L., Cordero P., Li J.W., Nguyen V., Oben J.A. A guide to non-alcoholic fatty liver disease in childhood and adolescence. Int J Mol Sci. 2016;17:E947. doi: 10.3390/ijms17060947. [DOI] [PMC free article] [PubMed] [Google Scholar]
- 12.Fromenty B. Drug-induced liver injury in obesity. J Hepatol. 2013;58:824–826. doi: 10.1016/j.jhep.2012.12.018. [DOI] [PubMed] [Google Scholar]
- 13.Ghoneim R.H., Ngo Sock E.T., Lavoie J.M., Piquette-Miller M. Effect of a high-fat diet on the hepatic expression of nuclear receptors and their target genes: relevance to drug disposition. Br J Nutr. 2015;113:507–516. doi: 10.1017/S0007114514003717. [DOI] [PubMed] [Google Scholar]
- 14.Natale S., Bradley J., Nguyen W.H., Tran T., Ny P., La K. Pediatric obesity: pharmacokinetic alterations and effects on antimicrobial dosing. Pharmacotherapy. 2017;37:361–378. doi: 10.1002/phar.1899. [DOI] [PubMed] [Google Scholar]
- 15.Chomchai S., Chomchai C. Being overweight or obese as a risk factor for acute liver injury secondary to acute acetaminophen overdose. Pharmacoepidemiol Drug Saf. 2018;27:19–24. doi: 10.1002/pds.4339. [DOI] [PubMed] [Google Scholar]
- 16.Gade C., Dalhoff K., Petersen T.S., Riis T., Schmeltz C., Chabanova E. Higher chlorzoxazone clearance in obese children compared with nonobese peers. Br J Clin Pharmacol. 2018;84:1738–1747. doi: 10.1111/bcp.13602. [DOI] [PMC free article] [PubMed] [Google Scholar]
- 17.Sun P., Zhu J.J., Wang T., Huang Q., Zhou Y.R., Yu B.W. Benzbromarone aggravates hepatic steatosis in obese individuals. Biochim Biophys Acta Mol Basis Dis. 2018;1864:2067–2077. doi: 10.1016/j.bbadis.2018.03.009. [DOI] [PubMed] [Google Scholar]
- 18.Emond C., DeVito M.J., Diliberto J.J., Birnbaum L.S. The influence of obesity on the pharmacokinetics of dioxin in mice: an assessment using classical and PBPK modeling. Toxicol Sci. 2018;164:218–228. doi: 10.1093/toxsci/kfy078. [DOI] [PMC free article] [PubMed] [Google Scholar]
- 19.Brill M.J.E., Diepstraten J., van Rongen A., van Kralingen S., van den Anker J.N., Knibbe C.A.J. Impact of obesity on drug metabolism and elimination in adults and children. Clin Pharmacokinet. 2012;51:277–304. doi: 10.2165/11599410-000000000-00000. [DOI] [PubMed] [Google Scholar]
- 20.Brill M.J.E., van Rongen A., Houwink A.P.I., Burggraaf J., van Ramshorst B., Wiezer R.J. Midazolam pharmacokinetics in morbidly obese patients following semi-simultaneous oral and intravenous administration: a comparison with healthy volunteers. Clin Pharmacokinet. 2014;53:931–941. doi: 10.1007/s40262-014-0166-x. [DOI] [PMC free article] [PubMed] [Google Scholar]
- 21.Ulvestad M., Skottheim I.B., Jakobsen G.S., Bremer S., Molden E., Asberg A. Impact of OATP1B1, MDR1, and CYP3A4 expression in liver and intestine on interpatient pharmacokinetic variability of atorvastatin in obese subjects. Clin Pharmacol Ther. 2013;93:275–282. doi: 10.1038/clpt.2012.261. [DOI] [PubMed] [Google Scholar]
- 22.van Rongen A., Välitalo P.A.J., Peeters M.Y.M., Boerma D., Huisman F.W., van Ramshorst B. Morbidly obese patients exhibit increased CYP2E1-mediated oxidation of acetaminophen. Clin Pharmacokinet. 2016;55:833–847. doi: 10.1007/s40262-015-0357-0. [DOI] [PMC free article] [PubMed] [Google Scholar]
- 23.Mittwede P.N., Clemmer J.S., Bergin P.F., Xiang L. Obesity and critical illness: insights from animal models. Shock. 2016;45:349–358. doi: 10.1097/SHK.0000000000000512. [DOI] [PMC free article] [PubMed] [Google Scholar]
- 24.Kleinert M., Clemmensen C., Hofmann S.M., Moore M.C., Renner S., Woods S.C. Animal models of obesity and diabetes mellitus. Nat Rev Endocrinol. 2018;14:140–162. doi: 10.1038/nrendo.2017.161. [DOI] [PubMed] [Google Scholar]
- 25.Kanasaki K., Koya D. Biology of obesity: lessons from animal models of obesity. J Biomed Biotechnol. 2011;2011:197636. doi: 10.1155/2011/197636. [DOI] [PMC free article] [PubMed] [Google Scholar]
- 26.Lutz T.A., Woods S.C. Overview of animal models of obesity. Curr Protoc Pharmacol. 2012;58:5.61.1–5.61.18. doi: 10.1002/0471141755.ph0561s58. [DOI] [PMC free article] [PubMed] [Google Scholar]
- 27.Chu D.T., Malinowska E., Jura M., Kozak L.P. C57BL/6J mice as a polygenic developmental model of diet-induced obesity. Physiol Rep. 2017;5:e13093. doi: 10.14814/phy2.13093. [DOI] [PMC free article] [PubMed] [Google Scholar]
- 28.Ning M., Jeong H. High-fat diet feeding alters expression of hepatic drug-metabolizing enzymes in mice. Drug Metab Dispos. 2017;45:707–711. doi: 10.1124/dmd.117.075655. [DOI] [PMC free article] [PubMed] [Google Scholar]
- 29.Tomankova V., Anzenbacher P., Anzenbacherova E. Effects of obesity on liver cytochromes P450 in various animal models. Biomed Pap Med Fac Univ Palacky Olomouc Czech Repub. 2017;161:144–151. doi: 10.5507/bp.2017.026. [DOI] [PubMed] [Google Scholar]
- 30.Zhang L., Xu P.P., Cheng Y., Wang P.L., Ma X.R., Liu M.Y. Diet-induced obese alters the expression and function of hepatic drug-metabolizing enzymes and transporters in rats. Biochem Pharmacol. 2019;164:368–376. doi: 10.1016/j.bcp.2019.05.002. [DOI] [PubMed] [Google Scholar]
- 31.Morgan K., Uyuni A., Nandgiri G., Mao L., Castaneda L., Kathirvel E. Altered expression of transcription factors and genes regulating lipogenesis in liver and adipose tissue of mice with high fat diet-induced obesity and nonalcoholic fatty liver disease. Eur J Gastroenterol Hepatol. 2008;20:843–854. doi: 10.1097/MEG.0b013e3282f9b203. [DOI] [PubMed] [Google Scholar]
- 32.Sahoo K., Sahoo B., Choudhury A.K., Sofi N.Y., Kumar R., Bhadoria A.S. Childhood obesity: causes and consequences. J Fam Med Prim Care. 2015;4:187–192. doi: 10.4103/2249-4863.154628. [DOI] [PMC free article] [PubMed] [Google Scholar]
- 33.Kumar S., Kelly A.S. Review of childhood obesity: from epidemiology, etiology, and comorbidities to clinical assessment and treatment. Mayo Clin Proc. 2017;92:251–265. doi: 10.1016/j.mayocp.2016.09.017. [DOI] [PubMed] [Google Scholar]
- 34.Piekos S.C., Chen L.M., Wang P.C., Shi J., Yaqoob S., Zhu H.J. Consequences of phenytoin exposure on hepatic cytochrome P450 expression during postnatal liver maturation in mice. Drug Metab Dispos. 2018;46:1241–1250. doi: 10.1124/dmd.118.080861. [DOI] [PMC free article] [PubMed] [Google Scholar]
- 35.Schlezinger J.J., Struntz W.D.J., Goldstone J.V., Stegeman J.J. Uncoupling of cytochrome P450 1A and stimulation of reactive oxygen species production by co-planar polychlorinated biphenyl congeners. Aquat Toxicol. 2006;77:422–432. doi: 10.1016/j.aquatox.2006.01.012. [DOI] [PubMed] [Google Scholar]
- 36.Gao N., Zou D., Qiao H.L. Concentration-dependent inhibitory effect of Baicalin on the plasma protein binding and metabolism of chlorzoxazone, a CYP2E1 probe substrate, in rats in vitro and in vivo. PLoS One. 2013;8:e53038. doi: 10.1371/journal.pone.0053038. [DOI] [PMC free article] [PubMed] [Google Scholar]
- 37.Ward B.A., Gorski J.C., Jones D.R., Hall S.D., Flockhart D.A., Desta Z. The cytochrome P450 2B6 (CYP2B6) is the main catalyst of efavirenz primary and secondary metabolism: implication for HIV/AIDS therapy and utility of efavirenz as a substrate marker of CYP2B6 catalytic activity. J Pharmacol Exp Ther. 2003;306:287–300. doi: 10.1124/jpet.103.049601. [DOI] [PubMed] [Google Scholar]
- 38.Lam J.L., Jiang Y., Zhang T., Zhang E.Y., Smith B.J. Expression and functional analysis of hepatic cytochromes P450, nuclear receptors, and membrane transporters in 10- and 25-week-old db/db mice. Drug Metab Dispos. 2010;38:2252–2258. doi: 10.1124/dmd.110.034223. [DOI] [PubMed] [Google Scholar]
- 39.Peng L., Yoo B., Gunewardena S.S., Lu H., Klaassen C.D., Zhong X.B. RNA sequencing reveals dynamic changes of mRNA abundance of cytochromes P450 and their alternative transcripts during mouse liver development. Drug Metab Dispos. 2012;40:1198–1209. doi: 10.1124/dmd.112.045088. [DOI] [PMC free article] [PubMed] [Google Scholar]
- 40.Lu H., Gunewardena S., Cui J.Y., Yoo B., Zhong X.B., Klaassen C.D. RNA-sequencing quantification of hepatic ontogeny and tissue distribution of mRNAs of phase II enzymes in mice. Drug Metab Dispos. 2013;41:844–857. doi: 10.1124/dmd.112.050211. [DOI] [PMC free article] [PubMed] [Google Scholar]
- 41.Fan W.M., Xu Y.L., Liu Y., Zhang Z.Q., Lu L.M., Ding Z.D. Obesity or overweight, a chronic inflammatory status in male reproductive system, leads to mice and human subfertility. Front Physiol. 2017;8:1117. doi: 10.3389/fphys.2017.01117. [DOI] [PMC free article] [PubMed] [Google Scholar]
- 42.Fan Y., Liu Y., Xue K., Gu G.B., Fan W.M., Xu Y.L. Diet-induced obesity in male C57BL/6 mice decreases fertility as a consequence of disrupted blood-testis barrier. PLoS One. 2015;10:e0120775. doi: 10.1371/journal.pone.0120775. [DOI] [PMC free article] [PubMed] [Google Scholar]
- 43.Pantasri T., Norman R.J. The effects of being overweight and obese on female reproduction: a review. Gynecol Endocrinol. 2014;30:90–94. doi: 10.3109/09513590.2013.850660. [DOI] [PubMed] [Google Scholar]
- 44.Hohos N.M., Skaznik-Wikiel M.E. High-fat diet and female fertility. Endocrinology. 2017;158:2407–2419. doi: 10.1210/en.2017-00371. [DOI] [PMC free article] [PubMed] [Google Scholar]
- 45.Hariri N., Thibault L. High-fat diet-induced obesity in animal models. Nutr Res Rev. 2010;23:270–299. doi: 10.1017/S0954422410000168. [DOI] [PubMed] [Google Scholar]
- 46.Eshima H., Tamura Y., Kakehi S., Kurebayashi N., Murayama T., Nakamura K. Long-term, but not short-term high-fat diet induces fiber composition changes and impaired contractile force in mouse fast-twitch skeletal muscle. Physiol Rep. 2017;5:e13250. doi: 10.14814/phy2.13250. [DOI] [PMC free article] [PubMed] [Google Scholar]
- 47.Le J.M., Zhang X.Y., Jia W.P., Zhang Y., Luo J.T., Sun Y.N. Regulation of microbiota–GLP1 axis by sennoside A in diet-induced obese mice. Acta Pharm Sin B. 2019;9:758–768. doi: 10.1016/j.apsb.2019.01.014. [DOI] [PMC free article] [PubMed] [Google Scholar]
- 48.Shang Y., Khafipour E., Derakhshani H., Sarna L.K., Woo C.W., Siow Y.L. Short term high fat diet induces obesity-enhancing changes in mouse gut microbiota that are partially reversed by cessation of the high fat diet. Lipids. 2017;52:499–511. doi: 10.1007/s11745-017-4253-2. [DOI] [PubMed] [Google Scholar]
- 49.Kim K.A., Gu W., Lee I.A., Joh E.H., Kim D.H. High fat diet-induced gut microbiota exacerbates inflammation and obesity in mice via the TLR4 signaling pathway. PLoS One. 2012;7:e47713. doi: 10.1371/journal.pone.0047713. [DOI] [PMC free article] [PubMed] [Google Scholar]
- 50.Kawasaki N., Asada R., Saito A., Kanemoto S., Imaizumi K. Obesity-induced endoplasmic reticulum stress causes chronic inflammation in adipose tissue. Sci Rep. 2012;2:799. doi: 10.1038/srep00799. [DOI] [PMC free article] [PubMed] [Google Scholar]
- 51.Williams L.M., Campbell F.M., Drew J.E., Koch C., Hoggard N., Rees W.D. The development of diet-induced obesity and glucose intolerance in C57BL/6 mice on a high-fat diet consists of distinct phases. PLoS One. 2014;9:e106159. doi: 10.1371/journal.pone.0106159. [DOI] [PMC free article] [PubMed] [Google Scholar]
- 52.Long R.T., Zeng W.S., Chen L.Y., Guo J., Lin Y.Z., Huang Q.S. Bifidobacterium as an oral delivery carrier of oxyntomodulin for obesity therapy: inhibitory effects on food intake and body weight in overweight mice. Int J Obes. 2010;34:712–719. doi: 10.1038/ijo.2009.277. [DOI] [PubMed] [Google Scholar]
- 53.Jia J.B., Li F.F., Zhou H.Y., Bai Y.H., Liu S.J., Jiang Y.G. Oral exposure to silver nanoparticles or silver ions may aggravate fatty liver disease in overweight mice. Environ Sci Technol. 2017;51:9334–9343. doi: 10.1021/acs.est.7b02752. [DOI] [PubMed] [Google Scholar]
- 54.Hussain M.A., Abogresha N.M., Hassan R., Tamany D.A., Lotfy M. Effect of feeding a high-fat diet independently of caloric intake on reproductive function in diet-induced obese female rats. Arch Med Sci. 2016;12:906–914. doi: 10.5114/aoms.2016.59790. [DOI] [PMC free article] [PubMed] [Google Scholar]
- 55.Peyot M.L., Pepin E., Lamontagne J., Latour M.G., Zarrouki B., Lussier R. Beta-cell failure in diet-induced obese mice stratified according to body weight gain: secretory dysfunction and altered islet lipid metabolism without steatosis or reduced beta-cell mass. Diabetes. 2010;59:2178–2187. doi: 10.2337/db09-1452. [DOI] [PMC free article] [PubMed] [Google Scholar]
- 56.Lee H.J., Jo S.B., Romer A.I., Lim H.J., Kim M.J., Koo S.H. Overweight in mice and enhanced adipogenesis in vitro are associated with lack of the hedgehog coreceptor boc. Diabetes. 2015;64:2092–2103. doi: 10.2337/db14-1017. [DOI] [PMC free article] [PubMed] [Google Scholar]
- 57.Tomankova V., Liskova B., Skalova L., Bartikova H., Bousova I., Jourova L. Altered cytochrome P450 activities and expression levels in the liver and intestines of the monosodium glutamate-induced mouse model of human obesity. Life Sci. 2015;133:15–20. doi: 10.1016/j.lfs.2015.04.014. [DOI] [PubMed] [Google Scholar]
- 58.Ghose R., Omoluabi O., Gandhi A., Shah P., Strohacker K., Carpenter K.C. Role of high-fat diet in regulation of gene expression of drug metabolizing enzymes and transporters. Life Sci. 2011;89:57–64. doi: 10.1016/j.lfs.2011.05.005. [DOI] [PMC free article] [PubMed] [Google Scholar]
- 59.Yoshinari K., Takagi S., Yoshimasa T., Sugatani J., Miwa M. Hepatic CYP3A expression is attenuated in obese mice fed a high-fat diet. Pharm Res. 2006;23:1188–1200. doi: 10.1007/s11095-006-0071-6. [DOI] [PubMed] [Google Scholar]
- 60.Yang L., Li Y., Hong H.X., Chang C.W., Guo L.W., Lyn-Cook B. Sex differences in the expression of drug-metabolizing and transporter genes in human liver. J Drug Metab Toxicol. 2012;3:1000119. doi: 10.4172/2157-7609.1000119. [DOI] [PMC free article] [PubMed] [Google Scholar]
- 61.Perl K., Ushakov K., Pozniak Y., Yizhar-Barnea O., Bhonker Y., Shivatzki S. Reduced changes in protein compared to mRNA levels across non-proliferating tissues. BMC Genom. 2017;18:305. doi: 10.1186/s12864-017-3683-9. [DOI] [PMC free article] [PubMed] [Google Scholar]
- 62.Maier T., Güell M., Serrano L. Correlation of mRNA and protein in complex biological samples. FEBS Lett. 2009;583:3966–3973. doi: 10.1016/j.febslet.2009.10.036. [DOI] [PubMed] [Google Scholar]
- 63.Xu K., Sun Y., Sheng B., Zheng Y., Wu X., Xu K. Role of identified RNA N6-methyladenosine methylation in liver. Anal Biochem. 2019;578:45–50. doi: 10.1016/j.ab.2019.05.005. [DOI] [PubMed] [Google Scholar]
- 64.Wang P., Nie Y.L., Wang S.J., Yang L.L., Yang W.H., Li J.F. Regulation of UGT1A expression by miR-298 in human livers from the Han Chinese population and in human cell lines. Epigenomics. 2018;10:43–57. doi: 10.2217/epi-2017-0068. [DOI] [PubMed] [Google Scholar]
- 65.Smutny T., Mani S., Pavek P. Post-translational and post-transcriptional modifications of pregnane X receptor (PXR) in regulation of the cytochrome P450 superfamily. Curr Drug Metab. 2013;14:1059–1069. doi: 10.2174/1389200214666131211153307. [DOI] [PMC free article] [PubMed] [Google Scholar]
- 66.Rigano D., Sirignano C., Taglialatela-Scafati O. The potential of natural products for targeting PPARα. Acta Pharm Sin B. 2017;7:427–438. doi: 10.1016/j.apsb.2017.05.005. [DOI] [PMC free article] [PubMed] [Google Scholar]
- 67.Tanaka N., Aoyama T., Kimura S., Gonzalez F.J. Targeting nuclear receptors for the treatment of fatty liver disease. Pharmacol Ther. 2017;179:142–157. doi: 10.1016/j.pharmthera.2017.05.011. [DOI] [PMC free article] [PubMed] [Google Scholar]
- 68.Li X.L., Wang Z.M., Klaunig J.E. Modulation of xenobiotic nuclear receptors in high-fat diet induced non-alcoholic fatty liver disease. Toxicology. 2018;410:199–213. doi: 10.1016/j.tox.2018.08.007. [DOI] [PubMed] [Google Scholar]
- 69.Larsen M.C., Bushkofsky J.R., Gorman T., Adhami V., Mukhtar H., Wang S.Q. Cytochrome P450 1B1: an unexpected modulator of liver fatty acid homeostasis. Arch Biochem Biophys. 2015;571:21–39. doi: 10.1016/j.abb.2015.02.010. [DOI] [PMC free article] [PubMed] [Google Scholar]
- 70.Yoshinari K., Takagi S., Sugatani J., Miwa M. Changes in the expression of cytochromes P450 and nuclear receptors in the liver of genetically diabetic db/db mice. Biol Pharm Bull. 2006;29:1634–1638. doi: 10.1248/bpb.29.1634. [DOI] [PubMed] [Google Scholar]
- 71.Tajima M., Ikarashi N., Okaniwa T., Imahori Y., Saruta K., Toda T. Consumption of a high-fat diet during pregnancy changes the expression of cytochrome P450 in the livers of infant male mice. Biol Pharm Bull. 2013;36:649–657. doi: 10.1248/bpb.b12-01017. [DOI] [PubMed] [Google Scholar]
- 72.Platt K.M., Charnigo R.J., Pearson K.J. Adult offspring of high-fat diet-fed dams can have normal glucose tolerance and body composition. J Dev Orig Health Dis. 2014;5:229–239. doi: 10.1017/S2040174414000154. [DOI] [PMC free article] [PubMed] [Google Scholar]
- 73.DuBois B.N., O'Tierney-Ginn P., Pearson J., Friedman J.E., Thornburg K., Cherala G. Maternal obesity alters feto-placental cytochrome P4501A1 activity. Placenta. 2012;33:1045–1051. doi: 10.1016/j.placenta.2012.09.008. [DOI] [PMC free article] [PubMed] [Google Scholar]
- 74.Fuemmeler B.F., Lovelady C.A., Zucker N.L., Østbye T. Parental obesity moderates the relationship between childhood appetitive traits and weight. Obesity. 2013;21:815–823. doi: 10.1002/oby.20144. [DOI] [PMC free article] [PubMed] [Google Scholar]
Associated Data
This section collects any data citations, data availability statements, or supplementary materials included in this article.