

Abstract.
Noninvasive and real-time visualization of the thoracoepigastric veins (TVs) of living mice was demonstrated by using two-photon excitation (TPE) optical imaging with a Eu-luminescent polymeric nanoagent as the angiographic contrast. The spatiotemporal evolution of the polymeric nanoagent in TVs was monitored for up to 2 h by TPE time-resolved (TPE-TR) bioimaging, which is free from the interference of tissue autofluorescence. A wide field-of-view covering the thoracoabdominal region allowed the visualization of the entire TV network with an imaging depth of 1 to 2 mm and a lateral resolution of 80 μm at submillimeter. Detailed analysis of the uptake, transport, and clearance processes of the polymeric nanoagent revealed a clearance time constant of and an apparent clearance efficiency of 80% to 90% for the nanoagent in both axial and lateral TVs. TPE-TR imaging of the dissected internal organs proved that the liver is mainly responsible for the sequestration of the nanoagent, which is consistent with the apparent retention efficiency of liver, , as determined by the real-time in vivo TV imaging. We demonstrate the potency of TPE-TR modality in the pharmacokinetics imaging of the peripheral vascular systems of animal models, which can be beneficial for related nanotheranostics study.
Keywords: bioimaging, Eu-luminescence, nanocarriers, thoracoepigastric veins, two-photon excitation
1. Introduction
The employment of nanoagents as platforms for drug delivery and contrast enhancement of bioimaging is an expanding area of nanotheranostics.1–8 Accordingly, it is indispensable to understand the pharmacokinetics of nanoagents, including the processes of uptake, transport, clearance, and metabolism.9–12 Since the vascular systems, including arterial, lymphatic, and venous vessels, are mainly responsible for the conduction and delivery of the nanoagents, acquiring the spatiotemporal details of nanoagents in the vasculatures has attracted intensive interest.13–15 However, to visualize the intravital vasculatures, it is crucial to overcome the problem of inherently low imaging contrast, so research efforts are directed toward optimizing the nanoagents and/or developing more effective bioimaging methods. Recently, noninvasive and real-time pharmacokinetics imaging of nanoagents in peripheral vasculatures such as thoracoepigastric veins (TVs)16–20 and peripheral arteries21–23 has received considerable attention. Such efforts facilitate the advancement of nanotheranostics related to peripheral vasculatures, e.g., drug delivery via lymphatic vessels24,25 and therapeutic treatment of portal hypertension induced by liver cirrhosis26 and peripheral arterial diseases (PADs),21 and so forth.
Current techniques employed for noninvasive imaging of in vivo vasculatures include x-ray computed tomography,27–30 magnetic resonance imaging,31,32 positron emission tomography,33,34 optical coherence tomography (OCT),35,36 and photoacoustic tomography,37–41 which are either clinically employed or of great preclinical potential. See Refs. 21, 42, and 43 for a comprehensive review. These bioimaging modalities, however, are limited in capturing enough dynamic details of blood vasculatures, owing to insufficient spatiotemporal resolutions.44–47 For instance, the recently developed microultrasonography offers a temporal resolution up to a millisecond; however, the spatial resolution deteriorates considerably with increasing imaging depth.48 The near-infrared OCT, featuring label-free, subcellular spatial resolution, millimeter penetration depth, and wide field-of-view (FOV), has been clinically adopted in ophthalmology, cardiology, and gastrointestinal cancer screening.49 In the case of OCT angiography, which is a promising OCT mode for intravital imaging of TVs, ear microvasculatures and tumor angiogenesis models of mice,49–52 the mice need to be immobilized, and the timescale for imaging a field of is on the order of a few minutes.49,50 As the majority of the conventional bioimaging methods rely on contrast agents, the emerging nanotheranostics utilizing the integrated functionalities of nanoagents offers a unique opportunity to optimize the aforementioned diagnostic modalities.
Regarding noninvasive visualization of the TVs of small model animals, fluorescence bioimaging has been shown to be advantageous in its high spatiotemporal resolutions.53,54 Particularly, the recent advances in synthetic nanophosphors capable of luminescence emission in the second near-infrared region (NIR-II, 1000 to 1400 nm), such as single-wall carbon nanotubes,55 inorganic quantum dots,56 and rare earth doped upconversion nanoparticles,57,58 provide new opportunities for real-time bioimaging with a spatial resolution of sub- and an imaging depth of millimeters. The NIR-II optical bioimaging, besides an impressive penetration depth, can minimize the interference from the autofluorescence of biological tissues, owing to the relatively low light absorption in this spectral window. In parallel to NIR-II bioimaging, two-photon excitation (TPE) fluorescence bioimaging can further improve the spatial resolution, owing to the spatially more confined optical excitation compared to the conventional one-photon excitation scheme.59–62
TPE bioimaging has been benefiting from the development of high-performance TPE chromophores as exogenous labels. In this relation, we have devised a number of highly efficient europium (Eu)-luminescent complexes exhibiting large two-photon absorption (TPA) cross sections at near-infrared photosensitization wavelengths63–67 and have succeeded in incorporating such complexes into specific polymeric nanocarriers for in vivo pharmacokinetics imaging.68 Based on these advances, we have recently built a TPE and time-resolved (TPE-TR) bioimaging apparatus to analyze the spatiotemporal evolution of the nanocarriers in small animals. Our TPE-TR imaging modality can effectively reject the interference of biological autofluorescence, i.e., the fluorescence originating from endogenous biological fluorophores, and is free from the effects of laser heating. In addition, it is characterized by an FOV of , a penetration depth of (in intralipid phantom) and a frame time of a few seconds.69
In this work, we have employed a Eu-luminescence-labeled polymeric nanocarrier as the angiographic contrast for TPE-TR imaging of the TV networks of intact and healthy mice. The polymeric nanoagent bears high two-photon sensitization efficiency, high photostability, and low biotoxicity. The TPE-TR apparatus has an FOV that can accommodate the thoracoabdominal region extending from axillary to subiliac domains, enabling an entire TV network to be visualized. The transport and clearance processes of the polymeric nanoagent in TV blood streams were monitored in a noninvasive and real-time manner for up to 2 h, which allowed the determination of the timescale, the clearance efficiency, and the major destination of the nanoagent. The spatiotemporal evolution of the nanoagent in TV networks revealed a clearance time constant of and an apparent clearance efficiency of 80% to 90% in both axial and lateral veins. In addition, liver is found to be the major organ for the sequestration of the polymeric nanoagent, and the apparent retention efficiency and the clearance time constant of the nanoagent in liver were found to be 32% and , respectively. Our TPE-TR bioimaging strategy for exploiting the pharmacokinetics of nanoagents in intravital microvasculatures may be applicable to the diagnosis of the peripheral vasculature-related diseases, as well as to the development of target-specific nanotherapy.
2. Materials and Methods
2.1. Synthesis and Characterization of the Eu-Luminescence-Labeled Nanoagent
The Eu-luminescent complex, , was synthesized as previously reported.67,70 Briefly, the benzene solutions of (51.9 mg, 0.05 mM) and dpbt (20.8 mg, 0.05 mM) were mixed under argon atmosphere and stirred for 3 h. The mixture was then evaporated to remove the solvents and further dried in vacuum to obtain the complexes. Poly(methyl methacrylate-co-methacrylic acid) (PMMA-MAA) was used as the matrix material for the fabrication of the Eu-luminescence-labeled polymeric nanoparticles. See Fig. 1 for the chemical structures of the Eu-complex and the polymer. The -doped polymeric nanoparticles in a colloidal solution were prepared by rapid mixing water with a solution of the Eu-complex and the polymer in acetone under reduced pressure in a microchannel mixer, which was followed by removing acetone via evaporation.68 Hereafter, the -doped PMMA-MAA nanoparticle will be referred to as Eu@PMMA-MAA [see the inset of Fig. 2(a) for the nanoparticle configuration].
Fig. 1.

Chemical structures of [fod: 6,6,7,7,8,8,8-heptafluoro-2,2-dimethyl-3,5-octanedione; dpbt: 2-(-diethylanilino-4-yl)-4,6-bis(3,5-dimethylprrazol-1-yl)-1,3,5 triazine] and PMMA-MAA [poly(methyl methacrylate-co-methacrylic acid)]. Product number of PMMA-MAA was 376914 (Sigma-Aldrich LLC.).
Fig. 2.

DLS and spectroscopic characterization of the Eu@PMMA-MAA nanoagent. (a) The size distribution and average hydrodynamic diameter () measured by DLS. Inset shows the schematic configuration of the nanoagent. (b) UV–Vis absorption (black) and luminescence (red) spectra of a colloidal solution of Eu@PMMA-MAA. Luminescence excitation wavelength was 400 nm.
The average hydrodynamic diameter of the Eu@PMMA-MAA colloidal nanoparticles () was 26.9 nm as determined by dynamics light scattering [DLS; Fig. 2(a)] at 25°C (Zeta potential and particle size analyzer; Zeta plus, Brookhaven Instruments). Figure 2(b) shows the UV–Vis absorption and the luminescence spectra of the colloidal solution of Eu@PMMA-MAA recorded, respectively, on a UV–Vis absorption spectrometer (UV3600PLUS; Shimadzu, Japan) and a fluorescence spectrophotometer (FLS-980; Edinburgh Instruments Ltd., United Kingdom). The action cross section of complexes, defined as the product of the TPA cross section () and the Eu-luminescence quantum efficiency at 613 nm (), , serves as a metric of the two-photon sensitization efficiency. With the colloidal solution of Eu@PMMA-MAA nanoparticles as the sample and a methanol solution of rhodamine B as the reference (, ),71 we determined the of the PMMA-MAA embedded complexes following the procedures described in Ref. 64. The cell viability test of the Eu@PMMA-MAA nanoagent was performed following the procedures described in Ref. 68. The data analysis was conducted by Student’s -test. The sampling number of each data point was six, and the difference with was considered to be statistically significant.
2.2. TPE-TR Bioimaging Apparatus
The instrumentation details of TPE-TR imaging have been reported elsewhere.69 Herein, we provide a brief description (Fig. 3). As shown in Fig. 3(a), the TPE-induced autofluorescence of endogenous fluorophores could be rejected by detecting the Eu-luminescence after the decay of autofluorescence. This was realized by setting an appropriate delay time for autofluorescence rejection (), which was longer than the autofluorescence duration () but much shorter than the lifetime of Eu-luminescence (0.84 ms). As shown in Fig. 3(b), the laser beam was shaped with aperture A in a way so that the beam after focusing by CL formed a focal line with homogeneous power distribution.69 The focal line was scanned over a horizontal plane by regulating the X-scanning unit, while the imaging optics and the intensified charge coupled device (ICCD) for image sensing remained static. The Z-height of imaging plane was adjustable by vertically moving the animal stage.
Fig. 3.
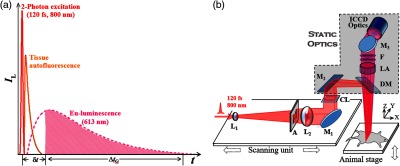
(a) Principle of autofluorescence rejection. is a time delay comparable to the duration of tissue autofluorescence, which is set prior to the activation of an ICCD for image sensing. is the gate width of the ICCD detector, which is long enough to accommodate the persistence of Eu-luminescence. See text for details. (b) Optical layout of TPE-TR bioimaging. The femtosecond laser source is an oscillator-regenerative amplifier system (solstice; Spectra-Physics). The X-scanning unit consists of a one-dimensional translational stage (ILS-100LM; Newport) mounted with a concave lens (, ) for beam expanding, an aperture (A) for beam shaping, a convex lens (, ) for beam collimating, a mirror (M1) for beam steering, and a cylindrical lens (CL, ) for line focusing. Rectangular M2 directs laser to dichroic mirror, DM, which projects the focused beam as a line onto the objective plane. Eu-luminescence is collected by a lens assembly (LA, , 1:5). After passing through optical filters (F: FF01-715/SP and FF02-615/20; Semrock), the Eu-luminescence is directed by mirror M3 to the input optics (, 1:2.5; Nikkor, Japan) of the ICCD detector (iStar DH334T; Andor). See Ref. 69 for more details.
With delicate timing management among pulsed excitation, mechanical X-scanning, and image sensing, the push-broom type, line-by-line imaging mode was established [cf. Fig. 4(a)]. The average illuminating power of femtosecond laser with a repetition rate of 500 Hz was set at 350 mW. The time delay for autofluorescence rejection was , and the gate width for acquiring a line image was . The frame time was adjustable between 1 to 4 s depending on the repetition rate of pulsed excitation, and it was 4 s in this work. The TPE-TR apparatus has a lateral resolution of in air, and an axial resolution of in air or 4.6 to 6.6 mm in an intralipid phantom depending on the imaging depth.69
Fig. 4.

(a) Illustration of the postural status of a mouse subjected to TPE-TR bioimaging: The focal plane (upper panel) and the FOV (lower panel). (b) Bright-field image and (c) its corresponding TPE-TR image recorded for a mouse model 5 min after caudal vein injection of colloidal Eu@PMMA-MAA nanoagent. (d) Cross-sectional photograph showing the liver tissues of a mouse dissected apart from the xiphoid to the thoracoabdominal side. The scale in red represents 1 mm per major division.
2.3. Mice Model and Pharmacokinetics Imaging
Immune-deficient balb/c nude mice (6 to 8 weeks, 20 to 30 g Charles River Laboratories, China) were used in this work, and they were treated in compliance with the Guide for the Care and Use of Laboratory Animal Resources (1996, National Research Council). Before experiment, a healthy mouse was kept in a box attached with a minitype anesthetic ventilator (Matrx VIP3000). After being anaesthetized with isoflurane vapor, the mouse was mounted on the animal stage equipped with a ventilation mask supplying anaesthetic vapor and oxygen and with an exhaust port connected to a cryogenic trap.69 The mouse was injected via caudal vein with colloidal solutions of Eu@PMMA-MAA nanoagent ( and ), and the real-time images were recorded every 5 min.
2.4. FOV Orientation and Time Origin of TPE-TR Imaging
A mouse was mounted on the stage at a desired Z-height [cf. Fig. 3(b)] with the help of an auxiliary optoelectrical positioning system, which was based on a laser triangulation scheme for distance sensing.72 The xiphoid of the mouse was taken as the referencing point, which was illuminated with a beam of weak continuous-wave laser and viewed with an auxiliary CCD camera. This auxiliary positioning system combined with the regulation of animal stage ensured the precise location of the TPE-TR imaging plane. To examine the superficial TVs, the imaging plane was placed 3 mm beneath the xiphoid [Fig. 4(a)]. As shown by the bright-field image recorded prior to the TPE-TR imaging, a single FOV could cover the thoracoabdominal area [Fig. 4(b)]. Accordingly, the TV network could be visualized clearly with the TPE-TR imaging [Fig. 4(c)]. To facilitate the subsequent kinetics analysis, we define the timing of caudal vein injection (duration, ) as a pseudotime origin.
3. Results and Discussion
3.1. Two-Photon Sensitization Efficiency, Photostability, and Cell Toxicity of the Nanoagent
Figure 5(a) plots the action cross section () of complexes doped in the nanoagent against the near-infrared TPE wavelengths. The is 34.9 GM at 800 nm, which is close to the maximal value of 42.5 at 840 nm. Since a Eu@PMMA-MAA nanoparticle accommodated about 400 molecules, the overall action cross section of the nanoagent was estimated to be at 800 nm. Figure 5(b) shows the time evolution profile of the Eu-luminescence from the Eu@PMMA-MAA nanoparticles sequestered in the liver tissues taken from a mouse, which before sacrifice was administered with the colloidal nanoagent via tail-vein injection. The luminescence intensity dropped by over the time course of 2 h, indicating an excellent photostability of the nanoagent, which is indispensable for the kinetics analysis based on luminescent labeling. Figure 5(c) shows the viability for three different lines of cells including the liver hepatocellular carcinoma (HepG-2), the Hela, and the human embryonic kidney 293 (HEK 293) cells, which were incubated with the colloidal nanoagent at different concentration. It is seen that, after 24 h, the cell viability remained 75% to 90% for different types of cells, indicating the rather low cell toxicity of the nanoagent.73 In addition, no abnormal physiological reaction was observed for the mice during the TPE-TR imaging experiment, proving the negligible biotoxicity of the polymeric nanoagent.
Fig. 5.

(a) One-photon (solid line) and two-photon (open circle) luminescence excitation spectra of in PMMA-MAA nanoparticles. (b) Photostability of the nanoparticles sequestered in the liver tissues from a mouse. (c) Viability of HepG-2, Hela, and HEK 293 cells after incubation with the colloidal Eu@PMMA-MAA nanoagent for 24 h.68
3.2. Autofluorescence Suppression and Imaging Depth
It is seen in Fig. 6 that, when the delay time for autofluorescence rejection was set as , the view field was overwhelmed by the autofluorescence. This implies that, under femtosecond laser excitation, the TPE-induced fluorescence from endogenous fluorophores may interfere seriously with the Eu-luminescence images. However, the autofluorescence was drastically suppressed by setting a of 5 to 20 ns. Further prolonging could completely reject the biological autofluorescence, e.g., setting at 50 to 500 ns essentially did not change the image brightness. The negligible decrease in Eu-luminescence intensity in to 500 ns is due to the long persistence of Eu-luminescence (lifetime, 0.84 ms) and the much shorter lived autofluorescence (lifetime, a few tens of nanoseconds). Besides the autofluorescence rejection, the TPE-TR bioimaging is nearly free from the effect of laser heating, which is benefited from the low dose of laser exposure, the spatially decentralized energy distribution, and the effective thermal dissipation in a living body.69 The heating free performance is crucial for deriving the pharmacokinetics information under normal physiological conditions.
Fig. 6.

Bright-field image and corresponding TPE-TR images recorded with the indicated delay time for autofluorescence rejection [, cf. Fig. 3(a)]. The mouse model was injected via caudal vein with a colloidal solution of Eu@PMMA-MAA (0.1 mg/mL, ), which was sacrificed 10 min after the injection. The scale bar of 6 mm in the bright-field image applies to the TPE-TR images.
In the case of living tissues, the imaging depth and spatial resolution are dependent on the light wavelength, the absorption, and scattering properties of tissues and the brightness of the labeled objects.43,47 As described below, we have estimated the TPE-TR imaging depth based on the anatomical structure and the model of subcutaneous tissue imaging. First, we measured the anatomical depth of the liver in proximity to the xiphoid [Fig. 4(d)]. In viewing the fact that the liver sequestrated with the nanoagent in a high concentration was distinctly visualized by TPE-TR imaging (vide infra), we roughly estimated the imaging depth to be slightly larger than 1 mm. To be more precise, we further prepared a bulky PMMA-MAA particle (projection section, ), which was doped with complexes at a concentration of . This concentration was one-tenth of that of the colloidal solution used for the caudal vein injection, so as to mimic the sequestration of nanoparticles in subcutaneous tissues. We then covered the bulky particle with individual pieces of mouse lash meat of different thicknesses and accordingly recorded the transdermal TPE-TR images [cf. Fig. 7(a)]. It is seen that the original morphology of the labeled particle (control) was retained at an imaging depth of . However, it became blurry yet distinctly recognizable with increasing up to 2.3 mm. Interestingly, the imaging quality does not alter appreciably upon varying the subcutaneous tissue thickness from 1.3 to 2.3 mm [Fig. 7(b)].
Fig. 7.
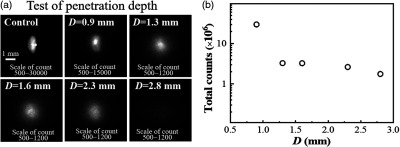
(a) Transdermal TPE-TR images of a -doped PMMA-MAA particle (projection section, covered with individual pieces of mouse lash meat of known thickness (). Control: the TPE-TR image of the uncovered particle. The scale bar of 1 mm in control applies to the other TPE-TR images. (b) Semilogarithmic plot of the total Eu-luminescence intensity against tissue thickness.
3.3. Characterization of the TVs as Visualized by In Vivo TPE-TR Imaging
Noninvasive and intravital TPE-TR images of three mice were recorded 5 min after the caudal vein injection of colloidal Eu@PMMA-MAA nanoagent [Figs. 8(a)–8(c), right column]. These images were obtained by placing the scanning plane 3 mm beneath the xiphoids of the mice. Despite the individual difference, each TV network consists of a pair of axial TVs (ATVs) along with the tributary and lateral TVs (LTVs) between the ATV pair. From the cross-sectional distribution profiles of Eu-luminescence intensity [cf. Fig. 8(b), inset], the ATV and LTV diameters, respectively, are determined to be 180 to and 130 to for the mice. These dimensions are in agreement with the TV diameters characterized by the use of anatomy-assisted optical microscopy.24,54 From the axillary to the femoral side, the ATVs become slightly thinner, whereas the spatial distribution of LTV thickness is heterogeneous. In Fig. 8, it is seen by comparing the TPE-TR images that some of the LTVs are interconnected, but the amount and patterns of interconnection are different among the mice. Here, we note that the LTVs are associated with collateral and more tenuous veins, which were not resolved with the present spatial resolution. The polymeric nanoagent in such higher-order veins, including venules and blood capillaries, was in substantially lower concentration compared to that in the principal LTVs, and hence appeared as a weak luminescent background.
Fig. 8.

(a)–(c) Bright-field images (left column) of three individual mice and the corresponding TPE-TR images (right column) recorded 5 min after caudal vein injection of colloidal Eu@PMMA-MAA nanoagent. The mouse bodies were aligned to render a similar orientation of the TV networks. Insets in the TPE-TR image of (b) show the representative cross-sectional distribution of Eu-luminescence intensity across the LTVs indicated by the red arrows. The solid lines in red were obtained by fitting the intensity profiles to a Gaussian model function, and the full width at half maximum was taken as the vessel diameter.
For a healthy mouse, it takes about a minute for the tail-vein administered nanoagent to be circulated into the ATVs as demonstrated by a recent study using real-time NIR-II optical bioimaging.56 In this work, the TPE-TR scanning was started 2 to 5 min after tail-vein injection, a time when the concentration of nanoagent in TV bloods increased approximately to the maximum. Afterward, the blood clearance process began, which led to a systematic decay of the luminescent contrast of the TPE-TR images (vide infra). With the general geometric features of TV network in mind, we will come to examine the transport and clearance processes of the polymeric nanoagent.
3.4. Noninvasive and Real-Time TPE-TR Imaging of the TV Networks
To investigate the transport and clearance processes of the nanoagent in the peripheral TV blood streams, we placed the scanning plane 3 mm below the xiphoid of a mouse model. Figure 9 shows the real-time TPE-TR images at representative timing. The TPE-TR image at 2.5 min renders a distinct TV network along with a weak and broad Eu-luminescent background, which originated from the sparsely distributed nanoagent in the higher-order venules and blood capillaries. In addition, the femoral artery of the left hind limb was also visualized () despite optical defocusing. As time elapsed, the image of TV network became considerably dimmer at 35 min and eventually became unrecognizable after 60 min. In parallel, the Eu-luminescence in the region immediately beneath the xiphoid, , as well as in the abdominal region, , became gradually stronger. Note that the Eu-luminescent area was the reminiscence of nanoagent accumulation in the liver, because the upper layer of the liver was sensed by TPE-TR imaging with the present imaging depth [cf. Figs. 4(d) and 7]. The high capacity of liver sequestration is to be confirmed by the TPE-TR imaging analysis of dissected organs (vide infra). On the other hand, the relatively weak and long-lasting Eu-luminescence in area is presumably attributed to the retention of nanoagent in the milky spots, which are submillimeter lymphoid tissues consisting of macrophages and other lymphocytes on the omentum majus.74
Fig. 9.

Bright-field image of a living mouse, and the corresponding real-time TPE-TR images at the indicated time after caudal vein injection of colloidal Eu@PMMA-MAA nanoagent (see Video 1 for more details of spatiotemporal evolution). The outlines a-1, a-2, and a-3 in irregular shapes in the 2.5-min image are the ROIs indicating the respective domains of femoral artery, liver, and abdomen as visualized by TPE-TR imaging. The scanning plane was placed 3 mm beneath the xiphoid. The spatial bar in the bright-field image holds for the TPE-TR images (Video 1, MPEG, 4.9 MB [URL: https://doi.org/10.1117/1.JBO.24.6.066009.1]).
Herein, we comment on the spatiotemporal evolution of the image patterns in the region (Fig. 9). From 2.5 to 20 min, the asymmetrical and diffusive luminescence image in was slightly upper shifted and transformed from vertical into horizontal orientation. Such spatiotemporal evolution is most likely due to the redistribution of the initially captured nanoagent among different lobes of the liver. We also would like to comment on the axial resolution of TPE-TR imaging. We have recorded, for the same mouse used for collecting the TPE-TR images as shown in Fig. 9, a complementary set of TPE-TR images by focusing on the femoral artery of the left hind limb. This was done in the same TPE-TR experiment by alternatively placing the scanning plane at 3 mm and at 10 mm, i.e., by targeting on the TV network and the femoral artery alternatively. The TPE-TR images focused on the femoral artery are shown in Fig. 10. It is seen that, with a 7-mm displacement of the focusing depth, the TV network visualized clearly in Fig. 9 became nearly invisible, implying that the axial resolution is substantially better than 7 mm. For the peripheral TVs at a submillimeter depth, the lateral resolution is as determined from the cross-sectional distribution of Eu-luminescence intensity of the finest LTVs (cf. Figs. 8 and 9). However, as mentioned in Sec. 3.2, the lateral resolution deteriorates considerably at an imaging depth exceeding 1 mm. To improve the imaging depth and the associated spatial resolution, the adoption of NIR-II luminescence labels and/or confocal imaging geometry would be helpful. At the present stage, our TPE-TR imaging modality with a 1 to 2 mm imaging depth is potentially useful for the detection of subcutaneous tumor models and peripheral vasculatures as OCT does.21,52
Fig. 10.

Bright-field image of a living mouse, and corresponding in vivo real-time TPE-TR images at the indicated timing after caudal vein injection of colloidal Eu@PMMA-MAA nanoagent. The outlines , , and in irregular shapes in the 2.5-min image are the ROIs indicating the respective domains of femoral artery, liver, and abdomen as visualized by TPE-TR imaging. The scanning plane was placed 10 mm beneath the xiphoid. The scale bar of 6 mm in the bright-field image holds also for the TPE-TR images. This set of images is complementary to that in Fig. 9, i.e., they were recorded for the same mouse by alternatively changing the imaging depth.
The aforementioned transport and clearance dynamics in regions are more clearly illustrated by the Eu-luminescence evolution profiles shown in Fig. 11(a). It is seen that the nanoagent concentration in both and domains increase in 2.5 to 10 min (cf. Fig. 9). This rising phase reflects the process of nanoagent uptake, which is followed by a clearance phase as indicated by the subsequent luminescence decay. The luminescence fluctuation in 20 to 80 min of the kinetics was due to the change in the postural and/or the physiological conditions of the mouse as corroborated by Video 1. On the other hand, the kinetics in Fig. 11(a) shows that the nanoagent concentration in the femoral artery decreased monotonically to a background level.
Fig. 11.
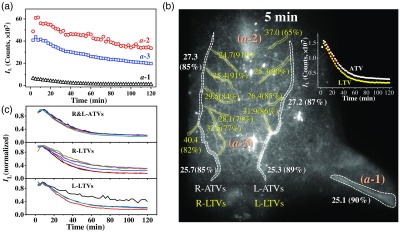
(a) Time evolution profiles of Eu-luminescence in the ROIs of in Fig. 9. (b) Spatial distribution of the Eu-luminescence decay time constant (clearance time constant, in min) along with the apparent clearance efficiency in parenthesis [amplitude ratio defined by Eq. (2), in %]. These values are derived from the Eu-luminescent kinetics of the ATVs and LTVs by fitting them to a monoexponential decay function, Eq. (1). Inset shows a pair of representative TV kinetics along with fitting curves (red solid). (c) Normalized Eu-luminescent kinetics of the ATVs and LTVs as indicated by the irregular ROIs adjacent to the numerals as depicted in (b).
To quantify the spatiotemporal evolution of the nanoagent in the TV network, both ATVs and LTVs were divided into the segmental regions of interest (ROIs) as shown in Fig. 11(b), and the corresponding Eu-luminescence kinetics curves are shown in Fig. 11(c). Note that some of the luminescence kinetics in Fig. 11(c) as derived from the proximity of and regions exhibit higher background, which are due to apparent high retention efficiency in these regions. The time evolution profile of each local ROI could be well accounted for by a monoexponential decay function:
| (1) |
where is the decay time constant representing the clearance time constant, and and stand for the luminescence intensity of the long-lasting background and the maximum, respectively. The intensity parameters allow us to define an apparent clearance efficiency () and, accordingly, an apparent retention efficiency ():
| (2) |
Figure 11(b) shows the spatial distribution of the clearance time constant along with the corresponding apparent clearance efficiency in parenthesis. It turns out that the ATVs and the LTVs exhibit a similar clearance time constant, 25 to 29 min, which is marginally longer than the clearance time constant of the femoral artery (). In addition, the apparent clearance efficiency, to 90%, is also similar for the entire TV network. Furthermore, the wide spread Eu-luminescence background exhibited a clearance time constant of and an apparent clearance efficiency of as derived from the Eu-luminescence kinetics in the ROIs in proximity of ATVs and LTVs (data not shown). Therefore, the TV network and the wide spread luminescent background all showed a rather high clearance efficiency. On the other hand, analysis of the and the kinetics in Fig. 11(a) derived the clearance time constant (apparent retention efficiency) of (32%) for the liver domain (), and of (38%) for the abdomen domain (). The relatively long clearance time constant and high retention rate of the liver domain () are to be attributed to the liver sequestration effect, whereas similar kinetics behavior of the abdominal domain () are presumably due to the retention of nanoagent in the milky spots on the omentum majus.74
3.5. Distribution of the Polymeric Nanoagent in the Internal Organs
The blood flow in the principal TVs and their tributary vessels plays an important role in the transport, clearance, and residence of polymeric nanoagents. To examine the distribution of the nanoagent in the internal organs accompanied the TV-blood clearance, the same mouse used for the in vivo pharmacokinetics analysis was sacrificed immediately after the TPE-TR imaging, and six different organs were accordingly dissected and subjected once again to TPE-TR imaging. The in vitro TPE-TR images are shown in Fig. 12(a). Judging from the Eu-luminescence brightness, the liver obviously exhibits the highest capacity of nanoagent deposition.
Fig. 12.

(a) TPE-TR images of the internal organs dissected from the same mouse as that used for the intravital TPE-TR imaging (cf. Fig. 9). The image brightness was adjusted by the indicated multiplication factors. The scale bar of 6 mm of the heart image applies to the other images. Broken lines outline the corresponding bright-field images. (b) Comparison of the overall Eu-luminescence intensity for the organs shown in (a).
Figure 12(b) compares the total Eu-luminescence intensity of the internal organs displayed in Fig. 12(a). It is seen that the capacity of nanoagent sequestration of liver is of the spleen or the lung, of the kidney, and of the heart. Besides the absolute volumes, the vasculature characteristics are considered to be mainly responsible for the different retention capacities of the organs. The rather high uptake capacity of the liver, as well as the spleen despite a smaller volume, can be attributed to the abundant artery and venous vessels, and especially to the sinusoids at their vascular endings.75,76 The lung and the kidney are both rich in blood capillaries, and the difference in the retention capacities is likely attributed to the difference in their bulkiness. The much lower uptake capacity of the heart is obviously due to the much faster blood flow in the cardiac vessels and the relatively less tributary vasculatures. In contrast to the internal organs, no polymeric nanoagent was detected in the brain tissues, which is obviously due to the effective blood–brain barrier. Taken together, our results prove that the liver is the major organ for the nanoagent deposition during the 2-h circulation in blood vasculatures.
4. Conclusions
This work has made use of a Eu-luminescence-labeled polymeric nanoagent as an angiographic contrast, combined with the recently developed TPE-TR imaging technology, to constitute a powerful modality for noninvasive and real-time imaging analysis of nanoagent pharmacokinetics in the TV networks of living mice. The spatiotemporal evolution of the Eu@PMMA-MAA nanoagent was characterized by an average clearance time constant of in both axial and lateral veins of the TV network, which was comparable to that in the femoral artery. In addition, the real-time TPE-TR imaging analysis showed a clearance time constant of and an apparent retention efficiency of 32% of the nanoagent in the liver domain, which together with the TPE-TR imaging analysis of the dissected internal organs proved that the liver is mainly responsible for the retention of the polymeric nanoagent. This work demonstrates that the TPE-TR modality, which merits in capturing the real-time spatiotemporal details of the Eu-luminescence-labeled nanoagents, is of great potential in the pharmacokinetic analysis of nanoagents in intravital peripheral vasculatures, as well as in the development of target-specific nanocarriers for efficient drug delivery.
Supplementary Material
Acknowledgments
This work was supported by the National Natural Science Foundation of China (NSFC Grant Nos. 21227803, 21673288, 21373268, and 21573010). The authors are indebted to Professors Rong-Cheng Han and Yu-Qiang Jiang at the State Key Laboratory of Molecular Developmental Biology, Institute of Genetics and Developmental Biology, Chinese Academy of Sciences, for their assistance in measuring the cell toxicity performance of the polymeric nanoagent.
Biography
Biographies of the authors are not available.
Disclosures
The authors declare that there are no conflicts of interests related to this article.
References
- 1.Huang H., Lovell J. F., “Advanced functional nanomaterials for theranostics,” Adv. Funct. Mater. 27(2), 1603524 (2017). 10.1002/adfm.v27.2 [DOI] [PMC free article] [PubMed] [Google Scholar]
- 2.Ma Y., et al. , “Cancer-targeted nanotheranostics: recent advances and perspectives,” Small 12(36), 4936–4954 (2016). 10.1002/smll.201600635 [DOI] [PubMed] [Google Scholar]
- 3.Hahn M. A., et al. , “Nanoparticles as contrast agents for in-vivo bioimaging: current status and future perspectives,” Anal. Bioanal. Chem. 399(1), 3–27 (2011). 10.1007/s00216-010-4207-5 [DOI] [PubMed] [Google Scholar]
- 4.Sumer B., Gao J., “Theranostic nanomedicine for cancer,” Nanomedicine 3(2), 137–140 (2008). 10.2217/17435889.3.2.137 [DOI] [PubMed] [Google Scholar]
- 5.McCarthy J. R., “The future of theranostic nanoagents,” Nanomedicine 4(7), 693–695 (2009). 10.2217/nnm.09.58 [DOI] [PubMed] [Google Scholar]
- 6.Fernandez-Fernandez A., Manchanda R., McGoron A. J., “Theranostic applications of nanomaterials in cancer: drug delivery, image-guided therapy, and multifunctional platforms,” Appl. Biochem. Biotechnol. 165(7–8), 1628–1651 (2011). 10.1007/s12010-011-9383-z [DOI] [PMC free article] [PubMed] [Google Scholar]
- 7.Yao J., Yang M., Duan Y., “Chemistry, biology, and medicine of fluorescent nanomaterials and related systems: new insights into biosensing, bioimaging, genomics, diagnostics, and therapy,” Chem. Rev. 114(12), 6130–6178 (2014). 10.1021/cr200359p [DOI] [PubMed] [Google Scholar]
- 8.Biju V., “Chemical modifications and bioconjugate reactions of nanomaterials for sensing, imaging, drug delivery and therapy,” Chem. Soc. Rev. 43(3), 744–764 (2014). 10.1039/C3CS60273G [DOI] [PubMed] [Google Scholar]
- 9.Wang B., et al. , “Metabolism of nanomaterials in vivo: blood circulation and organ clearance,” Acc. Chem. Res. 46(3), 761–769 (2013). 10.1021/ar2003336 [DOI] [PubMed] [Google Scholar]
- 10.Zhu M., Perrett S., Nie G., “Understanding the particokinetics of engineered nanomaterials for safe and effective therapeutic applications,” Small 9(9–10), 1619–1634 (2013). 10.1002/smll.201201630 [DOI] [PubMed] [Google Scholar]
- 11.Yu M., Zheng J., “Clearance pathways and tumor targeting of imaging nanoparticles,” ACS Nano 9(7), 6655–6674 (2015). 10.1021/acsnano.5b01320 [DOI] [PMC free article] [PubMed] [Google Scholar]
- 12.Huang X., et al. , “The shape effect of mesoporous silica nanoparticles on biodistribution, clearance, and biocompatibility in vivo,” ACS Nano 5(7), 5390–5399 (2011). 10.1021/nn200365a [DOI] [PubMed] [Google Scholar]
- 13.Wu L., et al. , “A green synthesis of carbon nanoparticles from honey and their use in real-time photoacoustic imaging,” Nano Res. 6(5), 312–325 (2013). 10.1007/s12274-013-0308-8 [DOI] [PMC free article] [PubMed] [Google Scholar]
- 14.Lewis J. D., et al. , “Viral nanoparticles as tools for intravital vascular imaging,” Nat. Med. 12(3), 354–360 (2006). 10.1038/nm1368 [DOI] [PMC free article] [PubMed] [Google Scholar]
- 15.Qin W., et al. , “Ultrabright red AIEgens for two-photon vascular imaging with high resolution and deep penetration,” Chem. Sci. 9(10), 2705–2710 (2018). 10.1039/C7SC04820C [DOI] [PMC free article] [PubMed] [Google Scholar]
- 16.Horton K. M., Fishman E. K., “Paraumbilical vein in the cirrhotic patient: imaging with 3D CT angiography,” Abdom. Imaging 23(4), 404–408 (1998). 10.1007/s002619900369 [DOI] [PubMed] [Google Scholar]
- 17.Bashist B., et al. , “Abdominal CT findings when the superior vena cava, brachiocephalic vein, or subclavian vein is obstructed,” Am. J. Roentgenol. 167(6), 1457–1463 (1996). 10.2214/ajr.167.6.8956577 [DOI] [PubMed] [Google Scholar]
- 18.Oladipo A. O., et al. , “A novel treatment for metastatic lymph nodes using lymphatic delivery and photothermal therapy,” Sci. Rep. 7, 45459 (2017). 10.1038/srep45459 [DOI] [PMC free article] [PubMed] [Google Scholar]
- 19.Ouchi T., et al. , “Superselective drug delivery using doxorubicin-encapsulated liposomes and ultrasound in a mouse model of lung metastasis activation,” Ultrasound Med. Biol. 44(8), 1818–1827 (2018). 10.1016/j.ultrasmedbio.2018.04.003 [DOI] [PubMed] [Google Scholar]
- 20.Takeda K., Mori S., Kodama T., “Study of fluid dynamics reveals direct communications between lymphatic vessels and venous blood vessels at lymph nodes of mice,” J. Immunol. Methods 445, 1–9 (2017). 10.1016/j.jim.2017.02.008 [DOI] [PubMed] [Google Scholar]
- 21.Noukeu L. C., et al. , “Nanoparticles for detection and treatment of peripheral arterial disease,” Small 14(32), 1800644 (2018). 10.1002/smll.v14.32 [DOI] [PubMed] [Google Scholar]
- 22.Winter P. M., et al. , “Molecular imaging of angiogenic therapy in peripheral vascular disease with ανβ3-integrin-targeted nanoparticles,” Magn. Reson. Med. 64(2), 369–376 (2010). 10.1002/mrm.22447 [DOI] [PMC free article] [PubMed] [Google Scholar]
- 23.Im H.-J., et al. , “Accelerated blood clearance phenomenon reduces the passive targeting of PEGylated nanoparticles in peripheral arterial disease,” ACS Appl. Mater. Interfaces 8(28), 17955–17963 (2016). 10.1021/acsami.6b05840 [DOI] [PMC free article] [PubMed] [Google Scholar]
- 24.Kodama T., et al. , “New concept for the prevention and treatment of metastatic lymph nodes using chemotherapy administered via the lymphatic network,” Sci. Rep. 6, 32506 (2016). 10.1038/srep32506 [DOI] [PMC free article] [PubMed] [Google Scholar]
- 25.Kodama T., et al. , “Visualization of fluid drainage pathways in lymphatic vessels and lymph nodes using a mouse model to test a lymphatic drug delivery system,” Biomed. Opt. Express 6(1), 124–134 (2015). 10.1364/BOE.6.000124 [DOI] [PMC free article] [PubMed] [Google Scholar]
- 26.Sharma M., Rameshbabu C. S., “Collateral pathways in portal hypertension,” J. Clin. Exp. Hepatol. 2(4), 338–352 (2012). 10.1016/j.jceh.2012.08.001 [DOI] [PMC free article] [PubMed] [Google Scholar]
- 27.Oldham M., et al. , “Three-dimensional imaging of whole rodent organs using optical computed and emission tomography,” J. Biomed. Opt. 12(1), 014009 (2007). 10.1117/1.2709858 [DOI] [PubMed] [Google Scholar]
- 28.Badea C. T., et al. , “Tumor imaging in small animals with a combined micro-CT/micro-DSA system using iodinated conventional and blood pool contrast agents,” Contrast Media Mol. Imaging 1(4), 153–164 (2006). 10.1002/cmmi.103 [DOI] [PubMed] [Google Scholar]
- 29.Schambach S. J., et al. , “Application of micro-CT in small animal imaging,” Methods 50(1), 2–13 (2010). 10.1016/j.ymeth.2009.08.007 [DOI] [PubMed] [Google Scholar]
- 30.Hlushchuk R., et al. , “Cutting-edge microangio-CT: new dimensions in vascular imaging and kidney morphometry,” Am. J. Physiol.-Renal Physiol. 314(3), F493–F499 (2018). 10.1152/ajprenal.00099.2017 [DOI] [PubMed] [Google Scholar]
- 31.Obusez E. C., et al. , “High-resolution MRI vessel wall imaging: spatial and temporal patterns of reversible cerebral vasoconstriction syndrome and central nervous system vasculitis,” Am. J. Neuroradiol. 35(8), 1527–1532 (2014). 10.3174/ajnr.A3909 [DOI] [PMC free article] [PubMed] [Google Scholar]
- 32.Upputuri P. K., et al. , “Recent developments in vascular imaging techniques in tissue engineering and regenerative medicine,” Biomed Res. Int. 2015, 1–9 (2015). 10.1155/2015/783983 [DOI] [PMC free article] [PubMed] [Google Scholar]
- 33.Einspieler I., et al. , “Imaging large vessel vasculitis with fully integrated PET/MRI: a pilot study,” Eur. J. Nucl. Med. Mol. Imaging 42(7), 1012–1024 (2015). 10.1007/s00259-015-3007-8 [DOI] [PubMed] [Google Scholar]
- 34.Gholami S., et al. , “Assessment of atherosclerosis in large vessel walls: a comprehensive review of FDG-PET/CT image acquisition protocols and methods for uptake quantification,” J. Nucl. Cardiol. 22(3), 468–479 (2015). 10.1007/s12350-015-0069-8 [DOI] [PubMed] [Google Scholar]
- 35.Drexler W., et al. , “Optical coherence tomography today: speed, contrast, and multimodality,” J. Biomed. Opt. 19(7), 071412 (2014). 10.1117/1.JBO.19.7.071412 [DOI] [PubMed] [Google Scholar]
- 36.Monroy G. L., et al. , “Clinical translation of handheld optical coherence tomography: practical considerations and recent advancements,” J. Biomed. Opt. 22(12), 121715 (2017). 10.1117/1.JBO.22.12.121715 [DOI] [PMC free article] [PubMed] [Google Scholar]
- 37.Wang P.-H., et al. , “Gold-nanorod contrast-enhanced photoacoustic micro-imaging of focused-ultrasound induced blood-brain-barrier opening in a rat model,” J. Biomed. Opt. 17(6), 061222 (2012). 10.1117/1.JBO.17.6.061222 [DOI] [PubMed] [Google Scholar]
- 38.Kim C., et al. , “In vivo photoacoustic mapping of lymphatic systems with plasmon-resonant nanostars,” J. Mater. Chem. 21(9), 2841–2844 (2011). 10.1039/c0jm04194g [DOI] [PMC free article] [PubMed] [Google Scholar]
- 39.Zhang H. F., et al. , “Functional photoacoustic microscopy for high-resolution and noninvasive in vivo imaging,” Nat. Biotechnol. 24(7), 848–851 (2006). 10.1038/nbt1220 [DOI] [PubMed] [Google Scholar]
- 40.Wang X. D., et al. , “Noninvasive photoacoustic angiography of animal brains in vivo with near-infrared light and an optical contrast agent,” Opt. Lett. 29(7), 730–732 (2004). 10.1364/OL.29.000730 [DOI] [PubMed] [Google Scholar]
- 41.Dean-Ben X. L., et al. , “Advanced optoacoustic methods for multiscale imaging of in vivo dynamics,” Chem. Soc. Rev. 46(8), 2158–2198 (2017). 10.1039/C6CS00765A [DOI] [PMC free article] [PubMed] [Google Scholar]
- 42.Smith B. R., Gambhir S. S., “Nanomaterials for in vivo imaging,” Chem. Rev. 117(3), 901–986 (2017). 10.1021/acs.chemrev.6b00073 [DOI] [PubMed] [Google Scholar]
- 43.Willmann J. K., et al. , “Molecular imaging in drug development,” Nat. Rev. Drug Discov. 7(7), 591–607 (2008). 10.1038/nrd2290 [DOI] [PubMed] [Google Scholar]
- 44.Hong G., et al. , “In vivo fluorescence imaging with Ag2S quantum dots in the second near-infrared region,” Angew. Chem. Int. Ed. 51(39), 9818–9821 (2012). 10.1002/anie.201206059 [DOI] [PubMed] [Google Scholar]
- 45.Key J., Leary J. F., “Nanoparticles for multimodal in vivo imaging in nanomedicine,” Int. J. Nanomed. 9, 711–726 (2014). 10.2147/IJN.S53717 [DOI] [PMC free article] [PubMed] [Google Scholar]
- 46.Jaffer F. A., Weissleder R., “Molecular imaging in the clinical arena,” J. Am. Med. Assoc. 293(7), 855–862 (2005). 10.1001/jama.293.7.855 [DOI] [PubMed] [Google Scholar]
- 47.Kim D., et al. , “Recent development of inorganic nanoparticles for biomedical imaging,” ACS Cent. Sci. 4(3), 324–336 (2018). 10.1021/acscentsci.7b00574 [DOI] [PMC free article] [PubMed] [Google Scholar]
- 48.Greco A., et al. , “Ultrasound biomicroscopy in small animal research: applications in molecular and preclinical imaging,” J. Biomed. Biotechnol. 2012, 1–14 (2012). 10.1155/2012/519238 [DOI] [PMC free article] [PubMed] [Google Scholar]
- 49.Vakoc B. J., et al. , “Cancer imaging by optical coherence tomography: preclinical progress and clinical potential,” Nat. Rev. Cancer 12(5), 363–368 (2012). 10.1038/nrc3235 [DOI] [PMC free article] [PubMed] [Google Scholar]
- 50.Mariampillai A., et al. , “Speckle variance detection of microvasculature using swept-source optical coherence tomography,” Opt. Lett. 33(13), 1530–1532 (2008). 10.1364/OL.33.001530 [DOI] [PubMed] [Google Scholar]
- 51.Si P., et al. , “Gold nanoprisms as optical coherence tomography contrast agents in the second near-infrared window for enhanced angiography in live animals,” ACS Nano 12(12), 11986–11994 (2018). 10.1021/acsnano.8b03862 [DOI] [PubMed] [Google Scholar]
- 52.Vakoc B. J., et al. , “Three-dimensional microscopy of the tumor microenvironment in vivo using optical frequency domain imaging,” Nat. Med. 15(10), 1219–1223 (2009). 10.1038/nm.1971 [DOI] [PMC free article] [PubMed] [Google Scholar]
- 53.Weissleder R., Pittet M. J., “Imaging in the era of molecular oncology,” Nature 452(7187), 580–589 (2008). 10.1038/nature06917 [DOI] [PMC free article] [PubMed] [Google Scholar]
- 54.Shao L., et al. , “Lymphatic mapping of mice with systemic lymphoproliferative disorder: usefulness as an inter-lymph node metastasis model of cancer,” J. Immunol. Methods 389(1–2), 69–78 (2013). 10.1016/j.jim.2013.01.004 [DOI] [PubMed] [Google Scholar]
- 55.Hong G. S., et al. , “Multifunctional in vivo vascular imaging using near-infrared II fluorescence,” Nat. Med. 18(12), 1841–1846 (2012). 10.1038/nm.2995 [DOI] [PMC free article] [PubMed] [Google Scholar]
- 56.Li C. Y., et al. , “In vivo real-time visualization of tissue blood flow and angiogenesis using Ag2S quantum dots in the NIR-II window,” Biomaterials 35(1), 393–400 (2014). 10.1016/j.biomaterials.2013.10.010 [DOI] [PubMed] [Google Scholar]
- 57.Shen B., et al. , “A facile strategy for the synthesis of a NaREF4-gold nanocomposite as a dual-modal bioimaging agent,” RSC Adv. 7(35), 21625–21629 (2017). 10.1039/C7RA02657A [DOI] [Google Scholar]
- 58.Deng Z. M., et al. , “A high performance Sc-based nanoprobe for through-skull fluorescence imaging of brain vessels beyond 1500 nm,” Nanoscale 10(19), 9393–9400 (2018). 10.1039/C8NR00305J [DOI] [PubMed] [Google Scholar]
- 59.Helmchen F., Denk W., “Deep tissue two-photon microscopy,” Nat. Methods 2(12), 932–940 (2005). 10.1038/nmeth818 [DOI] [PubMed] [Google Scholar]
- 60.Pu Y., et al. , “Two-photon excitation microscopy using the second singlet state of fluorescent agents within the ‘tissue optical window’,” J. Appl. Phys. 114(15), 153102 (2013). 10.1063/1.4825319 [DOI] [Google Scholar]
- 61.Crosignani V., et al. , “Deep tissue fluorescence imaging and in vivo biological applications,” J. Biomed. Opt. 17(11), 116023 (2012). 10.1117/1.JBO.17.11.116023 [DOI] [PMC free article] [PubMed] [Google Scholar]
- 62.Schafer-Hales K. J., et al. , “Fluorene-based fluorescent probes with high two-photon action cross-sections for biological multiphoton imaging applications,” J. Biomed. Opt. 10(5), 051402 (2005). 10.1117/1.2104528 [DOI] [PubMed] [Google Scholar]
- 63.Yang C., et al. , “A highly luminescent europium complex showing visible-light-sensitized red emission: direct observation of the singlet pathway,” Angew. Chem. Int. Ed. 43(38), 5010–5013 (2004). 10.1002/(ISSN)1521-3773 [DOI] [PubMed] [Google Scholar]
- 64.Fu L. M., et al. , “Efficient two-photon-sensitized luminescence of a europium(III) complex,” Angew. Chem. Int. Ed. 44(5), 747–750 (2005). 10.1002/(ISSN)1521-3773 [DOI] [PubMed] [Google Scholar]
- 65.Wen X. F., et al. , “Colloidal nanoparticles of a europium complex with enhanced luminescent properties,” Langmuir 24(13), 6932–6936 (2008). 10.1021/la800903s [DOI] [PubMed] [Google Scholar]
- 66.Shao G. S., et al. , “Bionanoprobes with excellent two-photon-sensitized Eu3+ luminescence properties for live cell imaging,” Chem.-Eur. J. 16(29), 8647–8651 (2010). 10.1002/chem.201001367 [DOI] [PubMed] [Google Scholar]
- 67.Xue F. M., et al. , “A europium complex with enhanced long-wavelength sensitized luminescent properties,” Phys. Chem. Chem. Phys. 12(13), 3195–3202 (2010). 10.1039/b920448b [DOI] [PubMed] [Google Scholar]
- 68.Yang W., et al. , “Nanoprobes for two-photon excitation time-resolved imaging of living animals: in situ analysis of tumor-targeting dynamics of nanocarriers,” Biomaterials 100, 152–161 (2016). 10.1016/j.biomaterials.2016.05.032 [DOI] [PubMed] [Google Scholar]
- 69.Zhang C. J., et al. , “Wide field of view, real time bioimaging apparatus for noninvasive analysis of nanocarrier pharmacokinetics in living model animals,” Rev. Sci. Instrum. 89(8), 085105 (2018). 10.1063/1.5026852 [DOI] [PubMed] [Google Scholar]
- 70.Borisov S. M., Wolfbeis O. S., “Temperature-sensitive europium(III) probes and their use for simultaneous luminescent sensing of temperature and oxygen,” Anal. Chem. 78(14), 5094–5101 (2006). 10.1021/ac060311d [DOI] [PubMed] [Google Scholar]
- 71.Xu C., Webb W. W., “Measurement of two-photon excitation cross sections of molecular fluorophores with data from 690 to 1050 nm,” J. Opt. Soc. Am. B 13(3), 481–491 (1996). 10.1364/JOSAB.13.000481 [DOI] [Google Scholar]
- 72.Dorsch R. G., Hausler G., Herrmann J. M., “Laser triangulation: fundamental uncertainty in distance measurement,” Appl. Opt. 33(7), 1306–1314 (1994). 10.1364/AO.33.001306 [DOI] [PubMed] [Google Scholar]
- 73.Mendoza G., et al. , “Near infrared dye-labelled polymeric micro- and nanomaterials: in vivo imaging and evaluation of their local persistence,” Nanoscale 10(6), 2970–2982 (2018). 10.1039/C7NR07345C [DOI] [PubMed] [Google Scholar]
- 74.Meza-Perez S., Randall T. D., “Immunological functions of the omentum,” Trends Immunol. 38(7), 526–536 (2017). 10.1016/j.it.2017.03.002 [DOI] [PMC free article] [PubMed] [Google Scholar]
- 75.Liu D. X., Mori A., Huang L., “Role of liposome size and RES blockade in controlling biodistribution and tumor uptake of GM1-containing liposomes,” Biochim. Biophys. Acta 1104(1), 95–101 (1992). 10.1016/0005-2736(92)90136-A [DOI] [PubMed] [Google Scholar]
- 76.Blanco E., Shen H., Ferrari M., “Principles of nanoparticle design for overcoming biological barriers to drug delivery,” Nat. Biotechnol. 33(9), 941–951 (2015). 10.1038/nbt.3330 [DOI] [PMC free article] [PubMed] [Google Scholar]
Associated Data
This section collects any data citations, data availability statements, or supplementary materials included in this article.