Abstract.
A clinical need exists for low-cost and noninvasive imaging tools capable of detecting inflammation in the joints of inflammatory arthritis patients. Previous studies have reported an optical contrast between inflamed and noninflamed joints resulting from distinct absorption and scattering properties. Accurate classification using nonocclusion-based continuous wave, transillumination imaging was limited to patient-specific changes during follow-up examination as opposed to single time-point examination, which was attributed to high intersubject variability. In distinction from previous work, optical images were acquired from the dorsal side with illumination on the palmar side and features about the spatial distribution of transmitted light along the joint were assessed using a normalized Fourier transform method. Results using this approach demonstrated an area under receiver operator curve of up to 0.888 for detecting inflammation in a pilot study involving single time-point examination of 144 joints from 21 rheumatology patients. This workflow may enable future development of clinically viable, low-cost devices for assessing inflammation in arthritis patients, without the need for cuff occlusion or comparison to baseline.
Keywords: optical imaging, rheumatoid arthritis, intrinsic contrast
1. Introduction
Rheumatoid arthritis (RA) is a common autoimmune condition characterized by persistent inflammation in the peripheral joints leading to damage and long-term disability. Around one-third of those diagnosed stop work on medical grounds within 5 years of initial symptom onset.1 In 2009, the economic impact of RA in the United Kingdom was estimated to be £560 million per year in direct healthcare costs and a total additional cost to the economy from sick leave and work-related disability of some £1.8 billion a year.2 Despite incomplete understanding of aetiology, management of disease progression has advanced significantly in recent decades, with a wide range of disease modifying anti-rheumatic drugs (DMARDs) now available to RA patients, either as synthetic or biologic agents.3 A window of therapeutic opportunity in the first 3 months of symptoms is now widely acknowledged,4,5 during which aggressive therapy using a combination of DMARDs improves long-term patient outcomes.6
In the modern rheumatology clinic, diagnosis is carried out through a combination of patient history, clinical examination (CE), blood tests, questionnaires, and medical imaging; however, well-established imaging modalities are each subject to specific disadvantages for detecting joint inflammation. Radiography suffers from low sensitivity to soft tissue changes limiting its use for quantification of damage, while both ultrasound (US) and magnetic resonance imaging (MRI) require highly trained staff, leading to high cost and limited availability.7 This creates a clinical need for low-cost and noninvasive imaging tools capable of quantifying inflammatory changes in human joints for early diagnosis. Diffuse optical imaging (DOI) is a highly sensitive, low-cost technique, in which near-infrared (NIR) light (650 to 930 nm) is injected into the tissue and subsequently measured at the tissue boundary. Intrinsic optical contrast in DOI results from changes in the predominant absorbing chromophores: oxyhaemoglobin, deoxyhaemoglobin, water, and lipids, or changes in scattering properties. Two modes of data acquisition have been investigated for joint imaging: continuous wave (CW),8–10 in which only the amplitude of transmitted intensity was considered, or frequency domain (FD),11,12 in which the mean phase shift for a modulated source is also measured providing information about the photon pathlength.
In an inflamed joint of a patient with RA, hyperplasia of stromal cells and infiltration of inflammatory cells into the synovium causes localized pathophysiological changes including lower oxygenation (hypoxia),13 increased blood vessel formation (synovial angiogenesis),14 and an increase in leukocyte and protein concentration,15 consequently altering the optical properties compared to healthy joints. A nontomographic, single wavelength, CW transillumination device was previously presented for detecting these optical changes, in which a light source was focused on the dorsal side of the finger, with images collected using a CCD camera on the palmar side.9,10,16,17 The captured images of flux transmitted through the joint were analyzed using a range of features including average intensity, maximum intensity, a Gaussian density function fit, and second derivative curvature of the light intensity. Longitudinal studies using this device involving a total of 136 proximal interphalangeal (PIP) joints from 22 RA patients and 8 healthy controls, reported up to 80% sensitivity () and 89% specificity () for correctly classifying changes in the inflammatory status over time when comparing baseline and follow-up examinations, by using advanced classification tools such as, a generalized linear model, Gaussian process regression, Gaussian process classification, or support vector machines.8–10 Despite these promising results for monitoring disease progression, the authors describe an inability to accurately determine the inflammatory status using this dataset from a single examination alone without reference baseline, as attributed to a “high interindividual variability of joint structure and optical characteristics.”9 This has been supported by evidence of a significantly greater variation observed between fingers from different subjects than when comparing fingers from the same subject in pathophysiological parameters recovered using tomographic, multispectral CW data.8 The use of cuff occlusion to partially diminish the impact of intersubject variability, in which haemodynamic changes were induced in the joint during wide-field, CW trans-illumination measurement, enabled inflammation in PIP joints to be classified with 83% and 64% from single time-point assessment;18 however, occlusion can potentially introduce additional discomfort in patients already experiencing a degree of pain. State-of-the-art techniques, involving tomographic reconstruction of 3-D maps of absorption and scattering coefficients using single wavelength FD data reported and of up to 91% and 86%, respectively, using basic statistical features such as the maximum, minimum, and variance.11 By extracting more complex heuristic features about the spatial distribution of these maps, including Gaussian mixture model or fast Fourier transform (FFT) analysis,19 improvements in and were demonstrated to between 93.8% and 100%.12 Although promising, the associated hardware required for measurement of phase has made FD joint imaging systems prohibitively expensive for clinical translation in the past. A CW approach is significantly cheaper, yet when considering only the amplitude of measurements for reconstruction using the same data set, the authors report dramatically reduced and of up to only 64% and 55%, respectively.12
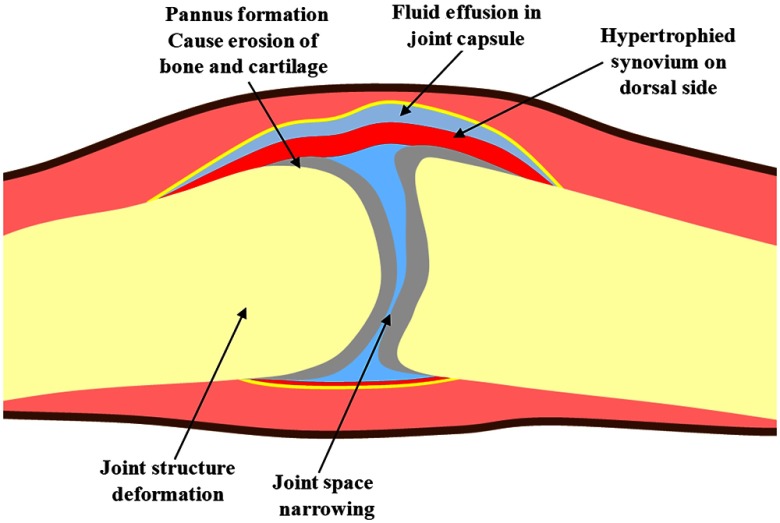
In noncontact, camera-based transmission DOI systems, the pixel-based measurements provide a high density array of detectors, while the joint is illuminated at a single source position for a given wavelength on the opposing boundary. Previous point-source-based joint imaging systems have all implemented an orientation in which images were acquired from the palmar side of the finger joint with light focused on the dorsal side;16,20–23 however, in the coronal direction, the anatomy of the finger joint is not symmetrical, with the synovium larger in volume on the dorsal than the palmar side to facilitate flexion of the joint when gripping. Measures of vascular flow using power Doppler ultrasound (PD-US) are closely related to activity of synovial inflammation and subsequent damage to the joints in patients with RA24–26 and have emerged as independent predictors of diagnostic outcome in undifferentiated arthritis.27 Consensus among rheumatologists is that the distribution of clinically significant synovitis is asymmetric, as illustrated in Fig. 1, with attempts to establish a consensus-based, RA synovitis scoring system reporting 100% agreement that the dorsal approach is more sensitive using PD-US than the palmar between seventeen expert musculoskeletal sonographers.28 This was reflected by higher kappa values for intraobserver and interobserver reliability of scoring of 0.51 for dorsal imaging compared to 0.30 for palmar. Furthermore, a randomized, placebo-controlled, two-center study reported high parallel scan, interreader reliability for dorsal PD-US scores (), demonstrating it to be a sensitive and reliable endpoint for drug therapies in RA.29 A study involving a cohort of 70 patients diagnosed with RA directly compared the dorsal and palmar approaches using PD-US, reporting greater prevalence of 22.1% versus 8.9% and greater double-positive rates, in which both grayscale US and PD-US are simultaneously observed, of 57.5% versus 17.4% for dorsal compared to palmar imaging of PIP joints.30 Fluorescence tomographic imaging of injected contrast agent indocyanine green in inflamed fingers also concurs, revealing a greater degree of vascularization on the dorsal aspect.31 This asymmetrical distribution of inflammation makes imaging orientation of joints using noncontact DOI systems of importance, the impact of which has not previously been investigated.
Fig. 1.
Illustration of the joint of an RA patient with inflammation on the dorsal side.
A noncontact, multispectral DOI system has been previously reported.8 Motivated by previous demonstrations of improvement in classification accuracy through the use of FFT analysis of absorption and scattering maps in diffuse optical tomography,32 a normalized FFT methodology is presented in this work to extract features about the spatial profile of transmitted flux along the sagittal direction of the joint. The impact of an asymmetrical distribution of inflammation in the coronal direction on these features is investigated in simulation studies and finally the performance of this methodology for classifying the inflammatory status of joints in patients with inflammatory arthritis is assessed in a pilot study. The paper is structured as follows: Sec. 2 outlines the materials and methods used in the pilot study; Sec. 3 presents results from simulation studies assessing the impact of asymmetrical inflammation; Sec. 4 presents results for accuracy of detecting inflammation using optical transmission images; Sec. 5 relevant conclusions and future work will be discussed.
2. Materials and Methods
2.1. Study Design
Between March and August 2018, a controlled pilot study was carried out, in which 21 patients were recruited through the NIHR CRF Early Arthritis Clinic in University Hospitals Birmingham NHS Foundation, Birmingham. Ethical approval was granted by the West Midlands Black Country Research Ethics Committee as part of the Birmingham early arthritis cohort (BEACON) observational cohort study (REC reference 12/WM/0258), with all subjects providing written informed consent prior to participating. Inclusion criteria for the study were treatment-naïve new onset of (1) at least one inflammatory joint symptom, from either joint pain, swelling, or morning stiffness and/or (2) at least one joint displaying evidence of clinically apparent synovitis. For this study, patients within this cohort were classified into one of two groups, according to their baseline diagnosis, which were either diag-RA, which included patients diagnosed with RA according to the ACR/EULAR 2010 criteria,33 or non-RA, which included all remaining diagnoses which did not currently fulfill these criteria. Baseline diagnosis within the non-RA group consisted of a range of inflammatory conditions including; unclassified arthritis (UA), inflammatory arthralgia (IA), parvovirus arthritis (PV), or palindromic arthritis (PA). Although patients within the non-RA group did not fulfill the diagnostic criteria for RA upon presentation, the disease in some of these patients may progress into established RA at a later stage and in some cases was associated with the presence of autoantibodies.
2.2. Ultrasonography and Clinical Examination
All patients underwent both US scans and CE. Ultrasonography was carried out using an US scanner (LOGIQ-E9; GE healthcare, Cardiff, United Kingdom) equipped with a 6 to 15-MHz linear array transducer and musculoskeletal presets using high frequencies of in order to provide the best axial resolution for superficial structures. The relevant PIP joints were scanned from the dorsal aspect. Three features of interest in US images relevant for the assessment of joint involvement in RA were considered: synovial hypertrophy (SH) which is visible thickening of the synovial membrane seen as hypoechoic tissue in grayscale images, effusion (EF) which is accumulation of fluid observed in grayscale images as a black anechoic region and finally hyperaemia (PD) is abnormal blood flow compared to background levels in synovial blood vessels. These clinical features were scored using a four-grade semiquantitative scoring system on a scale of 0 (none), 1 (mild), 2 (moderate), and 3 (severe). This was carried out by a single experienced examiner in accordance with the EULAR-OMERACT consensus definition.28,34 CE was carried out by trained metrologists for all patients, which involved bimanual palpation of 28 joints for binary scoring of the presence of clinical swelling (CSW) and/or clinical tenderness (CTE). Both US and CE examiners were blinded to optical image data. Imaged joints included the II, III, IV, and for some later participants the V PIP joints, on each hand. The left hand of two participants could not be imaged, due to the presence of Dupuytren’s contracture or the inability to remove jewellery, which would interfere with optical signal, giving 144 finger joints in total. Two sets of classes were generated, based on either US or CE scores, in which finger joints were labeled as either inflamed or noninflamed. For US labels, PIP joints with a total score across all features of greater than 0 when summing all semiquantitative features were defined as inflamed, while for CE a score of 1 for either CTE or CSW were labeled as inflamed. When displaying these scores, the following convention will be used [SH EF PD] (CTE CSW). Laboratory tests were also carried out, including rheumatoid factor (RF) and cyclic citrullinated peptide (CCP), for aiding diagnosis.
2.3. Noncontact DOI System
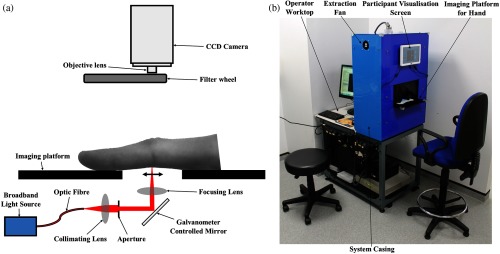
Specifications and acquisition protocols of the multispectral, noncontact DOI system, as shown in Fig. 2, have been outlined previously.8 In brief, patients placed their hands on the platform of the system, which collected optical transmission images of the finger using an air-cooled, charged couple device camera, while a broadband, point source was injected into the opposing side of the joint. Images were collected at 14 source positions in a straight line along the sagittal direction of the finger, with this acquisition repeated at five wavelengths (650, 710, 730, 830, and 930 nm) by spectral decoupling using a filter wheel preceding the camera objective lens. An image mask was created by manually adjusting the threshold until the boundary for the hand could be clearly visualized, from which an autoexposure routine was implemented such that that the maximum within the image mask region was 50,000 counts. The optical transmission image that corresponded with when the light source was directly under the joint was manually selected for further analysis, based on the wrinkles in the PIP joint.
Fig. 2.
(a) 2-D schematic of system for dorsal optical transmission images acquisition. (b) Photograph of the optical imaging system setup in the rheumatology clinic. Patients placed their hand on the imaging platform and aligned their PIP joint with the source positions before acquisition.
2.4. Feature Engineering and Statistical Analysis
A series of image processing steps were applied, designed to extract heuristic features indicative of the spatial distribution of light transmitted along the sagittal direction of the finger joint, as shown in Fig. 3. First, the threshold mask from the autoexposure routine, which distinguished the finger from the background, was eroded using a 2-pixel radius disk to discard boundary pixels and truncated to a section in the sagittal direction 27 pixels () in length, defining a region of interest (ROI) expected to contain the most useful information relevant to the pathological state of the joint. The mean intensity across the transverse direction () of the DOI transmission image within this ROI image mask was computed, defined as
| (1) |
where is the image intensity in counts, is the pixel index in the transverse direction, is the transverse image width in pixels, and is the binary image mask, for each sagittal pixel (). As wrinkles on the surface of the finger could introduce small fluctuations in the profile which appeared as high frequency noise, a 10-pixel window Gaussian smoothing filter was applied to this curve. A one-dimensional discrete FFT was applied, with zero padding first added to the next highest power of two (), to decompose the curve into its underlying frequency components by calculating the amplitude spectrum of the complex FFT coefficients. To minimize the impact of intersubject variability in the absolute intensity resulting from variation in finger size or underlying optical properties, the of each profile was normalized such that the total sum of all points was equal to 1, which is equivalent to the value of the first (or DC) Fourier coefficient. The impact of normalization is that remaining FFT coefficient values represent the relative amplitude for their corresponding frequencies and only depend on the spatial distribution of the transmitted light. The number of coefficients used as heuristic features for assessment of inflammation was reduced to unique values, as a consequence of the symmetrical properties of the FFT.
Fig. 3.
Data processing steps applied to an example PIP joint, for feature extraction, with (a) grayscale image of finger with red line showing boundary of ROI defined from image mask, (b) grayscale image overlaid with transmitted DOI image from through the joint in color, (c) mean intensity across transverse of DOI image plotted for each sagittal pixel, and (d) FFT amplitude spectrum of the normalized profile.
To determine the significance of differences observed between groups, inflamed versus noninflamed joints or diag-RA versus non-RA, the nonparametric, Mann–Whitney U (MWU) test was used as this does not require the assumption of a normal distribution for the data, with the null hypothesis defined to be the probability that a randomly selected member from the first sample exceeds a randomly selected member from the second sample is 50%. Significance levels are shown at *, **, or *** defined as either , , or with a two-tailed value. To assess the diagnostic accuracy of DOI, receiver-operator characteristics (ROC) analysis was carried out by varying the threshold value for the FFT amplitude between 0 and 1 in 0.0001 increments and plotting against (). A decision strategy was employed such that for joints labeled as inflamed according to US or CE reference, either a true positive or false negative was recorded if the FFT amplitude was either above or below this threshold, respectively, while for joints labeled noninflamed, either a false positive or true negative was recorded if the FFT amplitude was either above or below the threshold, respectively. The area under the curve (AUC) was calculated as a metric of accuracy of detecting inflammation by numerical integration of this ROC curve using the trapezoid rule. Optimal and values were chosen based on selection of a threshold value that corresponded to the highest Youden index (). Finally, the significance of Pearson correlation coefficients at a patient level were assessed using a two-tailed -test, with the null hypothesis that relationship between the two test variables is not linear. All data processing and statistical analysis was performed using MATLAB (The MathWorks, Natick, Massachusetts).
3. Simulated Studies
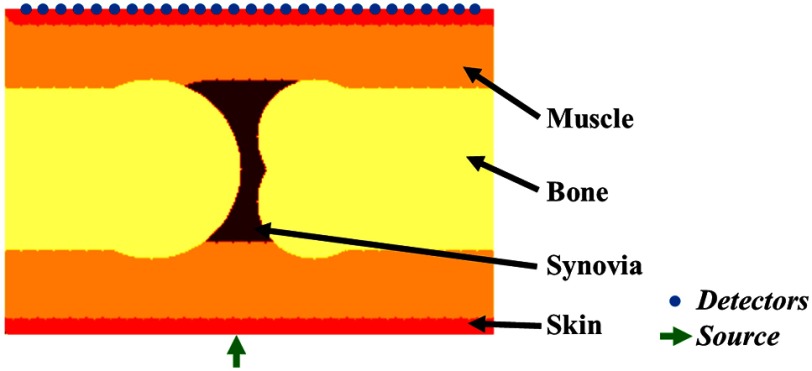
Two orientations are feasible using the presented system when acquiring transillumination images of a PIP joint, either with the joint illuminated on the dorsal side and optical detection on the palmar, or the reverse setup with palmar illumination and dorsal detection. To assess the impact of depth of inflammation on contrast using the proposed normalised FFT feature, a simple two-dimensional (2-D) model representing the anatomy of the PIP joint was constructed, as shown in Fig. 4, with the skin and bone thickness assigned as 1 and 10 mm, respectively, dimensions approximately estimated from an available MRI image of a PIP joint. Physiological values assigned to each of these regions are shown in Table 1, with total haemoglobin (tHb) and water () chosen according to previous literature,35 all tissue oxygenation () values assumed to be 70% and values for the synovia region based on previous joint imaging studies,36 while scattering amplitude and scattering power were both assumed to be homogeneous with values of and 2.145, respectively. A single source and 27 virtual detectors separated by 1 mm along the opposing boundary were assigned to this model, to reflect the point source illumination and a pixel array from camera-based detection used in this study.
Fig. 4.
Simplified 2-D model of the joint and imaging setup with a single source and 27 virtual detector positions.
Table 1.
Physiological values assigned to each tissue in the joint model.
| Tissue | tHb () | (%) | Water (%) |
|---|---|---|---|
| Muscle | 0.07 | 70 | 0.5 |
| Skin | 0.06 | 70 | 0.5 |
| Bone | 0.049 | 70 | 0.15 |
| Synovia | 0.02 | 70 | 0.5 |
| Inflammation | 0.14 | 35 | 0.5 |
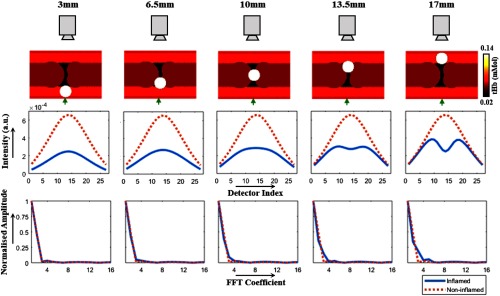
A circular anomaly with a 3-mm radius was assigned as a basic representation of inflammation in an RA patient, the center depth of which was varied at five depths, 3, 6.5, 10, 13.5, and 17 mm, as shown in Fig. 5. Values for this anomaly are shown in Table 1, with increased tHb and decreased to reflect the associated angiogenesis and hypoxia typically observed in an inflamed joint. At each height, boundary fluence data for all detectors were generated at 650 nm, either with or without the inflammation anomaly, implemented using open-source, light modeling finite element method package NIRFAST.37
Fig. 5.
Simulation demonstrating the impact of depth of inflammation in finger from detection boundary on observed contrast in spatial profile of boundary data.
At a 3-mm height, intensity plots in Fig. 5 show a decrease in the absolute transmitted flux when the inflammation anomaly was close to the source, compared to the noninflamed case; however, a negligible change in the normalized FFT amplitude spectra is observed, indicating that the spatial distributions in intensity are similar. As the height of the inflammation anomaly is increased closer to the detection boundary, the spatial distribution of intensity in the inflamed case becomes more distinct from the noninflamed case, with the presence of a visible dip in the profile, reflected in the increasing difference between their normalized FFT amplitude spectra. For example, the normalized amplitude for the third FFT coefficient was 0.0072 in the noninflamed simulation, while when the inflamed anomaly was added at heights of either 3, 6.5, 10, 13.5, or 17 mm, the corresponding score was increased to either 0.016, 0.049, 0.090, 0.144, or 0.189, respectively, indicating a greater sensitivity of this feature score as the height was increased. These observations are an intrinsic result of the diffuse nature of light in biological tissue, with greater spatial resolution for a single source and camera setup typically closer to the detection boundary, making the source and detector orientation of importance when using features sensitive to the spatial distribution of flux. Based on these simulated studies and evidence in the literature of a greater prevalence of clinically relevant synovitis on the dorsal side, as discussed in Sec. 1, experimental studies were carried out with imaging from the dorsal side and illumination on the palmar side.
4. Results
4.1. Typical DOI Contrast
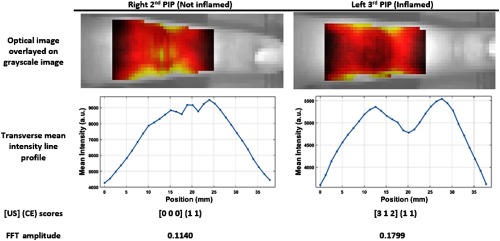
Dorsal optical transmission images of two fingers from the same participant displayed in Fig. 6 illustrate the typical optical contrast observed between inflamed and noninflamed joints. The right PIP II, which according to US had no sign of inflammation, showed a peak in intensity at the joint region, similar to that seen reported in transmission images of healthy fingers.8 Conversely, the left PIP III exhibits an area of lower intensity at the joint region compared to the immediately surrounding finger surface and was clinically inflamed according to US measurements scoring severe SH, mild effusion, and moderate hyperaemia. This manifested as a significant dip in transverse mean intensity profile at the joint region and a correspondingly increased value for the FFT amplitude, compared to that seen in the right PIP II. Both joints were classified as swollen and tender in CE, highlighting the subjective nature of CE.
Fig. 6.
Two example PIP joints from the same participant. Top row: optical dorsal transmission images at 650 nm when the point source is directly under the joint, overlaid on a brightfield image of the finger. Second row: corresponding line profiles of the mean intensity in the transverse direction. Third row: reference scores [SHEFPD] (CTE CSW) for each joint. Bottom row: normalized FFT amplitude score at frequency.
4.2. Impact of Asymmetrical Inflammation
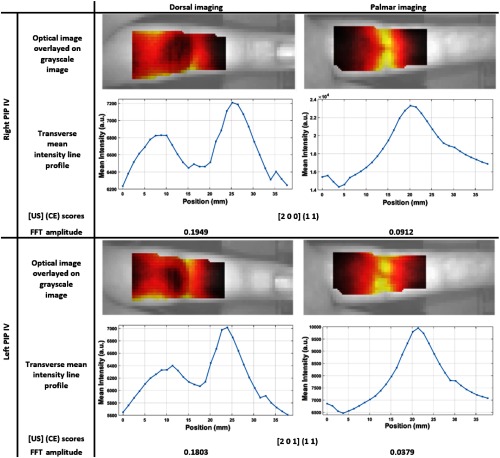
To investigate whether this optical contrast was observable with illumination from the dorsal side and detection from the palmar side, a single patient (F/29) with evidence of clinical synovitis in the right and left PIP IV joints, with moderate hypertrophy, clinical tenderness, and swelling in both joints and one joint with mild hyperaemia, was asked to place their hands on the imaging platform in both orientations, such that these joints were imaged in the dorsal approach as shown in Fig. 2, and then rotated 180 deg such that the palmar side faced the camera and the dorsal side was illuminated.
A region of lower intensity was observed in both joints when imaging from the dorsal approach, shown in Fig. 7, consistent with that seen in a number of inflamed joints throughout the study, while when imaging orientation was reversed such that transmission images were acquired from the palmar side, this optical contrast was no longer visible, with a peak intensity still seen at the joint region. This distinction between dorsal and palmar approaches are similar to differences observed during simulations in Sec. 3, when inflammation was either close to the detection side, corresponding to dorsal imaging, or close to the illumination side, corresponding to palmar imaging, indicating the potential advantage of a clear, identifiable contrast when imaging from the dorsal side.
Fig. 7.
Two PIP joints from the same participant each with examples of both the dorsal and palmar imaged from approaches for the same joint. For each joint, (top row) optical dorsal transmission images at 650 nm when the point source is directly under the joint, overlaid on a brightfield image of the finger; (second row) corresponding line profiles of the mean intensity in the transverse direction; (third row) reference scores [SHEFPD] (CTE CSW) for each joint; and (bottom row) normalized FFT amplitude score at frequency.
4.3. Inflammation Detection Accuracy
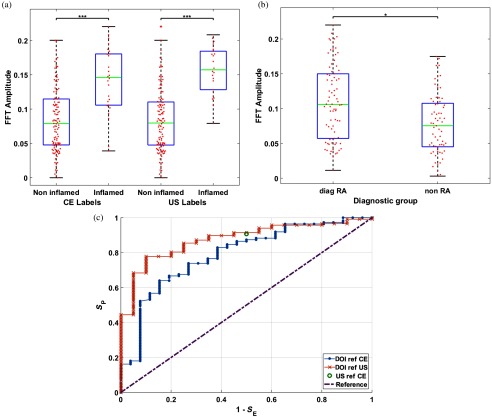
Results from the pilot study involving all 21 patients are displayed as boxplots of the normalised FFT amplitude at a frequency of with 650-nm data in Fig. 8(a), demonstrating a significantly higher median amplitude for inflamed joints compared to noninflamed joints, when either US or CE labels are used. The resulting ROC curves shown in Fig. 8(c) produce AUC values of 0.801 or 0.888, for US or CE labeling, respectively. For example, optimal values for and for this dataset in Fig. 8 were 57.6% and 92.3% with CE labels at a threshold value of 0.0861 and 77.9% and 90.9% with US labels at a threshold of 0.1143. Comparison between joints of patients diagnosed with RA compared to joints from non-RA patients with other classified diagnoses in Fig. 8(b) demonstrate a significantly increased median amplitude in the diag-RA group, indicative of a comparatively higher prevalence of inflamed joints in this group. This is in good agreement with US and CE labels, with ratios calculated of 2.88 or 2.06, respectively, for the prevalence of inflamed joints in diag-RA compared to non-RA and correspondingly greater global scores displayed for the diag-RA group in Table 2.
Fig. 8.
Example boxplots for the FFT amplitude at a frequency of , (a) comparing noninflamed against inflamed joints, labeled either using CE or US, or (b) comparing joints from the diag-RA patient group with those from the non-RA group. (c) ROC plots for DOI with either CE or US as reference labels, corresponding plot of and for US when CE is used as a reference label and the reference line corresponding to no ability to differentiate between inflamed and noninflamed joints. A marker of the sensitivity using US with CE. For each graph DOI data were collected at either 650 nm.
Table 2.
Patient demographics and global clinical scores summed across II-V PIP joints from both hands. Percentages in brackets are relevant to each group.
| Diagnostic group | Diag-RA | Non-RA |
|---|---|---|
| Number, | 12 | 9 |
| Baseline diagnosis, (%) | ||
| Rheumatoid arthritis | 12 (100) | 0(0) |
| UA | 0(0) | 4 (44) |
| IA | 0(0) | 2 (22) |
| PA | 0(0) | 1 (11) |
| PA | 0(0) | 2 (22) |
| Age, , years | ||
| Female, (%) | 8 (66) | 6 (66) |
| RF positivity, (%) | 9 (75) | 5 (56) |
| CCP positivity, (%) | 9 (75) | 3 (33) |
| Global US score, | ||
| SH | 3.3 (4.8) | 0.89 (1.4) |
| PD | 1.9 (3.1) | 0.78 (1.4) |
| Global CE score, | ||
| CTE | 1.7 (2.6) | 0.89 (2.0) |
| CSW | 1.3 (2.4) | 0.11 (0.33) |
Median FFT amplitude values were statistically higher in inflamed joints compared to noninflamed at all wavelengths, for both US or CE labeled data, as displayed in Table 3 with corresponding -values calculated using the MWU test. The greatest AUC scores and lowest -values were seen with 650-nm data, while the contrary lowest AUC scores and highest -values occurred with 930-nm data. This corresponds with a decrease in the median FFT amplitude as wavelength is increased for both the inflamed and noninflamed groups, indicating a decrease in optical contrast from inflammation at higher wavelengths. Consistently, AUC scores were lower and -values higher for CE rather than US labeled data, indicating better agreement between DOI and US than CE.
Table 3.
Median FFT amplitude values for either noninflamed or inflamed joints as labeled with US scores and corresponding -values and AUC values from ROC analysis, for all wavelengths when either CE or US were used as class labels.
| (nm) | Median FFT amplitude | -value | AUC | ||
|---|---|---|---|---|---|
| Noninflamed | Inflamed | ||||
| US | 650 | 0.0797 | 0.157 | 0.00000000757 | 0.888 |
| 710 | 0.0785 | 0.152 | 0.00000002010 | 0.877 | |
| 730 | 0.0785 | 0.151 | 0.00000001410 | 0.880 | |
| 830 | 0.0712 | 0.150 | 0.00000002010 | 0.877 | |
| 930 | 0.0582 | 0.137 | 0.00000009060 | 0.859 | |
| CE | 650 | 0.0789 | 0.146 | 0.00000166 | 0.801 |
| 710 | 0.0785 | 0.132 | 0.00000844 | 0.780 | |
| 730 | 0.0785 | 0.133 | 0.00000493 | 0.787 | |
| 830 | 0.0717 | 0.124 | 0.00001890 | 0.767 | |
| 930 | 0.0595 | 0.111 | 0.00001810 | 0.769 | |
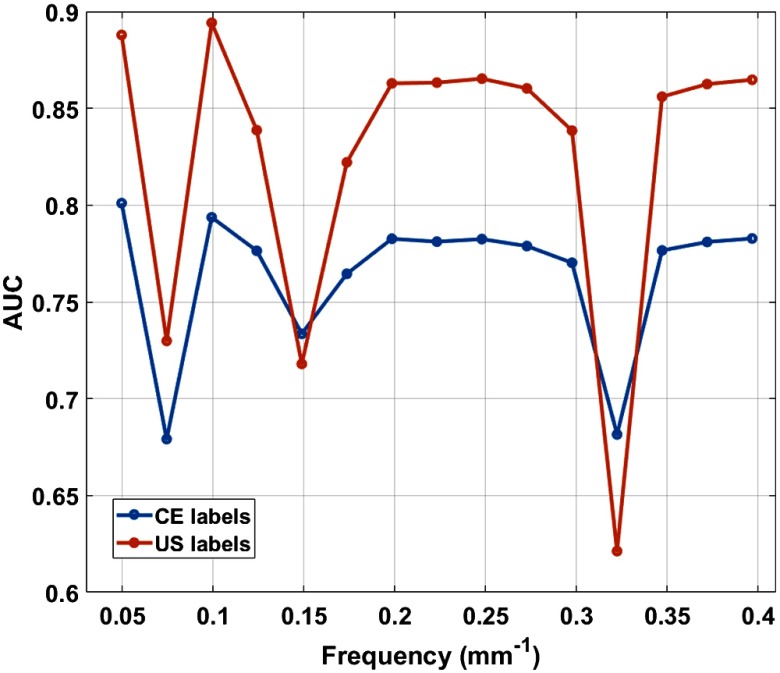
The accuracy of detecting inflammation using the normalized FFT amplitude was analyzed at all frequencies, with AUC values generally highest at frequencies of either 0.05 or , as shown in Fig. 9. The corresponding length scales of 20 or 10 mm are approximately similar in scale to the width of the dip typically observed in the intensity profiles. This pattern was consistent for all wavelengths, and therefore for conciseness results using amplitude scores at a frequency of have been displayed in this work.
Fig. 9.
Variation of AUC in ROC analysis at all FFT frequencies for 650-nm DOI data when either US or CE were used as labels.
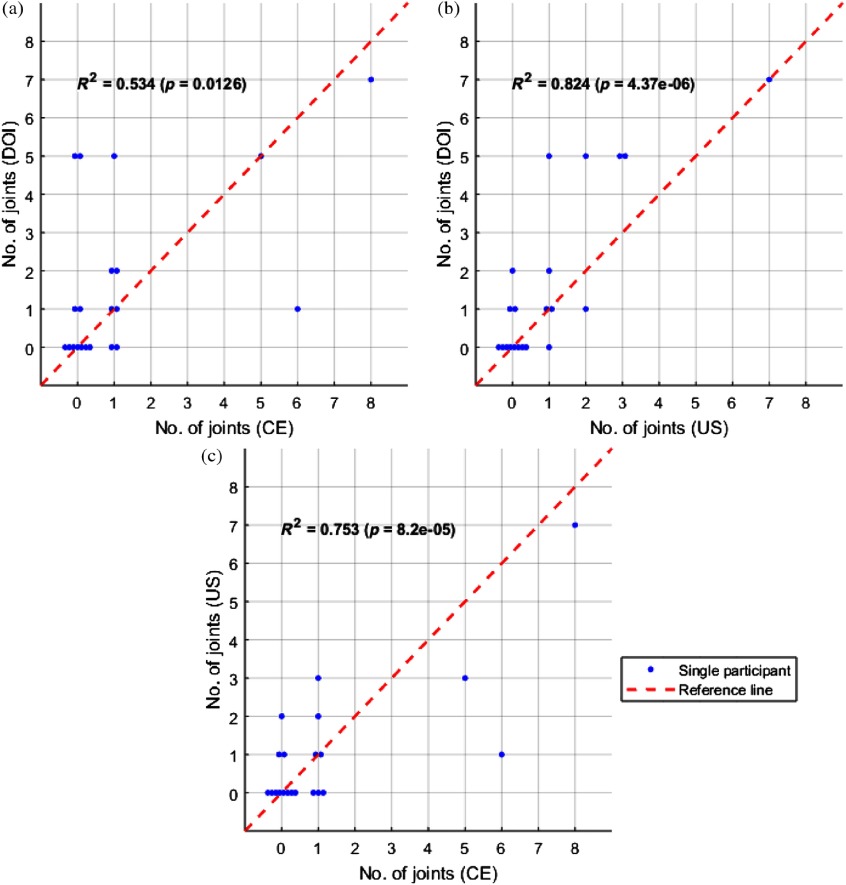
All three plots comparing the total number of inflamed joints on a patient level showed statistically significant correlations between each imaging modality (). A better agreement was seen between DOI and US than for DOI with CE, with greater values as shown in Fig. 10. Plots of CE versus US are also shown for comparison, again with a reasonably strong correlation, but still some disagreement between these two ground truth references.
Fig. 10.
Plots comparing the number of inflamed joints on a patient level between either (a) DOI versus CE, (b) DOI versus US, or (c) US versus CE, with each marker representing a single participant. Joints were classified as inflamed for DOI using 650-nm data, with a threshold corresponding to the optimum Youden index () established from ROC analysis.
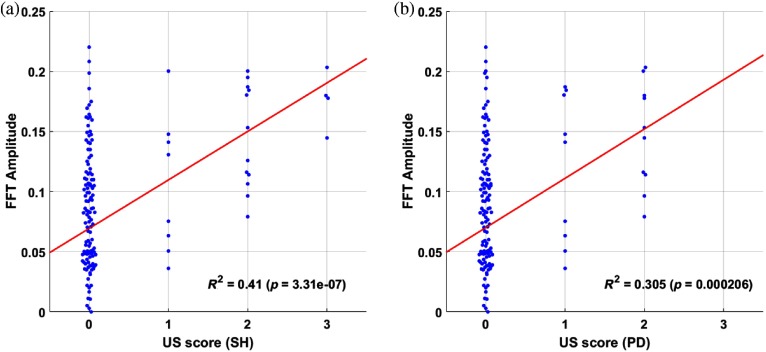
Regression analysis comparing the relationship between the four-grade, semiquantitative US scoring system, and the normalized FFT amplitude values demonstrated weak but statistically significant positive correlations in both cases, as shown in Fig. 11, providing further evidence that the normalized FFT amplitude is sensitive to altered optical properties that result from localized inflammatory changes within the joint. Agreement with PD () was slightly inferior to SH (); however, this is most likely a result of the lack of grade 3 scores in the former. This highlights the potential for DOI as a tool for quantitative assessment of severity of inflammation, although a cohort with higher prevalences at scores of 1, 2, and 3, in addition to further comparison with scoring systems utilized in other modalities, such as MRI,38 would be required to validate this hypothesis more robustly.
Fig. 11.
Beeswarm plots with each marker representing an individual joint, comparing the relationship for US scores for (a) SH or (b) hyperaemia (power Doppler) with normalized FFT amplitude values at frequency using 650-nm data. The red line shows the first-order polynomial fit.
5. Discussion and Conclusions
Successful translation of optical imaging systems from bench-top investigations to application in rheumatology clinics will require certain characteristics to justify their usefulness over existing imaging modalities for diagnosis and monitoring, such as low cost, ease of implementation by nonclinical staff, and noninvasiveness. In previous studies involving transillumination DOI for detecting joint inflammation,16,18,20–23 all devices had specific limitations in the context of clinical translation, relying on either follow up assessment for comparison to baseline; cuff occlusion to induce haemodynamic changes; or expensive, tomographic, FD measurements, for accurate detection of inflammation. The limited performance using CW transillumination images for single time-point examination has been attributed due to a high intersubject variability in optical properties and finger geometry. In this work, a normalized FFT-based algorithm was presented for the detection of inflamed joints, engineered to extract features which assess the spatial distribution of transmitted light flux through the joint that are independent of total intensity. The aim of this approach was to minimize the impact of intersubject variability in absolute boundary flux without the need for complex modeling in solving an under determined and ill-posed tomographic inverse problem. A majority of joint imaging devices have involved illumination on the dorsal side and detection on the palmar side.16,20–23 The impact of joint orientation for DOI has been investigated through simulation studies, in which the normalized FFT amplitude showed greater sensitivity to inflammatory changes occurring closer to the detection boundary. Evidence from the literature of a higher prevalence of clinically significant synovitis on the dorsal side therefore implies that dorsal imaging should improve sensitivity compared to palmar imaging for noncontact, camera-based set-ups. This was supported by results from a single patient able to rotate their hands, which demonstrated an optical contrast in inflamed joints only visible when imaging from the dorsal side. For the first time to the authors knowledge, these preliminary results indicate the importance of considering orientation in DOI of joints, although more comparative studies between dorsal and palmar approaches are needed in future.
Results from a pilot study involving 144 joints from 21 rheumatology patients undergoing single time-point examinations demonstrated accurate detection of inflamed joints, with AUC of up to 0.888 and diagnostic accuracies of up to 77.9% and 90.9% for and , respectively, achieved when using the proposed normalized FFT methodology applied to dorsal optical CW transmission images from this specific dataset. Significantly higher median FFT amplitudes were consistently seen in inflamed joints at all measurement wavelengths, with greatest AUC values at 650 nm which generally decreased with increasing wavelength. This corresponds well with the previous literature, with studies of inflammatory mice models using hyperspectral diffuse reflectance measurements also reporting reduced transmitted intensity at all measured wavelengths, but greater changes recorded for the visible red region (600 to 700 nm) compared to in the NIR window (700 to 900 nm).39 Early studies of extruded synovium and synovial fluid samples from human subjects also reported an increase in absorption in diseased ttissue for all wavelengths (600 to 1100 nm) for synovial fluid and for a majority of measured wavelengths for the synovium (600 to 900 nm and 1000 to 1100 nm),40 with greatest discrepancy in optical properties seen at 650 nm, motivating this choice of wavelength for single wavelength studies.20 Better agreement was seen between DOI and US than DOI and CE, both in ROC analysis and in the number of inflamed joints on a patient level, which is encouraging as US has been shown to be more sensitive and reliable than CE.41–43
Spatial analysis of dorsal optical transmission images may enable future development of a clinically viable, low cost device for assessing inflammation in arthritis patients, without invasive contrast agents, cuff occlusion, or comparison to baseline. A limitation with this pilot-study is that the US and CE reference measurements may not be representative of the ground truth inflammatory status, particularly as some disagreement was seen between these two variables. Furthermore, optical imaging is known to be highly sensitive to pathophysiological changes, so further investigation will be required to ascertain whether false positives are a result of noise, for example, excessive wrinkles in the finger, or truly reflect underlying inflammation which remains undetected by US or CE. The additional inclusion of MRI measurements would be useful further validation in this regard. In addition, the small number of patients together with a low prevalence of inflammation (13.9% and 16.7% for US and CE, respectively) means it will be important to assess the generalization of these accuracies in future work, using a larger patient cohort and testing different machine learning classification schemes such as those presented previously.10,12
Acknowledgments
This work has been funded by EPSRC through a studentship from the Sci-Phy-4-Health Centre for Doctoral Training (EP/L016346/1). DL would like to thank Iain Styles for his comments on the manuscript.
Biographies
Daniel Lighter is a PhD student at the University of Birmingham. He received his MSci degree in mathematics and physics from the University of Bristol in 2010 and his MSc degree in physical science for health from the University of Birmingham in 2015. He is the author of a journal paper and several conference proceedings. His current research interests include diffuse optical tomography, near-infrared spectroscopy, and rheumatoid arthritis. He is a member of SPIE.
Andrew Filer graduated from Medical School at the University of Birmingham in 1995, working in Birmingham at first, then in Australia before returning to take up an MRC clinical training fellowship and gaining his PhD in Birmingham. With Dr. Karim Raza he has run the Birmingham Early Arthritis Clinic for five years, working on novel clinical, serological, and imaging predictors of outcome in the very early window of arthritis. He is an experienced musculoskeletal sonographer, and uses his skills to answer clinical questions, practice a wide variety of imaging guided procedures, and also to investigate the role of musculoskeletal ultrasound as a predictive tool in early arthritis.
Hamid Dehghani received his BSc degree in biomedical and bioelectronic engineering from the University of Salford, Salford, United Kingdom, in 1994, his MSc degree in medical physics and clinical engineering, and his PhD in medical imaging from Sheffield Hallam University, Sheffield, United Kingdom, in 1999. He is currently a professor of medical imaging at the School of Computer Science, University of Birmingham, United Kingdom. His research interests include development of biophotonics-based methods for clinical and preclinical applications.
Disclosures
The authors have no relevant financial interests in the manuscript.
References
- 1.Barrett E., et al. , “The impact of rheumatoid arthritis on employment status in the early years of disease: a UK community-based study,” Rheumatology 39(12), 1403–1409 (2000). 10.1093/rheumatology/39.12.1403 [DOI] [PubMed] [Google Scholar]
- 2.National Audit Office, Services for People with Rheumatoid Arthritis, National Audit Office, Vol. 823, pp. 1–37 (2009). [Google Scholar]
- 3.N. C. C. for Chronic Conditions et al., Rheumatoid Arthritis: National Clinical Guideline for Management and Treatment in Adults, Royal College of Physicians of London; (2009). [PubMed] [Google Scholar]
- 4.van der Linden M. P., et al. , “Long-term impact of delay in assessment of patients with early arthritis,” Arthritis Rheum. 62(12), 3537–3546 (2010). 10.1002/art.27692 [DOI] [PubMed] [Google Scholar]
- 5.Nell V., et al. , “Benefit of very early referral and very early therapy with disease-modifying anti-rheumatic drugs in patients with early rheumatoid arthritis,” Rheumatology 43(7), 906–914 (2004). 10.1093/rheumatology/keh199 [DOI] [PubMed] [Google Scholar]
- 6.Landewé R., et al. , “Cobra combination therapy in patients with early rheumatoid arthritis: long-term structural benefits of a brief intervention,” Arthritis Rheum. 46(2), 347–356 (2002). 10.1002/art.v46:2 [DOI] [PubMed] [Google Scholar]
- 7.Golovko D., et al. , “Optical imaging of rheumatoid arthritis,” Int. J. Clin. Rheumatol. 6(1), 67–75 (2011). 10.2217/ijr.10.105 [DOI] [PMC free article] [PubMed] [Google Scholar]
- 8.Lighter D., et al. , “Multispectral, non-contact diffuse optical tomography of healthy human finger joints,” Biomed. Opt. Express 9(4), 1445–1460 (2018). 10.1364/BOE.9.001445 [DOI] [PMC free article] [PubMed] [Google Scholar]
- 9.Scheel A. K., et al. , “Assessment of proximal finger joint inflammation in patients with rheumatoid arthritis, using a novel laser-based imaging technique,” Arthritis Rheum. 46(5), 1177–1184 (2002). 10.1002/art.10226 [DOI] [PubMed] [Google Scholar]
- 10.Schwaighofe A., et al. , “Classification of rheumatoid joint inflammation based on laser imaging,” IEEE Trans. Biomed. Eng. 50, 375–382 (2003). 10.1109/TBME.2003.808827 [DOI] [PubMed] [Google Scholar]
- 11.Hielscher A. H., et al. , “Frequency-domain optical tomographic imaging of arthritic finger joints,” IEEE Trans. Med. Imaging 30(10), 1725–1736 (2011). 10.1109/TMI.2011.2135374 [DOI] [PubMed] [Google Scholar]
- 12.Montejo L. D., et al. , “Computer-aided diagnosis of rheumatoid arthritis with optical tomography, Part 2: image classification,” J. Biomed. Opt. 18(7), 076002 (2013). 10.1117/1.JBO.18.7.076002 [DOI] [PMC free article] [PubMed] [Google Scholar]
- 13.Ng C., et al. , “Synovial tissue hypoxia and inflammation in vivo,” Ann. Rheum. Dis. 69(7), 1389–1395 (2010). 10.1136/ard.2009.119776 [DOI] [PMC free article] [PubMed] [Google Scholar]
- 14.Falchuk K., Goetzl E., Kulka J., “Respiratory gases of synovial fluids: an approach to synovial tissue circulatory-metabolic imbalance in rheumatoid arthritis,” Am. J. Med. 49(2), 223–231 (1970). 10.1016/S0002-9343(70)80078-X [DOI] [PubMed] [Google Scholar]
- 15.Dahlberg L., et al. , “Proteoglycan fragments in joint fluid: influence of arthrosis and inflammation,” Acta Orthop. Scand. 63(4), 417–423 (1992). 10.3109/17453679209154758 [DOI] [PubMed] [Google Scholar]
- 16.Beuthan J., et al. , “Light scattering study of rheumatoid arthritis,” Quantum Electron. 32(11), 945–952 (2002). 10.1070/QE2002v032n11ABEH002326 [DOI] [Google Scholar]
- 17.Schwaighofer A., et al. , “The RA scanner: prediction of rheumatoid joint inflammation based on laser imaging,” in Adv. Neural Inf. Process. Syst., pp. 1433–1440 (2003). [Google Scholar]
- 18.van Onna M., et al. , “Assessment of disease activity in patients with rheumatoid arthritis using optical spectral transmission measurements, a non-invasive imaging technique,” Ann. Rheum. Dis. 75(3), 511–518 (2016). 10.1136/annrheumdis-2015-207315 [DOI] [PMC free article] [PubMed] [Google Scholar]
- 19.Montejo L. D., et al. , “Computer-aided diagnosis of rheumatoid arthritis with optical tomography, Part 1: feature extraction,” J. Biomed. Opt. 18(7), 076001 (2013). 10.1117/1.JBO.18.7.076001 [DOI] [PMC free article] [PubMed] [Google Scholar]
- 20.Hielscher A. H., et al. , “Sagittal laser optical tomography for imaging of rheumatoid finger joints,” Phys. Med. Biol. 49(7), 1147–1163 (2004). 10.1088/0031-9155/49/7/005 [DOI] [PubMed] [Google Scholar]
- 21.Prapavat V., et al. , “Evaluation of scattered light distributions of CW-transillumination for functional diagnostic of rheumatic disorders in interphalangeal joints,” in BiOS Europe’95, International Society for Optics and Photonics, pp. 121–129 (1995). [Google Scholar]
- 22.Prapavat V., et al. , “Evaluation of early rheumatic disorders in pip joints using a cw-transillumination method: first clinical results,” in BiOS Europe’97, International Society for Optics and Photonics, pp. 71–78 (1998). [Google Scholar]
- 23.Scheel A. K., et al. , “Laser imaging techniques for follow-up analysis of joint inflammation in patients with rheumatoid arthritis,” Med. Laser Appl. 18(3), 198–205 (2003). 10.1078/1615-1615-00103 [DOI] [Google Scholar]
- 24.Brown A., et al. , “An explanation for the apparent dissociation between clinical remission and continued structural deterioration in rheumatoid arthritis,” Arthritis Rheum. 58(10), 2958–2967 (2008). 10.1002/art.v58:10 [DOI] [PubMed] [Google Scholar]
- 25.Foltz V., et al. , “Power Doppler ultrasound, but not low-field magnetic resonance imaging, predicts relapse and radiographic disease progression in rheumatoid arthritis patients with low levels of disease activity,” Arthritis Rheum. 64(1), 67–76 (2012). 10.1002/art.33312 [DOI] [PubMed] [Google Scholar]
- 26.Szkudlarek M., et al. , “Power Doppler ultrasonography for assessment of synovitis in the metacarpophalangeal joints of patients with rheumatoid arthritis: a comparison with dynamic magnetic resonance imaging,” Arthritis Rheum. 44(9), 2018–2023 (2001). 10.1002/(ISSN)1529-0131 [DOI] [PubMed] [Google Scholar]
- 27.Filer A., et al. , “Utility of ultrasound joint counts in the prediction of rheumatoid arthritis in patients with very early synovitis,” Ann. Rheum. Dis. 70(3), 500–507 (2011). 10.1136/ard.2010.131573 [DOI] [PMC free article] [PubMed] [Google Scholar]
- 28.D’Agostino M.-A., et al. , “Scoring ultrasound synovitis in rheumatoid arthritis: a EULAR-OMERACT ultrasound taskforce-part 1: definition and development of a standardised, consensus-based scoring system,” RMD Open 3(1), e000428 (2017). 10.1136/rmdopen-2016-000428 [DOI] [PMC free article] [PubMed] [Google Scholar]
- 29.Seymour M. W., et al. , “Ultrasound of metacarpophalangeal joints is a sensitive and reliable endpoint for drug therapies in rheumatoid arthritis: results of a randomized, two-center placebo-controlled study,” Arthritis Res. Therapy 14(5), R198 (2012). 10.1186/ar4034 [DOI] [PMC free article] [PubMed] [Google Scholar]
- 30.Witt M. N., et al. , “Ultrasound of synovitis in rheumatoid arthritis: advantages of the dorsal over the palmar approach to finger joints,” J. Rheumatol. 41(3), 422–428 (2014). 10.3899/jrheum.131027 [DOI] [PubMed] [Google Scholar]
- 31.Mohajerani P., et al. , “Fluorescence-aided tomographic imaging of synovitis in the human finger,” Radiology 272(3), 865–874 (2014). 10.1148/radiol.14132128 [DOI] [PubMed] [Google Scholar]
- 32.Montejo L. D., et al. , “Evaluation of Fourier transform coefficients for the diagnosis of rheumatoid arthritis from diffuse optical tomography images,” Proc. SPIE 8578, 85781N (2013). 10.1117/12.2004846 [DOI] [Google Scholar]
- 33.Kay J., Upchurch K. S., “ACR/EULAR 2010 rheumatoid arthritis classification criteria,” Rheumatology 51, vi5–vi9 (2012). 10.1093/rheumatology/kes279 [DOI] [PubMed] [Google Scholar]
- 34.Terslev L., et al. , “Scoring ultrasound synovitis in rheumatoid arthritis: a EULAR-OMERACT ultrasound taskforce-part 2: reliability and application to multiple joints of a standardised consensus-based scoring system,” RMD Open 3(1), e000427 (2017). 10.1136/rmdopen-2016-000427 [DOI] [PMC free article] [PubMed] [Google Scholar]
- 35.Alexandrakis G., Rannou F. R., Chatziioannou A. F., “Tomographic bioluminescence imaging by use of a combined optical-PET (OPET) system: a computer simulation feasibility study,” Phys. Med. Biol. 50(17), 4225–4241 (2005). 10.1088/0031-9155/50/17/021 [DOI] [PMC free article] [PubMed] [Google Scholar]
- 36.Yuan Z., et al. , “Image-guided optical spectroscopy in diagnosis of osteoarthritis: a clinical study,” Biomed. Opt. Express 1(1), 74–86 (2010). 10.1364/BOE.1.000074 [DOI] [PMC free article] [PubMed] [Google Scholar]
- 37.Dehghani H., et al. , “Near infrared optical tomography using NIRFAST: algorithm for numerical model and image reconstruction,” Commun. Numer. Methods Eng. 25(6), 711–732 (2009). 10.1002/cnm.v25:6 [DOI] [PMC free article] [PubMed] [Google Scholar]
- 38.Østergaard M., et al. , “OMERACT rheumatoid arthritis magnetic resonance imaging studies. Core set of MRI acquisitions, joint pathology definitions, and the OMERACT RA-MRI scoring system,” J. Rheumatol. 30(6), 1385–1386 (2003). [PubMed] [Google Scholar]
- 39.Glinton S., Naylor A. J., Claridge E., “Diagnosing hypoxia in murine models of rheumatoid arthritis from reflectance multispectral images,” in Eur. Conf. Biomed. Opt., Optical Society of America, p. 1041109 (2017). [Google Scholar]
- 40.Beuthan J., et al. , “Diagnosis of inflammatory rheumatic diseases with photon density waves,” in Photonics West’96, International Society for Optics and Photonics, pp. 43–53 (1996). [Google Scholar]
- 41.Wakefield R., et al. , “Should oligoarthritis be reclassified? Ultrasound reveals a high prevalence of subclinical disease,” Ann. Rheum. Dis. 63(4), 382–385 (2004). 10.1136/ard.2003.007062 [DOI] [PMC free article] [PubMed] [Google Scholar]
- 42.Scheel A. K., et al. , “Prospective 7 year follow up imaging study comparing radiography, ultrasonography, and magnetic resonance imaging in rheumatoid arthritis finger joints,” Ann. Rheum. Dis. 65(5), 595–600 (2006). 10.1136/ard.2005.041814 [DOI] [PMC free article] [PubMed] [Google Scholar]
- 43.Naredo E., et al. , “Assessment of inflammatory activity in rheumatoid arthritis: a comparative study of clinical evaluation with grey scale and power Doppler ultrasonography,” Ann. Rheum. Dis. 64(3), 375–381 (2005). 10.1136/ard.2004.023929 [DOI] [PMC free article] [PubMed] [Google Scholar]


