Abstract
Primary hyperoxalurias (PH) are inborn errors of glyoxylate metabolism characterized by an increase in endogenous oxalate production. Oxalate overproduction may cause calcium-oxalate crystal formation leading to kidney stones, nephrocalcinosis, and ultimately kidney failure. Twenty-four hour urine oxalate excretion is an inaccurate measure for endogenous oxalate production in PH patients and not applicable in those with kidney failure. Treatment efficacy cannot be assessed with this measure during clinical trials. We describe the development and validation of a gas chromatography–tandem mass spectrometry method to analyze the samples obtained following a stable isotope infusion protocol of 13C2-oxalate and 1-13C-glycolate in both healthy individuals and PH patients. Isotopic enrichments of plasma oxalate, glycolate, and glyoxylate were measured on a gas chromatography–triple quadrupole mass spectrometry system using ethylhydroxylamine and N-tert-butyldimethylsilyl-N-methyltrifluoroacetamide (MTBSTFA) for analyte derivatization. Method precision was good for oxalate and glycolate (coefficients of variation [CV] were <6.3% and <4.2% for inter- and intraday precision, respectively) and acceptable for glyoxylate (CV <18.3% and <6.7% for inter- and intraday precision, respectively). The enrichment curves were linear over the specified range. Sensitivity was sufficient to accurately analyze enrichments. This new method allowed calculation of kinetic features of these metabolites, thus enabling a detailed analysis of the various pathways involved in glyoxylate metabolism. The method will further enhance the investigation of the metabolic PH derangements, provides a tool to accurately assess the therapeutic efficacy of new promising therapeutic interventions for PH, and could serve as a clinical tool to improve personalized therapeutic strategies.
Primary hyperoxalurias (PH) are rare inborn errors of glyoxylate metabolism characterized by increased endogenous oxalate production. In PH type 1, which is the most common form of PH, the liver-specific enzyme alanine:glyoxlyate aminotransferase (AGT) either malfunctions or is deficient. This results in the inability to form glycine from glyoxylate, which causes the body to produce increased levels of the metabolic end product, oxalate. Oxalate is duly excreted by the kidneys, but increased urinary oxalate levels will cause nephrocalcinosis, urolithiasis, and ultimately renal failure. Once renal function starts to decrease, blood oxalate levels increase, and calcium-oxalate crystals are deposited throughout the body. Accumulation of oxalate crystals in various tissues causes widespread damage and organ dysfunction, most notably in the bones, eyes, and heart, a condition referred to as systemic oxalosis.
Until now, oxalate production could only be assessed by means of urinary oxalate excretion rates. It is well-known that the daily urinary oxalate excretion may vary up to 36% within PH patients.1 Furthermore, 24-h urine collections are cumbersome and fraught by collection inaccuracies. Once calcium-oxalate crystals have accumulated in various bodily tissues, hyperoxaluria may persist for years despite the fact that the primary metabolic defect may have been corrected following liver transplantation.2,3 Even though the enzyme function may have been restored, remobilization of stored oxalate from bone and other tissues contributes to the appearance of oxalate in plasma and thus in urine.
Despite many decades of research into the metabolic pathways involved in oxalate synthesis, uncertainties still remain regarding the metabolic alterations of the various PH subtypes. Also, at this moment, new therapeutic modalities for PH are under investigation.4,5 Measuring the various pathways involved in glyoxylate metabolism and oxalate production would allow for the reliable and fast assessment of the therapeutic effects of various new drugs. Accurate measurements would also enhance the understanding of the affected PH-associated metabolic pathways and metabolites, possibly yielding new therapeutic interventions or drug targets.
Stable isotopes provide an ideal instrument for the analysis of deranged metabolic processes and have found widespread application in the study of inborn metabolic diseases.6
Previously, hyperoxaluria metabolism has been studied using both radioactive7 and stable isotopes.8−11 In most of these studies, isotopic enrichment was determined in urine metabolites following intravenous (iv) administration of tracer,7,9−11 which only allows for the assessment of the relative contribution of the injected tracer to the measured urinary compound. Huidekoper et al. were the first to directly measure endogenous oxalate production rates by applying a primed continuous infusion protocol of 13C2-oxalate and measuring tracer enrichments in plasma.8 However, doubts have risen about stable isotopic dosing and analytical methods used in this study. For instance, a stable isotopic plateau was not attained in all PH patients, and the rate of appearance of oxalate was higher than expected and did not match 24-h oxalate excretion rates in the healthy volunteers. The isotope infusion protocol was revised and upgraded by the concurrent administration of 1-13C-glycolate with 13C2-oxalate. Figure 1 gives a schematic representation of the glycolate/glyoxalate/oxalate metabolism, shown with the different isotopic labels used during this study, in which both healthy volunteers and PH1 patients received a primed, continuous infusion of 13C2-oxalate and 1-13C-glycolate. Total oxalate and glycolate production rates were determined by primed, continuous infusion of 13C2-oxalate and 1-13C-glycolate, respectively. The 1-13C-glycolate tracer can be metabolized into 1-13C-glyoxylate, 1-13C-oxalate, and 1-13C-glycine. In addition to the absolute oxalate and glycolate production rates, this protocol also provides information on the relative contributions to the production rates of the conversion of glycolate into oxalate, glyoxylate, and glycine. This outcome would provide important information for future drug trials since these specific contributions are hypothesized to be altered when AGT function is restored in PH type 1 patients.
Figure 1.
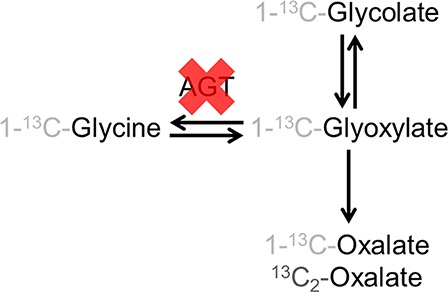
Schematic representation of the glycolate-oxalate metabolic pathway. Only the metabolites of interest to this study are represented. The expected isotopomers are shown. The red cross shows which enzymatic conversion is affected in primary hyperoxaluria type 1 (PH1) patients. (AGT, alanine:glyoxlyate aminotransferase).
Our paper describes a newly developed and validated analysis method for the measurement of 1-13C-glyoxylate, 1-13C-glycolate, 1-13C-oxalate, and 13C2-oxalate isotopic enrichment. 1-13C-Glycine enrichment for the isotope infusion protocol was analyzed using a previously developed method.12−14 For glyoxylate, glycolate, and oxalate, several different derivatization techniques and sample preparation methods were investigated. Most of the candidate reagents showed insufficient sensitivity for providing an accurate analysis in plasma, or these three compounds could not be concurrently derivatized. Furthermore, during the optimization process, various candidate chemical reagents used for sample preparation were found to contain traces of the compounds to be measured. We developed a new sample preparation method by combining sample cleanup and two derivatization steps, and a new method for gas chromatography–tandem mass spectrometry (GC–MS/MS) operated in a multiple reaction monitoring (MRM) mode. Using this method, we were able to analyze samples obtained with the new stable isotope infusion procedure.
Materials and Methods
Reagents
Hydrochloric acid (37%, Merck, Germany), o-ethylhydroxylamine hydrochloride (Aldrich, Germany), double distilled water (Elga, U.K.), sodium chloride (Merck, Germany), ethyl acetate for GC–MS Suprasolv (Millipore, Germany), N-tert-butyldimethylsilyl-N-methyltrifluoroacetamide (MTBSTFA) (Aldrich, Germany), acetonitrile LC–MS grade (Biosolve, The Netherlands), 13C2-oxalate, and 1-13C-glycolate (Cambridge Isotope Laboratories, Inc., U.S.A.) were purchased from various sources and used in the experiments.
Infusion Protocol
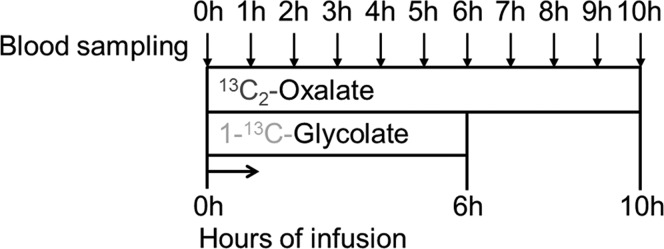
Both normal healthy volunteers and PH type 1 patients were studied. Two IV catheters were inserted into the antecubital vein, one in each arm. One catheter was used to administer the primed continuous infusions and the other for blood sampling. A baseline blood sample was collected for background enrichment of oxalate, glycine, glyoxylate, and glycolate in plasma. Primed continuous (prime/hourly dose) 13C2-oxalate and 1-13C-glycolate infusions were then started. Blood samples were drawn hourly, and plasma samples were collected into ice-cooled heparin tubes and centrifuged within 30 min of collection for 10 min at 1700g and 4 °C. Two-hundred microliters of plasma were transferred into 2 mL glass screw capped vials, and 30 μL of concentrated HCl (37%) was added and mixed using a vortex. Immediate acidification after withdrawal prevents in vitro formation of oxalate from ascorbic acid.15 The 1-13C-glycolate tracer was infused for 6 h, whereas the 13C2-oxalate tracer infusion lasted 10 h (Figure 2). The study protocol was approved by the ethical committee of the Amsterdam University Medical Center, location AMC.
Figure 2.
Schematic representation of the infusion protocol. Following baseline sampling, a priming dose (1 h dose) is followed by continuous tracer infusion. Blood was sampled hourly. 1-13C-glycolate was infused for 6 h and 13C2-oxalate for 10 h.
Standard Preparation
Stock solutions of oxalate, glycolate, glyoxylate, and 13C2-glyoxylate were prepared and stored at −20 °C. For 13C2-oxalate and 1-13C-glycolate, the infusion solutions were used as stock solutions. Unfortunately, 1-13C-glyoxylate was not commercially available, so 13C2-glyoxylate was used to prepare the calibration curve and control samples. Corrections were made where necessary for calculations with this isotopomer.
A calibration curve was prepared by adding a fixed amount of a mixture of the unlabeled standards to different levels of labeled standards to achieve adequate enrichment levels for this study (ranging from 0% to about 27% tracer-to-tracee ratio [TTR]).
Control Samples
Portions of pooled plasma were spiked with 13C2-oxalate, 1-13C-glycolate, and 13C2-glyoxylate for validation purposes and for monitoring accuracy and precision during the analysis of the study samples. Purposefully, we used pooled plasma that had not been treated with HCl to prevent in vitro oxalogenesis. As a consequence, oxalate and glycolate concentrations present in these pooled plasma samples were inbetween the concentration ranges for healthy volunteers and PH1 patients.
Sample Preparation Protocol
Directly before analysis, samples were thawed. To 200 μL aliquots of calibration curve standards and control samples, 30 μL of 12 M HCl was added. Fifty microliters of a 100 mg/mL ethoxyamine solution in water and an additional 100 μL of water were added to all samples, including standard and control samples. The mixture was incubated at 80 °C for 30 min. After cooling, 50 μL of an NaCl solution (saturated in water) was added. One milliliter of ethyl acetate was added, and samples were then vortexed and centrifuged for 5 min at 3000g. The top layer was transferred into a clean gas chromatography (GC) vial. This extraction step was repeated once, and the top layers from both extractions were combined. The ethyl acetate was evaporated under a gentle stream of nitrogen at 30 °C. Twenty-five microliters of MTBSTFA and 25 μL acetonitrile were added, and the mixture was incubated for 30 min at 80 °C. After cooling, the samples were transferred into inserts, and immediately analyzed by GC–MS/MS.
GC–MS/MS
A 7890A GC, equipped with a 7693 auto sampler coupled to a 7000 Triple Quadrupole Mass Spectrometer (Agilent Technologies, U.S.A.), was used to perform all analyses. The GC was equipped with a Dean’s switch to reduce contamination of the source by sending the effluent prior to and after elution of peaks of interest to the waste. Samples were introduced through a temperature-programmed multimode inlet. The GC was fitted with a VF17 ms column (30 m, 0.25 mm, 0.25 μm). Through the Dean’s switch, the flow was either directed to the mass spectrometer (uncoated fused silica capillary, 1.8 m, 0.180 mm) or to waste (uncoated fused silica capillary, 1.3 m, 0.180 mm). Helium was used as a carrier gas at a flow rate of 1.2 mL/min. One microliter of sample was injected per run, and each sample was analyzed in triplicate. The initial oven temperature was 55 °C for 1 min. The temperature was then increased by 30 °C/min to 115 °C and held constant for 5 min. It was then increased by 5 °C/min to 160 °C followed by an increase in temperature of 30 °C/min to 300 °C, and held constant for 5 min. The run time was 26.67 min. The system was operated in the MRM mode while recording the effluent from 9 to 20 min. The precursor ions were selected with normal resolution (target peak width of 0.7), and the product ions were selected at a narrower resolution (0.45) to prevent a contribution from the neighboring m/z value to the m/z value of interest. All transitions were recorded with a gain factor of 10. The MRM settings are shown in Table 1. The ion source installed was an Electron ionization Extractor Ion Source, operated at 230 °C and 70 eV. The collision gas was N2 6.0 at a flow rate of 1.5 mL/min. The transfer line temperature was kept at 280 °C, the temperatures of quadrupoles 1 and 2 were kept at 150 °C. The acquisition software for operating the GC–MS/MS was MassHunter GC/MS Acquisition B.07.06.2704. The results obtained with our new analysis method were expressed as tracer-to-tracee ratio [TTR] enrichment and were used for calculations of synthesis rates.
Table 1. Mass Spectrometry Conditions, Multiple Reaction Monitoring (MRM) Settings (MW, Molecular Weight; m/z, Mass to Charge Ratio; ms, Millisecond; V, Volt).
| compound | time window (min) | isotope | MW derivate | precursor ion (m/z) | product ion (m/z) | dwell time (ms) | collision energy (V) |
|---|---|---|---|---|---|---|---|
| glyoxylate | 9–13 | M | 231 | 174.1 | 146 | 50 | 5 |
| M+1 | 232 | 175.1 | 147 | 50 | 5 | ||
| M+2 | 233 | 176.1 | 148 | 50 | 5 | ||
| glycolate | 13–16 | M | 304 | 247.1 | 73 | 50 | 10 |
| M+1 | 305 | 248.1 | 73 | 50 | 10 | ||
| oxalate | 16–20 | M | 318 | 261.2 | 147 | 50 | 10 |
| M+1 | 319 | 262.2 | 147 | 50 | 10 | ||
| M+2 | 320 | 263.2 | 147 | 50 | 10 |
Method Validation
The precision was established by repeatedly analyzing control samples at two different enrichment levels. The interday precision was determined by analysis of three replicates (including preparation and triplicate analysis) of the control samples on five different days. The intraday precision was determined by analysis of eight replicates on a single day. We prespecified the maximum allowable coefficient of variation (CV) as <10% and <15% for intra- and interday precision, respectively. Due to the low concentrations of glyoxylic acid in the samples, we allowed the maximum variation coefficient to be slightly higher (<15% and <20% for intra- and interday precision, respectively).
Linearity was determined by repeated analysis of the calibration curves. The integrated peak area for the tracer was divided by the peak area for the tracee to obtain the experimental TTR. This was plotted against the theoretical TTR% to obtain a calibration curve. The R2 value of the regression analysis over the linear range of this curve should be >0.99 for all compounds, and the slope of this curve should be around 0.01 ± 20%, which would provide confirmation that the experimental TTR is in agreement with the theoretical TTR% value. By definition, the upper and lower limits of quantification were determined and defined by the domain of linearity of the enrichment curve and the linear dynamic range of the instrument. The minimum signal should be >10 S/N, which is the lower limit of quantification.
Data Analysis
Integration of the peak area was performed using Mass Hunter Quantitative Analysis software version B.08.00 (Agilent, U.S.A.). Further calculations were performed using Excel 2016 (Microsoft Corporation, U.S.A.). The slope and intercept of the enrichment curves (experimental TTR versus theoretical TTR%) were determined by linear regression analysis.
Results
The high and low control samples were spiked at 2.7 and 0.6 TTR% for glyoxylate, 8.6 and 1.3 TTR% for glycolate, and 7.9 and 1.4 for oxalate. Table 2 presents detailed information regarding precision assessments. For glycolate, the intra- and interday precision CVs were <2.4% and <2.2%, respectively. For oxalate, the intra-and interday precision CVs were <4.2% and <6.3%, respectively. As expected, the variation for glyoxylate enrichments was larger than that observed for oxalate and glycolate (intra- and interday precision CVs <6.7% and <18.3%, respectively) due to the low concentration of glyoxylate in plasma. The criteria for maximum allowable coefficients of variation as described in the Materials and Methods section were fulfilled.
Table 2. Intra- and Inter-Day Precision of the Compounds, Analyzed by the Gas Chromatography–Tandem Mass Spectrometry Method (GC–MS/MS) Method in the MRM Mode (CV, Coefficient of Variation; enr, Enrichment).
| glyoxylate | glycolate | oxalate | |
|---|---|---|---|
| intraday precision (CV%) control sample low enr. | 4.9 | 2.0 | 4.2 |
| interday precision (CV%) control sample low enr. | 13.5 | 1.6 | 6.3 |
| intraday precision (CV%) control sample high enr. | 6.7 | 2.4 | 1.1 |
| interday precision (CV%) control sample high enr. | 18.3 | 2.2 | 0.7 |
Linearity was tested by repeated analysis of the calibration curves and complied with the validation criteria described in the Materials and Methods section. The R2 value of the enrichment curve over the range analyzed during the experiments was always >0.99 for all compounds. The slope of the curve for all compounds was close to the theoretical value of 0.01 and within the predefined maximum allowable deviation (average slope of curves, derivatized and analyzed on five different days: glyoxylate 0.0114, glycolate 0.0119, and oxalate 0.0110). An example of a calibration curve for the enrichment of 13C2-oxalate is shown in Figure 3.
Figure 3.
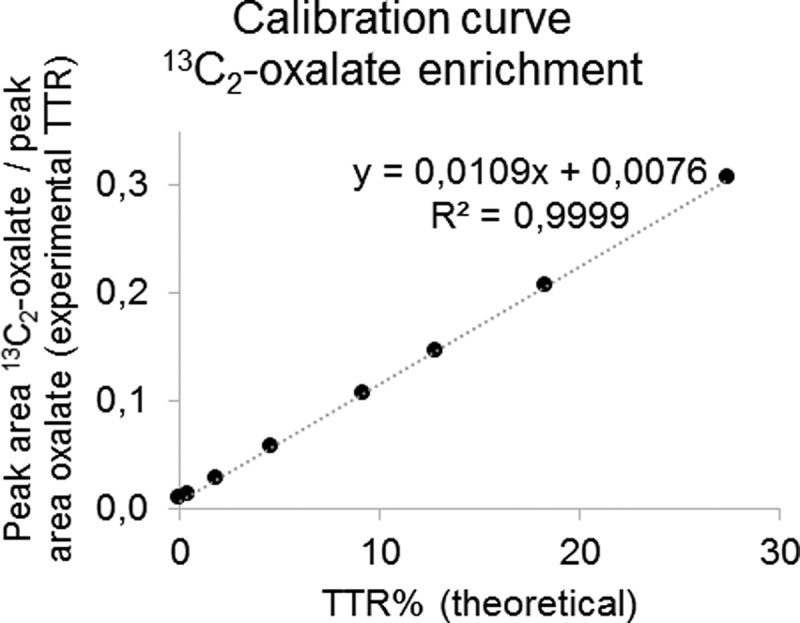
Example of a calibration curve for the enrichment of 13C2-oxalate. The integrated peak area for 13C2-oxalate was divided by the peak area for unlabeled oxalate for the calibration standards to obtain the experimental tracer to tracee ratio (TTR). These results are plotted against the theoretical TTR% of the standards. The theoretical value of the slope is 0.01.
The upper and lower limits of quantification were defined by the domain of linearity of the enrichment curve (0% to about 27% TTR) and the linear dynamic range of the instrument. Peaks observed in calibration standards, control samples, and samples for both healthy volunteers and PH patients always exceeded the lower limit of quantification (10 S/N). No samples were observed to have peak area exceeding the linear dynamic range of the instrument.
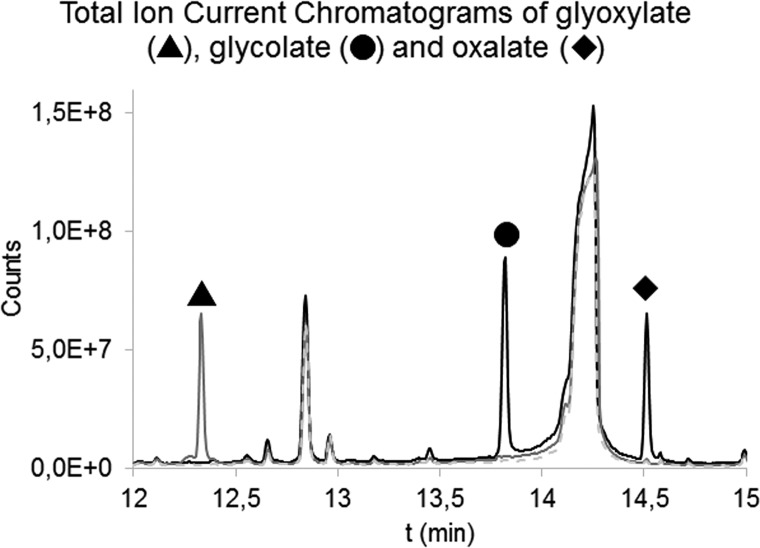
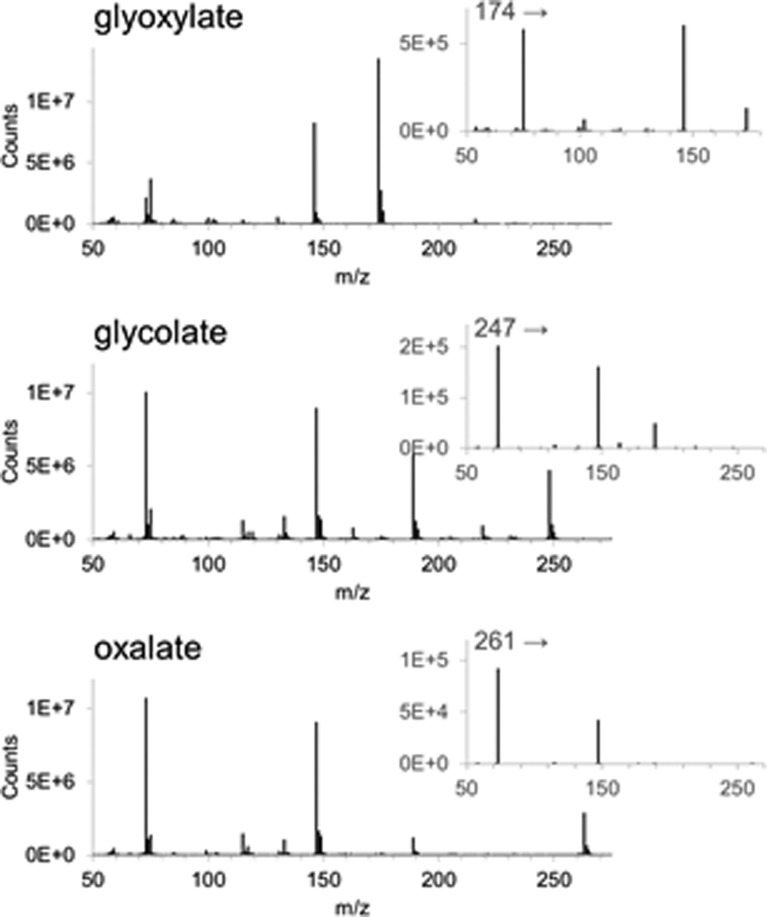
Specificity and selectivity were achieved by adequate separation of the peaks by GC (Figure 4) and choosing MRM transitions specific for the derivatized compounds. Figure 5 shows the mass spectra for the three compounds. The stability of derivatized plasma samples was determined over a relevant time frame (48 h) and showed no significant decline in signal during the measurement period.
Figure 4.
Overlay of Total Ion Current Chromatograms recorded in full scan of the ethylhydroxylamine- N-tert-butyldimethylsilyl-N-methyltrifluoroacetamide (MTBSTFA)-derivatized glyoxylate (in gray, solid line), MTBSTFA-derivatized glycolate and MTBSTFA-derivatized oxalate (in black) and a reagent blank (in gray, dashed line). Glycolate and oxalate did not react with ethylhydroxylamine, and their derivatization with MTBSTFA was not affected by the additional reaction needed for derivatization of glyoxylate. Other peaks present in this chromatogram were attributed to reagent peaks.
Figure 5.
Mass spectra and product scans of the derivatized compounds: Glyoxylate was derivatized with both ethylhydroxylamine and MTBSTFA and glycolate and oxalate with MTBSTFA (both compounds did not react with ethylhydroxylamine). For glycolate and oxalate, isotopic labeled positions were lost during fragmentation, only peaks attributed to the derivatizing agent were present in the product scan.
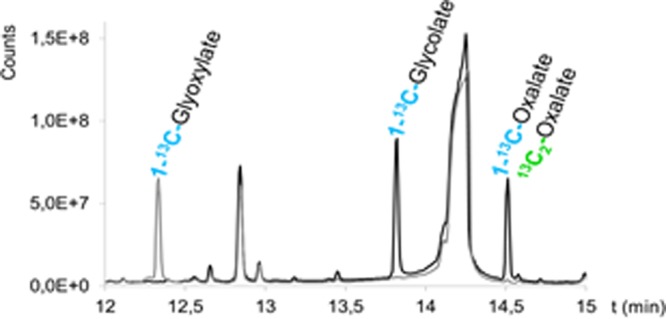
Enrichment results analyzed in samples obtained during the stable isotope infusion protocol are shown in Figure 6. For 5 PH type 1 patients enrolled in the study, the average enrichments during steady state were 68.8 TTR% for 1-13C-glycolate, 2.3 TTR% for 1-13C-glyoxylate, 31.1 TTR% for 1-13C-oxalate, and 26.1 TTR% for 13C2-oxalate. The average results for 5 normal healthy volunteers were 27.7 TTR% for 1-13C-glycolate, 0.4 TTR% for 1-13C-glyoxylate, 0.4 TTR% for 1-13C-oxalate, and 10.8 TTR% for 13C2-oxalate. Steady state was achieved from 4 to 6 h after start of the primed continuous infusion for 1-13C-glycolate. For 13C2-oxalate, this was from 6 to 10 h after start of the infusion.
Figure 6.
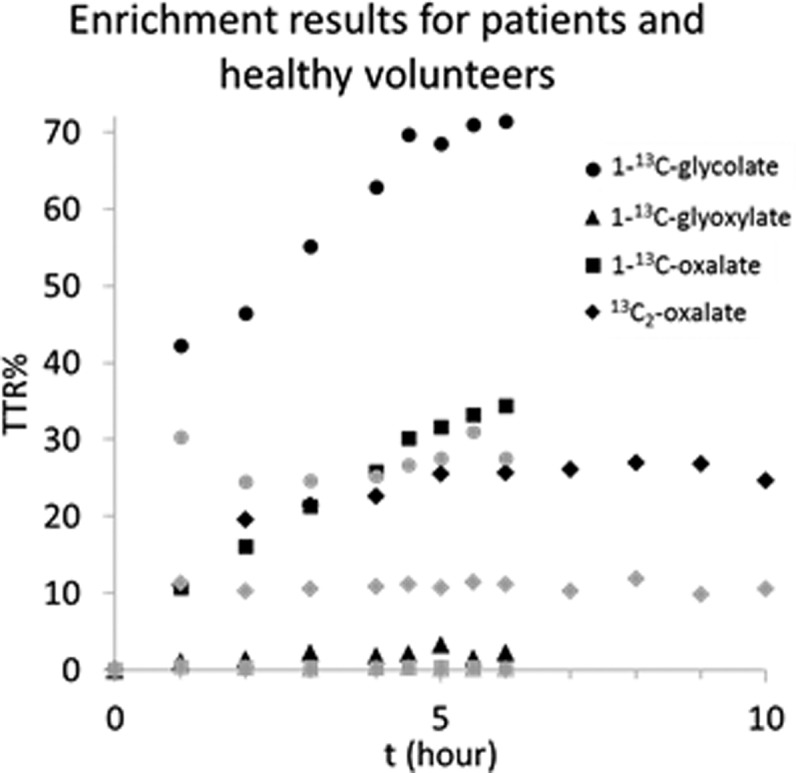
Enrichment results analyzed in samples obtained during the stable isotope infusion protocol. Per time point, the results of 5 PH type 1 patients (in black) or healthy volunteers (in gray) were averaged.
Discussion
We describe the development and validation of a new analysis method for the measurement of plasma isotopic enrichments following the administration of multiple tracers to study glyoxylate metabolism.
In a previous pilot study, Huidekoper et al. applied a stable isotope procedure similar to the one presented in this work.8 Endogenous oxalate production was determined by infusion of stable isotope labeled 13C2-oxalate. However, in hindsight, the infusion procedure and analytical method may have been inaccurate. The rate of appearance of oxalate was higher than expected in the healthy volunteer group, and this overestimation could be attributed to several causes. First, the infusion protocol yielded low oxalate enrichments in this group, making enrichment measurements subject to imprecisions inherent in the method. In our new protocol, a higher infusion rate was administered for healthy volunteers, leading to higher plasma enrichment and thus to more accurate measurements. Second, insufficient precautions may have been taken to prevent in vitro oxalogenesis. If plasma is not acidified directly after withdrawal, then oxalate will form during storage even when stored at −20 °C or −70 °C.16,17 Ascorbic acid is the main source of in vitro oxalogenesis, and glyoxylate does not contribute significantly.17,18 In the healthy volunteer group with lower plasma oxalate concentrations, especially, this in vitro oxalogenesis could make a relatively large contribution to the observed plasma oxalate concentration, leading to a larger bias in the observed enrichment (which will appear to be lower). By adding HCl directly after blood withdrawal, in vitro oxalogenesis can be prevented.15 Third, we extended the infusion protocol from 8 to 10 h to ensure achievement of an isotopic plateau in the PH patients. Further improvement of the protocol from the pilot study was achieved by concurrent administration of both 1-13C-glycolate and 13C2-oxalate, which gives additional insights into the fluxes involved in the glyoxylate metabolism.
In order to analyze the samples obtained with the improved isotope infusion protocol, we aimed to develop and validate a sensitive and accurate GC–MS/MS method by combining the enrichment analysis of oxalate, glyoxylate, and glycolate into one single analysis. As the new analytical method was developed to analyze enrichments of oxalate and glycolate in PH1 patients in addition to healthy volunteers, sufficient sensitivity was needed to determine these compounds in healthy volunteers (with low plasma concentrations).
Our sample work up required a combination of sample cleanup and two consecutive derivatization reactions with ethylhydroxylamine and MTBSTFA for sufficient sensitivity and accuracy. Measurements of plasma oxalate, glycolate, and glyoxylate enrichment were performed on a mass spectrometer operated in MRM mode to improve the performance of the analysis. The signal-to-noise ratio was increased by MRM as opposed to the single ion monitoring (SIM) mode, which aids in accurate quantitation, especially for compounds with low abundance. Preferably, the isotope labels are present in both the precursor and the product ion of the MRM transition. For glyoxylate, this was the case. The mass difference between the precursor and the product could be explained by the loss of the ethyl group added during the reaction with ethylhydroxylamine. Unfortunately, for both oxalate and glycolate, all isotope-labeled positions were lost during fragmentation. However, typical MTBSTFA fragments (m/z 189, 147, and 73)19 are present after fragmentation. Choosing either of these as a product ion in an MRM transition improved the signal-to-noise ratio for these compounds in comparison to SIM analysis. For oxalate, m/z 147 as product ion resulted in the highest signal-to-noise ratio for the M+2 isotope, whereas for glycolate, m/z 73 as the product ion resulted in the highest signal-to-noise ratio for the M+1 isotope. The collision energies were optimized to obtain the highest signal.
The applied method yielded good precision as assessed by the inter- and intraday CVs for oxalate and glycolate enrichments and acceptable precision for glyoxylate (as shown in Table 2). The sensitivity was sufficient to analyze accurate enrichments of the selected compounds, allowing for the calculation of endogenous production rates of oxalate and glycolate and the relative contribution of glycolate to glycine, glyoxylate, and oxalate production rates.
Sensitivity was the major challenge during the development of the new analytical method. Numerous derivatives were investigated, but only MTBSTFA provided satisfactory results for further development and optimization of the method. Several derivatization reagents were tested in our quest to find an optimal GC–MS/MS method. N,O-Bis(trimethylsilyl)-trifluoroacetamide (BSTFA) derivatization has previously been used for the concurrent analysis of oxalate and glycolate,20,21 however, we tested MTBSTFA as a derivatization reagent,22,23 as it generally results in higher analytical responses than BSTFA.19 MTBSTFA did indeed show the highest analytical response of all of the tested reagents. However, the procedure suffered from contamination during several steps in the derivatization procedure.
Other considered procedures were derivatization with isobutyl chloroformate.24,25 This method was not sensitive enough, especially for analysis of oxalate at the expected concentration in plasma from healthy volunteers. Ethyl chloroformate derivatization26,27 showed no peaks for oxalate, and multiple peaks for glycolate.28,29 Derivatization with both benzyl alcohol30 and methanolic HCl31 were not sensitive enough for accurate measurement at the expected plasma concentrations. o-Phenylenediamine32 can be used in combination with MTBSTFA and undergoes an additional reaction with oxalate. However, the isotope pattern observed in the mass spectrum for glyoxylate showed interfering peaks. After derivatization with o-phenylenediamine in combination with acetylation, no peak for oxalic acid was observed. Both iso- and n-propanol derivatization16,33−36 showed unexplained spectra for the isotope labeled compounds of interest.
The common denominator for rejection of these derivatives was the lack of sufficient sensitivity. The concentration of the analytes to be measured was very low in plasma, especially for healthy volunteers. The difficulty of finding a suitable derivatization reagent with enough analytical response for our compounds of interest when using GC–MS with an electron ionization ion source could be explained by the small molecular sizes of oxalate, glycolate, and glyoxylate. Typically, extensive fragmentation occurs with electron ionization, and due to the small molecular size of the compounds of interest, the use of many of the investigated derivatization reagents can result in small unspecific mass fragments. These unspecific fragments can lead to sensitivity and specificity issues. Moreover, with GC–MS/MS there is an additional fragmentation step, creating even smaller fragments. It was found to be particularly challenging when trying to obtain a favorable mass spectrum with high abundant and specific mass fragments for all three compounds of interest in one single analysis. Therefore, our requirement to concurrently determine glycolate, oxalate, and glyoxylate in one single analysis was in some cases also the reason to reject a potential candidate reagent for derivatization.
Of the tested reagents, only derivatization with MTBSTFA led to suitable mass fragmentation spectra for all compounds (Figure 5) with its characteristic high abundant M-57 peak.19 This peak was selected as the precursor ion in the MRM analysis for each of the compounds (Table 1). However, due to contamination problems in this derivatization protocol, optimization of the sample preparation procedure was needed to reduce contamination to a minimum. Both ethyl acetate (used for liquid–liquid extraction) and MTBSTFA turned out to be especially important sources of contamination as they contained both oxalate and glycolate. Chemicals obtained from several suppliers and of higher purity grades were evaluated for impurities. Combining the cleanest available chemicals with a reduction in the volume of ethyl acetate during liquid–liquid extraction and reducing the volume of MTBSTFA by adding acetonitrile during the derivatization, we managed to significantly reduce contamination. In the present study, the contribution of the reagents to the unlabeled signal was calculated to be <5% for healthy volunteers. We found this to be acceptable because this fell within the range of typical biological variations. For PH patients, the relative contribution to the signal was negligible.
With MTBSTFA derivatization alone, glyoxylate cannot be observed by GC–MS. Addition of a derivatization step with ethylhydroxylamine to the MTBSTFA protocol made it possible to also analyze glyoxylate in the same analytical procedure without negatively affecting oxalate and glycolate results. Both derivatization of hydroxylamine and ethylhydroxylamine were successful, but the elution window of the derivate after reaction with ethylhydroxylamine was more favorable than that obtained by hydroxylamine. Ethylhydroxylamine was tested with both water and pyridine in the reaction medium. The reaction in the watery phase gave the cleanest extracts when measured in full scan mode. A total ion current chromatogram is depicted in Figure 4 showing the separation of the peaks of the three analytes of interest.
When analyzing a sample with a low enrichment directly after analyzing a highly enriched sample, there was a noticeable oxalate-related memory effect. This was easily solved by performing additional injections of the lower enriched sample or adding a few blank injections. As this analysis is to be applied to samples obtained following primed continuous infusion, sample enrichment (such as low versus high) is predictable, and the problem can be prevented by scheduling blank injections within the sequence when there is a large expected downward shift in sample enrichment.
The described isotope infusion protocol will serve multiple purposes for improving our understanding of PH molecular pathophysiology, which will revitalize the research in this field and hence support optimal treatment for all PH patients. First, we now have a strong tool that will play a pivotal role in further elucidating and mapping of glyoxylate metabolism. Despite decades of research into PHs, a number of uncertainties still exist. A major caveat remains the contribution of different precursors on endogenous oxalate production, which could be answered with a multiple tracer infusion. We are now able to assess the contribution of glycolate as a source for endogenous oxalate production. Second, our method could also be used to evaluate therapeutic efficacies for new therapeutic modalities using substrate inhibition (by sRNAi) that are presently under investigation.4,5,11 Instead of using surrogate end points (such as urinary oxalate excretion and/or plasma oxalate concentration), we can now quantify the decrease in endogenous oxalate production to proof efficacy. Finally, our method could also play a crucial role in clinical decision-making. We are now able to assess pyridoxine (Vitamin B6) responsiveness in a noninvasive manner (in contrast to performing a liver biopsy) as these patients do have residual AGT enzyme activity. We can prove pyridoxine responsiveness by finding a lower endogenous oxalate production (from glycolate) as compared to non-B6 responders, but more importantly we can also prove that the conversion of 1-13C-glyoxylate to 1-13C-glycine occurs.
Conclusion
We developed a valid GC–MS/MS method for the precise and sensitive analysis of oxalate, glycolate, and glyoxylate enrichment following a primed, continuous infusion of 13C2-oxalate and 1-13C-glycolate. This method will allow for the analysis of glycolate, glyoxylate, and oxalate metabolism in both healthy subjects and PH patients. The isotope procedure is indispensable for testing therapeutic effects of treatment within a short time-span in PH1 patients. Moreover, it provides quantitative data on how much activity of the defective enzyme is recovered. This is invaluable information in studies on new drugs, and it opens possibilities for assessing the efficacy of drugs for PH1 patients. The information obtained from these new developments may be a breakthrough in treating PH patients and probably can prevent patients from having a liver and/or kidney transplant.
Author Contributions
The manuscript was written through contributions of all authors. All authors have given approval to the final version of the manuscript.
The authors declare no competing financial interest.
References
- Clifford-Mobley O.; Sjogren A.; Lindner E.; Rumsby G. Urine oxalate biological variation in patients with primary hyperoxaluria. Urolithiasis 2016, 44 (4), 333–7. 10.1007/s00240-016-0860-2. [DOI] [PubMed] [Google Scholar]
- Jamieson N. V. The results of combined liver/kidney transplantation for primary hyperoxaluria (PH1) 1984–1997. The European PH1 transplant registry report. European PH1 Transplantation Study Group. J. Nephrol 1998, 11 (1), 36–41. [PubMed] [Google Scholar]
- Cochat P.; Gaulier J. M.; Koch Nogueira P. C.; Feber J.; Jamieson N. V.; Rolland M. O.; Divry P.; Bozon D.; Dubourg L. Combined liver-kidney transplantation in primary hyperoxaluria type 1. Eur. J. Pediatr. 1999, 158 (S2), S075–S080. 10.1007/PL00014327. [DOI] [PubMed] [Google Scholar]
- Liebow A.; Li X.; Racie T.; Hettinger J.; Bettencourt B. R.; Najafian N.; Haslett P.; Fitzgerald K.; Holmes R. P.; Erbe D.; Querbes W.; Knight J. An Investigational RNAi Therapeutic Targeting Glycolate Oxidase Reduces Oxalate Production in Models of Primary Hyperoxaluria. J. Am. Soc. Nephrol. 2017, 28 (2), 494–503. 10.1681/ASN.2016030338. [DOI] [PMC free article] [PubMed] [Google Scholar]
- Lai C.; Pursell N.; Gierut J.; Saxena U.; Zhou W.; Dills M.; Diwanji R.; Dutta C.; Koser M.; Nazef N.; Storr R.; Kim B.; Martin-Higueras C.; Salido E.; Wang W.; Abrams M.; Dudek H.; Brown B. D. Specific Inhibition of Hepatic Lactate Dehydrogenase Reduces Oxalate Production in Mouse Models of Primary Hyperoxaluria. Mol. Ther. 2018, 26 (8), 1983–1995. 10.1016/j.ymthe.2018.05.016. [DOI] [PMC free article] [PubMed] [Google Scholar]
- Schierbeek H.Mass Spectrometry and Stable Isotopes in Nutritional and Pediatric Research, 1st ed.; John Wiley & Sons, Inc: New Jersey, 2017. [Google Scholar]
- Hockaday T. D.; Frederick E. W.; Clayton J. E.; Smith L. H. Jr. Studies on Primary Hyperoxaluria. Ii. Urinary Oxalate, Glycolate, and Glyoxylate Measurement by Isotope Dilution Methods. J. Lab Clin. Med. 1965, 65, 677–687. [PubMed] [Google Scholar]
- Huidekoper H. H.In Vivo Kinetic Studies in Inborn Errors of Metabolism: Expanding Insights in (Patho)Physiology; University of Amsterdam: Amsterdam, The Netherlands, 2008. [Google Scholar]
- Knight J.; Assimos D. G.; Callahan M. F.; Holmes R. P. Metabolism of primed, constant infusions of [1,2-(1)(3)C(2)] glycine and [1-(1)(3)C(1)] phenylalanine to urinary oxalate. Metab., Clin. Exp. 2011, 60 (7), 950–6. 10.1016/j.metabol.2010.09.002. [DOI] [PMC free article] [PubMed] [Google Scholar]
- Fargue S.; Milliner D. S.; Knight J.; Olson J. B.; Lowther W. T.; Holmes R. P. Hydroxyproline Metabolism and Oxalate Synthesis in Primary Hyperoxaluria. J. Am. Soc. Nephrol. 2018, 29 (6), 1615–1623. 10.1681/ASN.2017040390. [DOI] [PMC free article] [PubMed] [Google Scholar]
- Li X.; Knight J.; Fargue S.; Buchalski B.; Guan Z.; Inscho E. W.; Liebow A.; Fitzgerald K.; Querbes W.; Todd Lowther W.; Holmes R. P. Metabolism of (13)C5-hydroxyproline in mouse models of Primary Hyperoxaluria and its inhibition by RNAi therapeutics targeting liver glycolate oxidase and hydroxyproline dehydrogenase. Biochim. Biophys. Acta, Mol. Basis Dis. 2016, 1862 (2), 233–9. 10.1016/j.bbadis.2015.12.001. [DOI] [PMC free article] [PubMed] [Google Scholar]
- Vlaardingerbroek H.; Vermeulen M. J.; Rook D.; van den Akker C. H. P.; Dorst K.; Wattimena J. L.; Vermes A.; Schierbeek H.; van Goudoever J. B. Safety and Efficacy of Early Parenteral Lipid and High-Dose Amino Acid Administration to Very Low Birth Weight Infants. J. Pediatr. 2013, 163 (3), 638–644. 10.1016/j.jpeds.2013.03.059. [DOI] [PubMed] [Google Scholar]
- Veldhorst M. S. H.Obesity. In Mass Spectrometry and Stable Isotopes in Nutritional and Pediatric Research, 1st ed.; Schierbeek H., Ed.; John Wiley & Sons, Inc: New Jersey, 2017; pp 225–257. [Google Scholar]
- Fijlstra M.Nutrient Digestion and Absorption During Intestinal Malfunction and Diseases. In Mass Spectrometry and Stable Isotopes in Nutritional and Pediatric Research, 1st ed.; Schierbeek H., Ed.; John Wiley & Sons, Inc: New Jersey, 2017; pp 336–363. [Google Scholar]
- Kasidas G. P.; Rose G. A. Measurement of plasma oxalate in healthy subjects and in patients with chronic renal failure using immobilised oxalate oxidase. Clin. Chim. Acta 1986, 154 (1), 49–58. 10.1016/0009-8981(86)90087-2. [DOI] [PubMed] [Google Scholar]
- Elgstoen K. B. Liquid chromatography-tandem mass spectrometry method for routine measurement of oxalic acid in human plasma. J. Chromatogr. B: Anal. Technol. Biomed. Life Sci. 2008, 873 (1), 31–6. 10.1016/j.jchromb.2008.07.002. [DOI] [PubMed] [Google Scholar]
- Mazzachi B. C.; Teubner J. K.; Ryall R. L. Factors affecting measurement of urinary oxalate. Clin Chem. 1984, 30 (8), 1339–1343. [PubMed] [Google Scholar]
- Costello J.; Landwehr D. M. Determination of oxalate concentration in blood. Clin Chem. 1988, 34 (8), 1540–1544. [PubMed] [Google Scholar]
- Schummer C.; Delhomme O.; Appenzeller B. M.; Wennig R.; Millet M. Comparison of MTBSTFA and BSTFA in derivatization reactions of polar compounds prior to GC/MS analysis. Talanta 2009, 77 (4), 1473–82. 10.1016/j.talanta.2008.09.043. [DOI] [PubMed] [Google Scholar]
- Inoue Y.; Masuyama H.; Ikawa H.; Mitsubuchi H.; Kuhara T. Monitoring method for pre- and post-liver transplantation in patients with primary hyperoxaluria type I. J. Chromatogr. B: Anal. Technol. Biomed. Life Sci. 2003, 792 (1), 89–97. 10.1016/S1570-0232(03)00278-2. [DOI] [PubMed] [Google Scholar]
- Wolthers B. G.; Hayer M. The Determination of Oxalic-Acid in Plasma and Urine by Means of Capillary Gas-Chromatography. Clin. Chim. Acta 1982, 120 (1), 87–102. 10.1016/0009-8981(82)90080-8. [DOI] [PubMed] [Google Scholar]
- von Unruh G. E.; Voss S.; Sauerbruch T.; Hesse A. Reference Range for Gastrointestinal Oxalate Absorption Measured With a Standardized 13C2 Oxalate Absorption Test. J. Urol. 2003, 169 (2), 687–690. 10.1097/00005392-200302000-00065. [DOI] [PubMed] [Google Scholar]
- Monico C. G.; Persson M.; Ford G. C.; Rumsby G.; Milliner D. S. Potential mechanisms of marked hyperoxaluria not due to primary hyperoxaluria I or II. Kidney Int. 2002, 62 (2), 392–400. 10.1046/j.1523-1755.2002.00468.x. [DOI] [PubMed] [Google Scholar]
- Hlozek T.; Bursova M.; Cabala R. Fast determination of ethylene glycol, 1,2-propylene glycol and glycolic acid in blood serum and urine for emergency and clinical toxicology by GC-FID. Talanta 2014, 130, 470–474. 10.1016/j.talanta.2014.07.020. [DOI] [PubMed] [Google Scholar]
- Hlozek T.; Bursova M.; Cabala R. Simultaneous and cost-effective determination of ethylene glycol and glycolic acid in human serum and urine for emergency toxicology by GC-MS. Clin. Biochem. 2015, 48 (3), 189–91. 10.1016/j.clinbiochem.2014.12.002. [DOI] [PubMed] [Google Scholar]
- Husek P. Simultaneous profile analysis of plasma amino and organic acids by capillary gas chromatography. J. Chromatogr., Biomed. Appl. 1995, 669 (2), 352–7. 10.1016/0378-4347(95)00115-Y. [DOI] [PubMed] [Google Scholar]
- Villas-Boas S. G.; Delicado D. G.; Akesson M.; Nielsen J. Simultaneous analysis of amino and nonamino organic acids as methyl chloroformate derivatives using gas chromatography-mass spectrometry. Anal. Biochem. 2003, 322 (1), 134–138. 10.1016/j.ab.2003.07.018. [DOI] [PubMed] [Google Scholar]
- Husek P. Chloroformates in gas chromatography as general purpose derivatizing agents. J. Chromatogr., Biomed. Appl. 1998, 717 (1–2), 57–91. 10.1016/S0378-4347(98)00136-4. [DOI] [PubMed] [Google Scholar]
- Liebich H. M.; Gesele E.; Wahl H. G.; Wirth C.; Woll J.; Husek P. Identification of Side-Products Formed by Derivatization of 2-Hydroxycarboxylic Acids with Methyl and Ethyl Chloroformate. J. Chromatogr. 1992, 626 (2), 289–293. 10.1016/0021-9673(92)85423-Q. [DOI] [Google Scholar]
- Jaitz L.; Mueller B.; Koellensperger G.; Huber D.; Oburger E.; Puschenreiter M.; Hann S. LC-MS analysis of low molecular weight organic acids derived from root exudation. Anal. Bioanal. Chem. 2011, 400 (8), 2587–96. 10.1007/s00216-010-4090-0. [DOI] [PubMed] [Google Scholar]
- Liebman M.; Chai W. Effect of dietary calcium on urinary oxalate excretion after oxalate loads. Am. J. Clin. Nutr. 1997, 65 (5), 1453–9. 10.1093/ajcn/65.5.1453. [DOI] [PubMed] [Google Scholar]
- Koolstra W.; Wolthers B. G.; Hayer M.; Rutgers H. M. An improved high performance liquid chromatographic method for determining urinary oxalate, making use of an ID-MS reference method. Clin. Chim. Acta 1987, 170 (2–3), 237–43. 10.1016/0009-8981(87)90133-1. [DOI] [PubMed] [Google Scholar]
- France N. C.; Holland P. T.; Wallace M. R. Contribution of dialysis to endogenous oxalate production in patients with chronic renal failure. Clin. Chem. 1994, 40 (8), 1544–1548. [PubMed] [Google Scholar]
- Gelot M. A.; Lavoue G.; Belleville F.; Nabet P. Determination of oxalates in plasma and urine using gas chromatography. Clin. Chim. Acta 1980, 106 (3), 279–85. 10.1016/0009-8981(80)90311-3. [DOI] [PubMed] [Google Scholar]
- Koolstra W.; Wolthers B. G.; Hayer M.; Elzinga H. Development of a reference method for determining urinary oxalate by means of isotope dilution-mass spectrometry (ID-MS) and its usefulness in testing existing assays for urinary oxalate. Clin. Chim. Acta 1987, 170 (2–3), 227–35. 10.1016/0009-8981(87)90132-X. [DOI] [PubMed] [Google Scholar]
- Wolthers B. G.; Meijer S.; Tepper T.; Hayer M.; Elzinga H. The Determination of Oxalate in Hemodialysate and Plasma - a Means to Detect and Study Hyperoxaluria in Hemodialyzed Patients. Clin. Sci. 1986, 71 (1), 41–47. 10.1042/cs0710041. [DOI] [PubMed] [Google Scholar]


