

Abstract
Background
Acute venous thromboembolism (VTE) refers to deep venous thrombosis (DVT) of the extremities or pulmonary embolism (PE), or to both. Reliable imaging is not always available making a serologic diagnosis, or biomarker, highly desirable.
Objective
This study aimed to examine the role of neutrophil‐lymphocyte ratio (NLR), platelet‐lymphocyte ratio (PLR), and mean platelet volume (MPV) in detection patients with acute VTE.
Methods
A total of 327 patients with initial diagnosis of acute VTE who were admitted to Ziv hospital were evaluated. Of them, 272 patients with definitive diagnosis of VTE, and 55 patients without VTE were used as control group. Complete blood count (CBC), measurements of NLR, MPV, and PLR were determined at admission.
Results
Patients with VTE were older than controls (62 ± 18.9 vs 55.4 ± 15.1 years, respectively, P = .03). Female gender was predominant in the two groups. In the study group, 178/272 (66%) had DVT, 84/272 (31%) had pulmonary embolism (PE), and the rest had DVT and PE. NLR, MPV, and PLR were found to be significantly elevated in acute VTE compared to control (P < .001, P = .008, P = .014, respectively). A ROC curve analysis of NLR and MPV for predicting acute VTE was performed which found a cut‐off value of 5.3 for NLR, an area under curve of (0.67 (0.60‐0.75), P < .001, with a sensitivity of 69% and specificity of 57%. and a cut‐off value of 8.6 for MPV, an area under curve of (0.61 [0.53‐0.68], P = .014, with a sensitivity of 52% and specificity of 67%. Multivariate logistic regression model found that NLR (OR 1.2, 95% CI [1.01‐1.4], P = .041) and MPV (OR 1.5, 95%CI [1.07‐2.12], P = .5) were associated with acute VTE.
Conclusions
Neutrophil‐lymphocyte ratio and MPV could be beneficial predictors for the early detection of potential acute VTE.
Keywords: mean platelet volume, neutrophil‐lymphocyte ratio, platelet‐lymphocyte ratio (PLR), venous thromboembolism
1. INTRODUCTION
Venous thromboembolism (VTE) encompasses deep venous thrombosis (DVT) and pulmonary embolism (PE). VTE causes cardiovascular death and disability.1 The risk of PE‐associated mortality and morbidity extends far beyond the acute phase of the disease. In earlier follow‐up studies, as many as 30% of the patients died during a follow‐up period of up to 3 years, and up to 50% of patients continued to complain of dyspnea and/or poor physical performance 6 months to 3 years after the index event.2 It is declared that PE is the most preventable cause of death among hospitalized patients. The pathophysiology of DVT and PE is inflammation and platelet activity. Virchow's triad of inflammation, hypercoagulability, and endothelial injury leads to recruitment of activated platelets that contain pro‐inflammatory mediators.1
Diagnosis of VTE is often difficult, and point score criteria help to estimate the clinical likelihood of DVT and PE. Patients with a low‐to‐moderate likelihood of DVT or PE should undergo initial diagnostic evaluation with D‐dimer testing alone without obligatory imaging tests.1, 3 However, patients with a high clinical likelihood of VTE should skip D‐dimer testing and undergo imaging as the next step in the diagnostic algorithm. Score system for low clinical likelihood of DVT is zero points; moderate likelihood is score 1 to 2; high likelihood if score is 3 or greater. However, the D‐dimer assay is not specific. Levels increase in patients with myocardial infarction, pneumonia, sepsis, cancer, and the postoperative state and those in the second or third trimester of pregnancy. Therefore, D‐dimer rarely has a useful role among hospitalized patients, because levels are frequently elevated due to systemic illness.1, 3 Adding markers is highly desirable. In recent years, more and more attention is given to the role of inflammatory markers in different diagnosis.4, 5, 6 Few studies have been done about inflammatory factors in correlation to DVT and PE. These studies show clear correlation between some inflammatory factors as red blood cell distribution width (RDW), mean platelet volume (MPV), P‐selectin, E–selectin, and DVT.7, 8, 9, 10
While the traditional diagnosis of VTE relies on primarily imaging studies, a multimodality approach including serologic testing continues to evolve. Ongoing data support the use of molecular markers (biomarkers) that may not only aid in the diagnosis of VTE, but also predict recurrence risk and guide length and modality of treatment.11
These biomarkers hold promise to both explain the pathogenesis of thrombosis and serve as useful markers for diagnostic purposes. In this work, we will examine the correlation between DVT and selected inflammatory markers such as MPV, RDW, neutrophil‐lymphocyte ratio (NLR), and platelet‐lymphocyte ratio (PLR).
2. MATERIAL AND METHODS
A retrospective cohort study which aimed to examine the association and correlation between VTE and various new inflammatory markers as RDW, MPV,PLR and NLR taking from medical records of patients admitted with venus thromboembolism. The study was conducted between the years 2010 and 2016 in the departments of internal medicine in Ziv medical center, Safed, affiliated to Azrieli Faculty of Medicine Bar Ilan University, Galilee, Safed, Israel. The study was approved by local Helsinki committee.
A total of 327 patients with initial diagnosis of acute VTE who met the inclusion and exclusion criteria were enrolled. Of them, 272 patients with definitive diagnosis of VTE, and 55 subjects, who were suspected to have VTE and admitted in the same period without evidence of VTE, served as a control group. We excluded patients with acute renal failure, patients treated with hemodialysis, with bone fractures, hepatic failure, and/or manifest active heart disease, such as cardiac failure, acute coronary syndrome, arrhythmia, and cardiac valve disease. Similarly, patients with infection, sepsis, chronic systemic inflammatory disease, and those who had been receiving medications affecting the number of leukocytes were excluded.
We compared between the two groups those with VTE and the controls in term of age, gender, RDW, MPV, PLR, and NLR.
Red blood cell distribution width, MPV, NLR, and PLR were obtained and calculated from the complete blood count which executed in our hematology unit with Beckman‐Coulter Gen‐S system device (Beckman‐Coulter Inc). NLR was defined as the absolute neutrophil count divided by the absolute lymphocyte count. PLR was defined as the absolute platelet count divided by the absolute lymphocyte count. RDW and MPV were obtained from the results of CBC.
Deep venous thrombosis was diagnosed by ultrasound performed by senior and expert radiologists. PE was diagnosed by lung computed angiography which was interpretation by expert radiologists.
2.1. Statistical analysis
Data were analyzed using SPSS version 19 (IBM SPSS). Continuous variables are expressed as the mean standard deviation. The chi‐square test was used to test differences in categorical variables between the cases and controls, and analysis of variance (ANOVA) or Student's t test was used for comparisons of continuous variables. Univariate analysis (Pearson correlation) was used in order to assess potential variables with significant correlation with VTE. The independent association of the inflammatory markers with VTE was investigated by multivariable logistic regression analysis. The odd ratio (OR) and 95% confidence interval (CI) were calculated for every associated variables. Receiver‐operating characteristic (ROC) curve analysis was performed to identify the sensitivity and specificity of the inflammatory markers for the prediction of VTE P < .05 was considered significant in all statistical analysis.
3. RESULTS
A total of 327 patients were enrolled in this retrospective study. Table 1 shows the demographic and laboratory data of all participants. A total of 272 patients (83%) patients were classified as belonging to acute VTE group, while 55 patients belonged to the control group. Among patients within the VTE group, 66% of them were diagnosed with DVT, 31% with PE, and 3% with PE and DVT. There was a no significant difference in gender between the two groups. There was a significant difference in baseline characteristics between the study group and controls regarding the age, and patients with VTE were older than the controls (62 ± 18.9 years vs 55.4 ± 15.1 years, P = .003, respectively). In the acute VTE group, the median value of WBC, PLR NLR, and MPV was statistically significant and higher than the control group.
Table 1.
Demographic and laboratory data of all study groups
| Variable |
Patients with VTE N = 272 |
Controls N = 55 |
P value |
|---|---|---|---|
| Age (y) | 62.7 ± 18.9 | 55.4 ± 15.1 | .003 |
| Gender, female (%) | 142 (52.4) | 31 (57.4) | .501 |
| WBC | 9.5 ± 4.3 | 7.5 ± 2.4 | <.001 |
| HB | 12.8 ± 2.2 | 12.9 ± 1.6 | .665 |
| MPV | 8.6 ± 1.1 | 8.3 ± 0.8 | .008 |
| RDW | 14.9 ± 1.9 | 14.6 ± 1.5 | .262 |
| NLR | 5.3 ± 5.3 | 3.1 ± 1.9 | <.001 |
| PLR | 180.2 ± 127.8 | 149.4 ± 70.5 | .014 |
| Platelet | 248.3 ± 93.6 | 240.3 ± 58.8 | .421 |
| Neutrophils | 7.3 ± 6.6 | 4.9 ± 2.1 | .01 |
| Lymphocytes | 1.9 ± 2.3 | 1.8 ± 0.8 | .847 |
| Deep venous thrombosis | 178 (66) | ||
| Pulmonary embolism | 84 (31) | ||
| PE with DVT | 8 (3) |
Abbreviations: DVT, deep venous thrombosis; MPV, mean platelet volume; NLR, neutrophil‐lymphocyte ratio; PE, pulmonary embolism; PLR, platelet‐lymphocyte ratio; RDW, red blood cell distribution width; VTE, venous thromboembolism.
A ROC curve analysis of NLR and MPV for predicting acute VTE was performed which indicated a cut‐off value of 5.3 for NLR, an area under curve of (0.67 [0.60‐0.75], P < .001, with a sensitivity of 69% and specificity of 57%, and a cut‐off value of 8.6 for MPV, an area under curve of (0.61 [0.53‐0.68], P = .014, with a sensitivity of 52% and specificity of 67% (Figure 1).
Figure 1.
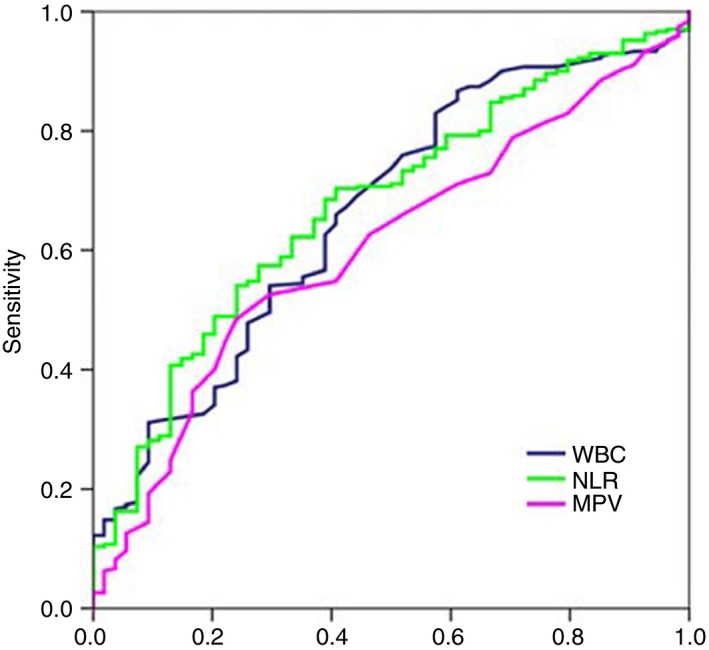
Receiver‐operating characteristic (ROC) curve of WBC, NLR, and MPV to predict VTE. NLR is presented by green line with an AUC of 67% with a sensitivity of 69% and specificity of 57%. MPV is presented in pink line with an AUC of 61% with a sensitivity of 52% and specificity of 67%. MPV, mean platelet volume; NLR, neutrophil‐lymphocyte ratio
Univariate analysis showed significant associations between WBC, NLR, and MPV and VTE. Table 2 summarizes the multivariate logistic regression analysis which showed that age ≥ 62 year (OR 1.02, 95% CI [1.00‐1.04], P = .033), WBC ≥ 9.5 (OR 1.15, 95% CI [1.02‐1.3], P = 0.026), NLR ≥ 5.3 (OR 1.2, 95% CI [1.01‐1.4], P = .041), and MPV ≥ 8.6 (OR 1.5, 95% CI [1.07‐2.12], P = .020) were associated with acute VTE.
Table 2.
Multivariate logistic regression model for the association between venous thromboembolism and inflammatory markers
| Variable | OR (95% CI) | P value |
|---|---|---|
| Age (y) | 1.02 (1.00‐1.04) | .033 |
| WBC | 1.15 (1.02‐1.30) | .026 |
| NLR | 1.20 (1.01‐1.40) | .041 |
| MPV | 1.50 (1.07‐2.12) | .020 |
Abbreviations: MPV, mean platelet volume; NLR, neutrophil‐lymphocyte ratio.
4. DISCUSSION
This retrospective, observational, cohort study showed that NLR and MPV could be beneficial predictors for the early detection of potential acute VTE.
The present study investigated the role of potential and simple inflammatory markers in detecting patients with acute VTE. We included hematological inflammatory markers such as MPV, PLR, RDW, and NLR. We showed a significance utility of NLR and MPV in predicting acute VTE.
The diagnosis of VTE is often difficult, and the D‐dimer is useful only for excluding acute venous thromboembolism; it lacks the specificity necessary for diagnosis confirmation. Therefore, the search for additional diagnostic measures is essential. Recently, inflammatory markers such as MPV, PLR, RDW, and NLR were used as predictors for diverse diseases.12, 13
Neutrophil‐lymphocyte ratio is accessible, cheap, and easy calculated. The importance of this inflammatory marker is related to the pathophysiological mechanism of inflammation and prothrombotic factors, which is characterized by an increased number of circulating leukocytes and cytokines.14 On the other hand, lymphocytopenia appears as a consequence of lymphocyte margination and redistribution in the lymphatic system, with accelerated apoptosis.15 The predictive role of NLR has been evaluated in patients with infections, cancers, cardiovascular diseases, or intestinal inflammatory diseases. We consider that NLR will be a useful prognostic marker in patients with VTE.
Mean platelet volume is another inflammatory marker, which has gained importance in patients with lung, pancreatic cancer.16, 17 One of the key factors for VTE development is the platelet's contribution to the clot formation.18 The MPV, among other markers related to platelet functions and platelet number, is one of the most commonly available hematological parameters. There is evidence that MPV is a surrogate of platelet turnover, because larger platelets are younger and more reactive compared to their counterparts and the association between increased MPV with VTE and cardiovascular risks has been well established.19, 20 In our study, we found that MPV might help in predicting the acute VTE event.
The potential limitations in this study include its retrospective nature, performance in a single center, and many exclusion criteria.
5. CONCLUSIONS
Our study showed that NLR and MPV are significant predictors of acute VTE. Larger, prospective studies are needed in order to confirm these results.
Farah R, Nseir W, Kagansky D, Khamisy‐farah R. The role of neutrophil‐lymphocyte ratio, and mean platelet volume in detecting patients with acute venous thromboembolism. J Clin Lab Anal. 2020;34:e23010 10.1002/jcla.23010
REFERENCES
- 1. Goldhaber SZ. Deep venous thrombosis and pulmonary thromboembolism. Harisson's principles of internal medicine 19th New York, McGraw‐Hill, chapter 300, 1631‐1637.
- 2. Konstantinides SV, Barco S, Rosenkranz S, et al. Late outcomes after acute pulmonary embolism: rationale and design of FOCUS, a prospective observational multicenter cohort study. J Thromb Thrombolysis. 2016; 42(4):600‐609. [DOI] [PMC free article] [PubMed] [Google Scholar]
- 3. Wang K‐L, Chu P‐H, Lee C‐H, et al. Management of venous thromboembolisms: part I. The Consensus for Deep Vein Thrombosis. Acta Cardiol Sin. 2016;32(1):1‐22. [DOI] [PMC free article] [PubMed] [Google Scholar]
- 4. Farah R, Bleier J, Gilbey P, Khamisy‐Farah R. Common laboratory parameters for differentiating between community‐acquired and healthcare‐associated pneumonia. J Clin Lab Anal. 2017;31(1):e22016. [DOI] [PMC free article] [PubMed] [Google Scholar]
- 5. Farah R, Makhoul N. Usefulness of various inflammatory markers to differentiate pulmonary edema from pneumonia. Isr Med Assoc J. 2011;13(4):225‐229. [PubMed] [Google Scholar]
- 6. Lippi G, Buonocore R, Cervellin G. Value of red blood cell distribution width on emergency department admission in patients with venous thrombosis. Am J Cardiol. 2016;117(4):670‐675. [DOI] [PubMed] [Google Scholar]
- 7. Cay N, Unal O, Kartal MG, Ozdemir M, Tola M. Increased level of red blood cell distribution width is associated with deep venous thrombosis. Blood Coagul Fibrinolysis. 2013;24(7):727‐731. [DOI] [PubMed] [Google Scholar]
- 8. Icli A, Aksoy F, Turker Y, et al. Relationship between mean platelet volume and pulmonary embolism in patients with deep vein thrombosis. Heart Lung Circ. 2015;24(11):1081‐1086. [DOI] [PubMed] [Google Scholar]
- 9. Myers DD, Henke PK, Bedard PW, et al. Treatment with an oral small molecule inhibitor of P selectin (PSI‐697) decreases vein wall injury in a rat stenosis model of venous thrombosis. J Vasc Surg. 2006;44(3):625‐632. [DOI] [PubMed] [Google Scholar]
- 10. Coleman DM, Wakefield TW. Biomarkers for the diagnosis of deep vein thrombosis. Expert Opin Med Diagn. 2012;6(4):253‐257. [DOI] [PubMed] [Google Scholar]
- 11. Yao C, Zhang Z, Yao Y, Xu X, Jiang Q, Shi D. Predictive value of neutrophil to lymphocyte ratio and platelet to lymphocyte ratio for acute deep vein thrombosis after total joint arthroplasty: a retrospective study. J Orthop Surg Res. 2018;13(1):40. [DOI] [PMC free article] [PubMed] [Google Scholar]
- 12. Feng JF, Huang Y, Chen QX. Preoperative platelet lymphocyte ratio (PLR) is superior to neutrophil lymphocyte ratio (NLR) as a predictive factor in patients with esophageal squamous cell carcinoma. World J Surg Oncol. 2014;19(12):58. [DOI] [PMC free article] [PubMed] [Google Scholar]
- 13. Saghazadeh A, Hafizi S, Rezaei N. Inflammation in venous thromboembolism: cause or consequence? Int Immunopharmacol. 2015;28(1):655‐665. [DOI] [PubMed] [Google Scholar]
- 14. Orfanu AE, Popescu C, Leuștean A, et al. The importance of haemogram parameters in the diagnosis and prognosis of septic patients. J Crit Care Med. 2017;3:105‐110. [DOI] [PMC free article] [PubMed] [Google Scholar]
- 15. Omar M, Tanriverdi O, Cokmert S, et al. Role of increased mean platelet volume (MPV) and decreased MPV/platelet count ratio as poor prognostic factors in lung cancer. Clin Respir J. 2018;12(3):922‐929. [DOI] [PubMed] [Google Scholar]
- 16. Zhang K, Gao HF, Mo M, et al. A novel scoring system based on hemostatic parameters predicts the prognosis of patients with advanced pancreatic cancer. Pancreatology. 2019;19(2):346‐351. [DOI] [PubMed] [Google Scholar]
- 17. Riedl J, Kaider A, Reitter E‐M, et al. Association of mean platelet volume with risk of venous thromboembolism and mortality in patients with cancer. Results from the vienna cancer and thrombosis study (CATS). Thromb Haemost. 2014;111(4):670‐678. [DOI] [PubMed] [Google Scholar]
- 18. Braekkan SK, Mathiesen EB, Njølstad I, Wilsgaard T, Størmer J, Hansen JB. Mean platelet volume is a risk factor for venous thromboembolism: the Tromso Study, Tromso. Norway. J Thromb Haemost. 2010;8:157‐162. [DOI] [PubMed] [Google Scholar]
- 19. Chu SG, Becker RC, Berger PB, et al. Mean platelet volume as a predictor of cardiovascular risk: a systematic review and meta‐analysis. J Thromb Haemost. 2010;8:148‐156. [DOI] [PMC free article] [PubMed] [Google Scholar]
- 20. Farah R, Khamisy‐Farah R. Association of neutrophil to lymphocyte ratio with presence and severity of gastritis due to helicobacter pylori infection. J Clin Lab Anal. 2014;28(3):219‐223. [DOI] [PMC free article] [PubMed] [Google Scholar]