Abstract
Background:
Asthma is a frequent chronic disease of the airways. In spite of the fact that symptoms of asthma are well known, the pathogenesis has not yet been fully understood. Quantitative computed tomography (qCT) of the lung allows for the measurment of a set of parameters. The aim of this study was to evaluate the usefulness of quantitative computed tomography in the assessment of airway wall thickness in asthma.
Methods:
The prospective study was performed on a group of 83 patients with well-defined, long-term asthma between 2016 and 2018. The control group was composed of 30 healthy volunteers. All examined subjects were non-smokers. All computed tomography (CT) studies were performed using a 128 multi-slice CT scanner with no contrast, following a chest scanning protocol in the supine position, at full inspiration and breath-holds.
Results:
Quantitative bronchial tree measurements were obtained from the third up to the ninth generation of the posterior basal bronchi (B10) of the right lung in a blinded fashion. The value of the wall thickness in patients with asthma was significantly higher in all measured generations of the bronchial tree (third to ninth generation). The lumen area and the inner diameter significantly correlated with the lung function tests and were substantially smaller in the examined group from the seventh to the ninth generation of the bronchi (p < 0.05).
Conclusions:
We conclude that airway remodelling occurs in most patients with long-term asthma and is associated mainly with the medium and small airways. Imaging techniques, especially qCT can be useful in the diagnosis and management of asthma.
The reviews of this paper are available via the supplemental material section.
Keywords: airway remodelling, asthma, quantitative computed tomography
Introduction
Asthma is one of the most common chronic lung diseases. It is a heterogeneous inflammatory disease characterised by bronchial hyperresponsiveness, coughing, wheezing, breathlessness and more frequently by partially irreversible airway obstruction. In a subset of subjects with long-term severe asthma, uncontrolled inflammation leads to irreversible changes of the bronchial wall, defined as remodelling.1 Remodelling is associated with a fixed airflow limitation in lung function testing.
In severe asthma, particularly in patients with an uncontrolled disease not responding to therapy or in those patients with atypical presentations, computed tomography (CT) has been utilized to rule out asthma mimicking diagnosis. Beyond obtaining an accurate diagnosis, the utility of CT in severe asthma is limited.2 The development of new CT-scanner generations and the advancement in image post-processing techniques enable an extension of the scope of examination and imaging precision. Both are the base of quantitative computed tomography (qCT)3 that allows for the measurement of numerous not directly attainable parameters of the fields subjected to examination. Several studies focus on quantitative airway measurements in patients with asthma.4–6
Airflow limitations
Airflow limitation is a defining feature of asthma. It is suggested that in a mild and moderate disease, airway narrowing is tidal and fully reversible. In severe asthma, however, airway obstruction may become permanent and less responsive to treatment.7,8 Bronchial remodelling is defined as a thickening of the bronchial wall due to the increase of smooth muscle mass, mucous gland hypertrophy, neoangiogenesis and sub-epithelial membrane thickening. Fixed obstruction in severe asthma tends to mimic clinically chronic obstructive pulmonary disease (COPD). The overlap of clinical presentation of asthma and COPD brings difficulties in clinical practice and remains a significant concern. Modern imaging techniques may provide an insight into the complexity of the airway structure and the physiopathology of obstructive diseases. qCT is used in studying bronchial wall remodelling, its relationship with airflow limitation and other clinical outcomes.9–11
Tsurikisawa and colleagues demonstrated a significant correlation between the duration of asthma and airway structural changes.12 Berair and colleagues described the associations between qCT and endobronchial biopsy specimens. The authors showed a significant correlation between bronchial cross-sectional lumen area and the epithelial thickness, especially in proximal airways.9 A clear relationship was found between the airway dimension decrease, observed in computed tomography, and the airflow limitation in lung function tests.10 Previous studies demonstrated this relationship in proximal airways.9,10
This prospective study aimed to evaluate the usefulness of quantitative multi-slice computed tomography in the assessment of airway wall thickness and for verification of the relationship between the structural change of the bronchial tree and the airflow limitation in patients with asthma.
Materials and methods
The study was approved by The Bioethics Committee of the Wroclaw Medical University (No. KB – 280/2014). Informed consent for the study was obtained from all the subjects before conducting any study procedures. The study was conducted according to the World Medical Association Declaration of Helsinki.
Patient population
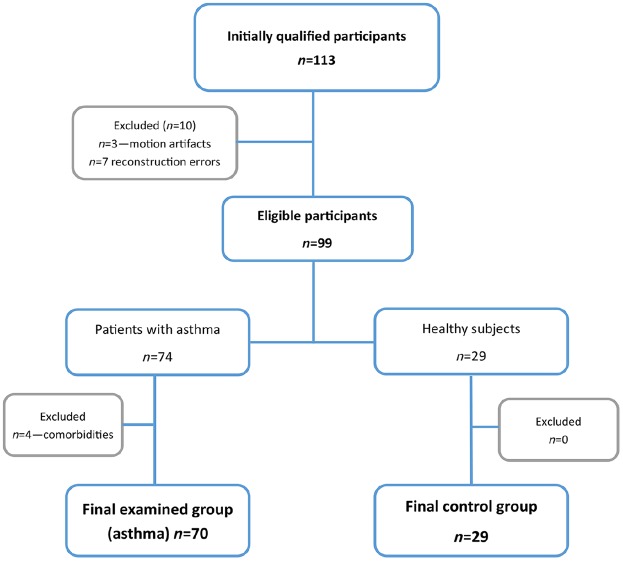
In this single academic centre study, we studied prospectively 83 patients (49 female and 34 male) with chronic asthma and 30 healthy volunteers (12 female and 18 male). (Table 1) The average age of participants was 46.76 (SD = 13.38) years. All subjects, in both groups, were non-smokers. Asthma was diagnosed according to the Global Initiative for Asthma (GINA) 2015 recommendations regarding definition, diagnosis and assessment of asthma severity. The diagnosis was made by experienced allergists and pulmonologists and was based on the history of asthma symptoms, variable over time airflow limitation, bronchodilator testing and in some cases provocation testing.13 All patients were recruited from the allergological outpatient clinic of our university. In 10 cases (9 asthma and 1 healthy volunteer) quantitative image reconstructions were not possible because of motion artefacts (n = 3) and system errors (n = 7), which prevent image reconstructions. In total, four patients were excluded from the final analysis due to the diagnosis of another disease. Figure 1 presents the flowchart of examined participants.
Table 1.
Patients characteristics – mean values (SD) in patients with asthma and healthy controls.
| Parameters | Asthma |
Control group |
p value |
|---|---|---|---|
| n = 83 | n = 30 | ||
| Age (years) | 45.40 (12.73) | 47.07 (13.01) | ns |
| Height (cm) | 169.1 (8.98) | 172.67 (9.21) | ns |
| Weight (kg) | 77.52 (17.97) | 81.63 (16.27) | ns |
| Sex (F/M) | 49/34 | 12/18 | ns |
| BMI | 27.01 (5.52) | 27.31 (5.06) | ns |
| BSA (m2) | 1.88 (0.32) | 1.97 (0.25) | ns |
| FEV1 (Litres) | 2.53 (1.02) | 3.68 (1.06) | <0.0001 |
| FEV1 (% predicted) | 81.31 (23.64) | 108.35 (12.64) | <0.0001 |
| FEV1/FVC% | 64.94 (12.00) | 77.57 (5.80) | <0.0001 |
| FVC (Litres) | 3.91 (1.25) | 4.74 (1.31) | 0.0027 |
| FVC (% predicted) | 107.2 (24.68) | 115.9 (12.48) | ns |
| FEF75 | 3.97 (2.06) | 6.70 (2.14) | <0.0001 |
| FEF50 | 2.08 (1.51) | 4.02 (1.66) | <0.0001 |
| ROCC | 0.66 (0.32) | 0.48 (0.18) | 0.0038 |
BMI, body mass index; BSA, body surface area; FEF25–75, mid forced expiratory flow at 50–75% of the forced vital capacity; FEV1, forced expiratory volume in 1 s; FVC, forced vital capacity; ns, not significant; Rocc, respiratory resistance; SD, standard deviation.
Figure 1.
Patients flowchart.
The study group was composed of 25 subjects with severe refractory asthma, 28 with moderate asthma and 30 patients with mild asthma. The refractory asthma referred to patients with irreversible airflow limitation despite step 5 treatment. All patients were examined in a stable, well-controlled condition according to the Asthma Control Test™ (score of 20–25) and at least 4 weeks after their last exacerbation. Patients were asked to refrain from taking inhaled bronchodilators before the examination, according to the summary of product characteristics (at least 8 h in the case of short-term and 24 h in the case of long-term bronchodilators, respectively).
Computed tomography scanning
All the CT studies were performed using a 128 multi-slice CT scanner (SOMATOM Definition AS+, Siemens Healthcare, Erlangen, Germany) with a non-contrast chest scanning protocol.
Automatic exposure control with reference values of 120 kV and 100 mA, or 100 kV, 110 mA (Care4Dose, Siemens Healthcare, Erlangen, Germany) and iterative reconstruction algorithm (SAFIRE, Siemens Healthcare, Erlangen, Germany) were used to reduce and optimise the radiation dose. Other scanning parameters were as follows: 128 × 0.6 mm collimation, pitch 1.2 mm, rotation time 0.5 s, high-resolution matrix 512 × 512 px.
All patients were examined in the supine position, craniocaudal direction at full inspiration and breath-holds. Before scanning, all patients were carefully instructed in detail how to perform the manoeuvre correctly.
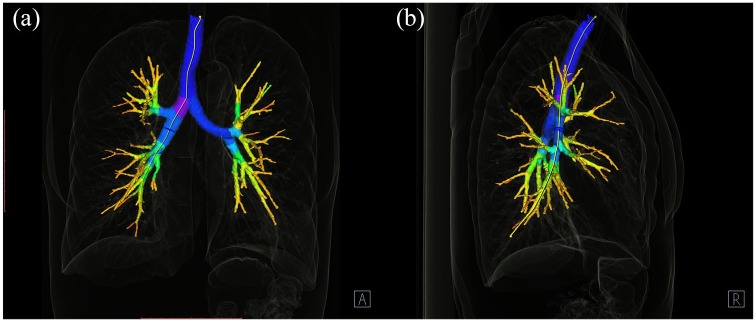
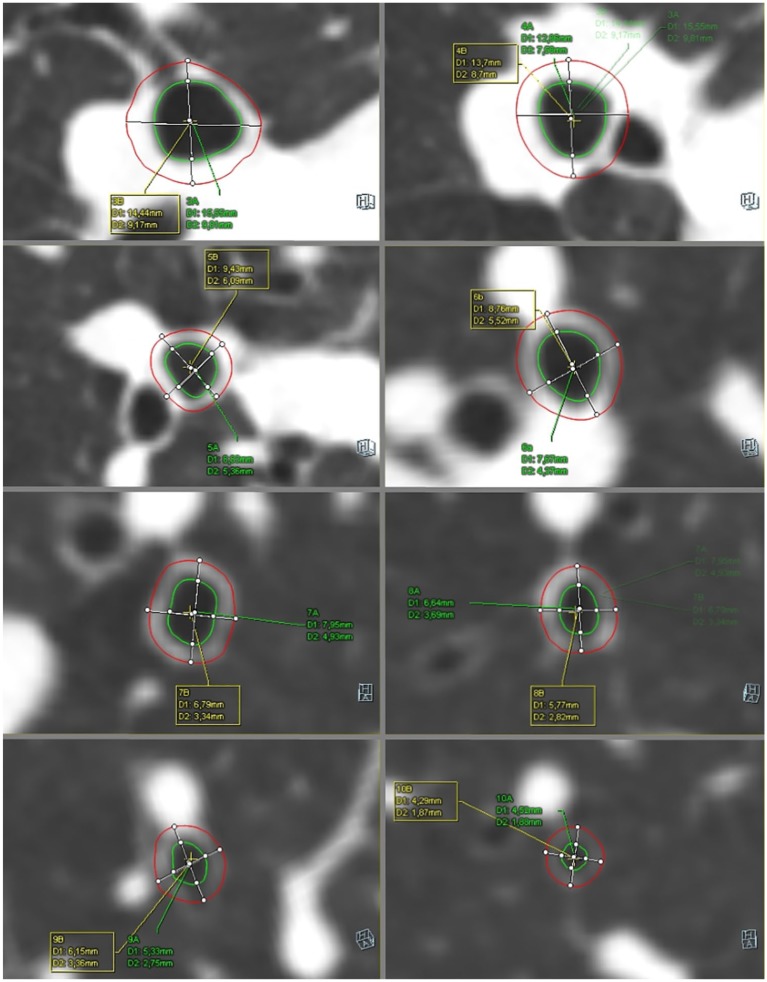
The images were viewed and analysed on a dedicated workstation with Syngo.via and Syngo.Pulmo3D (Siemens Healthcare, Erlangen, Germany) on a lung and mediastinal window settings (lung: WW 1500 HU, WL –600 HU, mediastinal WW 400 HU, WL 40 HU). The 3D model of the bronchial tree was extracted with the volume rendering technique presented in Figure 2. Further, the appropriate bronchus was selected and displayed in the enlarged, axial window (Figure 3). Virtual bronchoscopy of the CT was used to navigate and show the position of the measurement.
Figure 2.
The bronchial tree segmentation. Syngo.via. Pulmo3D (a) AP projection and (b) lateral projection.
Figure 3.
The measurements of the airway from 3rd to 10th generations of the bronchi. Syngo.via. Pulmo3D (D1 value is described in the text as OD, D2 value is described in the text as ID)
We obtained quantitative parameters of the bronchial tree from the 3rd up to the 9th generations of the right lung. The segmental bronchus was considered the third generation of the bronchial tree. The respiratory tracts were measured in cross-sectional scans, perpendicular to the long axis. The outer diameter (OD) was expressed as the total diameter of the bronchi, the inner diameter (ID) was measured as the luminal diameter. The mean wall thickness (WT) was calculated according to the equation
The wall area (WA), the lumen area (LA) and the percentage of the WA (WA%) were automatically calculated as the proper parts of the cross-sectional total airway area. A graphical presentation of the measurements is shown in Figure 4.
Figure 4.
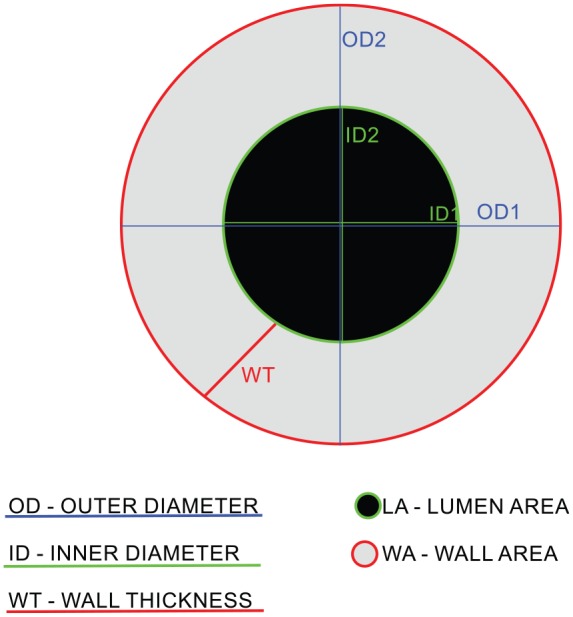
Bronchial tree main parameters: OD, ID, WT, WA, LA.
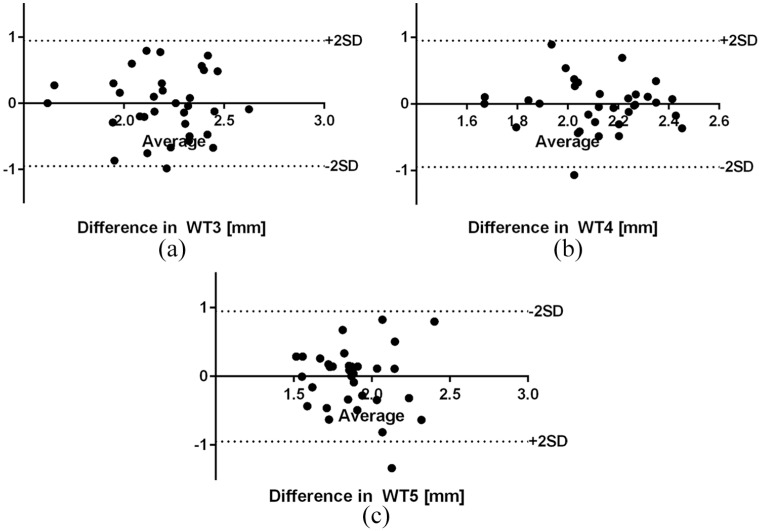
All measurements were performed by one experienced observer with no knowledge of the past medical history of the patients. The intraobserver agreement of measurements of the WT3-WT5 was completed in a group of 30 randomly chosen subjects. There was a 4-month interval between consecutive measurements.
Lung function tests
Spirometry and airway resistance measurements were performed using the Jaeger MasterScope spirometer on the same day as the CT scans. We measured forced expiratory volume in 1 s (FEV1), forced vital capacity (FVC), peak expiratory flow (PEF) and respiratory resistance (Rocc). FEV1/FVC %, FEV1/VC max% were computed according to GINA guidelines.
Statistical analysis
The statistical analysis was performed using the GraphPad Prism v.6.0 (GraphPad Software, California, USA) and the MS Office Excel 2016 (Microsoft, Redmond, USA). The Shapiro–Wilk test and the D’Agostino–Pearson omnibus normality test were used to verify the normal distribution. The chi-square test was used to assess the frequency distribution in the examined groups. The comparison of the two groups was performed using the Mann–Whitney U test and presented as a median value and an interquartile range. Correlation coefficients between the factors were assessed with Spearman’s rank correlation coefficient. The reproducibility of the measurements was assessed with the Bland–Altman test.
Results
Image reconstructions and the airway segmentation from the third to the seventh generations of the bronchi were possible in nearly all examined subjects (n = 99). The eighth bronchial generation was attainable in 82% (n = 82), whereas the ninth in 62% (n = 62) of the subjects. The chi-square test revealed no statistical difference in the frequency of the obtained bronchial divisions between the study and the control groups.
The WT in patients with asthma was significantly larger in all measured generations of the bronchial tree (third to ninth generation) (Table 2). The OD and the total cross-sectional WA of all bronchial generations were similar in both groups. The cross-sectional WA% from WA4% to WA9% was significantly bigger in asthmatic patients (p < 0.05). The LA and the ID from the seventh to the ninth generations were significantly smaller in the asthmatic group (p < 0.05). More detailed parameters are presented in Tables 3 and 4.
Table 2.
Wall thickness median values (SD) in patients with asthma and healthy controls (Mann–Whitney U test).
| Asthma |
Control group |
p value | |||||
|---|---|---|---|---|---|---|---|
| n | Median | IQR | n | Median | IQR | ||
| WT3 | 70 | 2.34 | 2.07–2.58 | 29 | 2.1 | 1.74–2.43 | 0.0224 |
| WT4 | 70 | 2.24 | 1.97–2.42 | 29 | 1.75 | 1.60–2.14 | <0.0001 |
| WT5 | 70 | 1.84 | 1.66–2.05 | 29 | 1.63 | 1.43–1.87 | 0.0011 |
| WT6 | 70 | 1.64 | 1.52–1.80 | 29 | 1.49 | 1.37–1.57 | <0.0001 |
| WT7 | 67 | 1.53 | 1.44–1.66 | 27 | 1.46 | 1.32–1.56 | 0.0433 |
| WT8 | 57 | 1.50 | 1.36–1.59 | 25 | 1.35 | 1.27–1.49 | 0.0015 |
| WT9 | 41 | 1.38 | 1.30–1.50 | 21 | 1.34 | 1.21–1.41 | 0.0444 |
3–9, following generations of the bronchial tree; IQR, interquartile range; WT, wall thickness.
Table 3.
Lumen area the median values and interquartile range (Mann–Whitney U test).
| Asthma |
Control group |
p value | |||||
|---|---|---|---|---|---|---|---|
| n | Median | IQR | n | Median | IQR | ||
| LA3 | 70 | 48.94 | 40.55–67.13 | 28 | 51.70 | 45.97–58.51 | ns |
| LA4 | 70 | 35.47 | 29.33–42.80 | 28 | 33.36 | 27.39–39.46 | ns |
| LA5 | 70 | 24.07 | 19.59–29.79 | 28 | 25.64 | 17.80–31.49 | ns |
| LA6 | 70 | 15.50 | 11.63–21.06 | 28 | 16.79 | 13.48–20.11 | ns |
| LA7 | 64 | 9.20 | 6.89–13.08 | 24 | 11.58 | 9.95–16.09 | 0.0031 |
| LA8 | 54 | 6.49 | 4.50–8.70 | 21 | 7.91 | 5.97–12.04 | 0.0141 |
| LA9 | 38 | 3.45 | 2.86–5.61 | 18 | 5.18 | 4.19–6.32 | 0.0078 |
3–9, following generations of the bronchial tree; IQR, interquartile range; LA, lumen area; ns, not significant.
Table 4.
The measurements of the inner diameter the median values and SD. (Mann–Whitney U test).
| Asthma |
Control group |
p value | |||||
|---|---|---|---|---|---|---|---|
| n | Median | IQR | n | Median | IQR | ||
| ID3 | 70 | 7.73 | 7.14–9.37 | 29 | 8.39 | 7.53–8.80 | ns |
| ID4 | 70 | 6.71 | 6.08–7.41 | 29 | 6.47 | 5.98–7.36 | ns |
| ID5 | 70 | 5.51 | 4.95–6.07 | 29 | 5.83 | 4.79–6.67 | ns |
| ID6 | 70 | 4.42 | 3.83–5.18 | 29 | 4.94 | 4.31–5.23 | ns |
| ID7 | 67 | 3.43 | 2.96–4.14 | 27 | 3.83 | 3.48–4.24 | 0.0403 |
| ID8 | 57 | 2.84 | 2.39–3.35 | 25 | 3.12 | 2.67–3.70 | 0.0437 |
| ID9 | 40 | 2.10 | 1.84–2.50 | 20 | 2.53 | 2.39–2.96 | 0.0005 |
3–9, following generations of the bronchial tree; ID, inner diameter; IQR, interquartile range; ns, not significant.
Statistically significant differences between the examined and the control groups (p < 0.05) were found in most lung function tests parameters. The most important are listed in Table 1 – patients characteristics. The analysis of the airway resistance values (Rocc) showed a significantly higher resistance in the airways in the study group (p = 0.0038) in relation to the control group.
Our study presents a significant relationship between the qCT parameters and the Lung Function Test in the group of patients with asthma. LA and ID positively correlate with FEV1 and FVC (p < 0.05). A negative, weak correlation of the LA and ID with the airway’s resistance was observed except the fifth and eighth generations (p = 0.003). Values of the correlation coefficients are listed in Table 5. There was no statistically significant correlation between PEF and qCT parameters.
Table 5.
Correlation between LA and ID and selected lung function tests in the group of patients with asthma.
| Parameter | n | FEV1 (Litre) |
ROCC (kPa × s/Litre) |
||
|---|---|---|---|---|---|
| r-value | p value | r-value | p value | ||
| LA3 | 70 | 0.2972 | 0.0078 | −0.2312 | 0.0474 |
| LA4 | 70 | 0.3601 | 0.001 | −0.2925 | 0.0109 |
| LA5 | 70 | 0.3122 | 0.0048 | ns | ns |
| LA6 | 70 | 0.2765 | 0.013 | −0.3359 | 0.0032 |
| LA7 | 64 | 0.2345 | 0.0388 | −0.2959 | 0.0105 |
| LA8 | 54 | 0.2931 | 0.0161 | ns | ns |
| LA9 | 38 | 0.4018 | 0.0032 | −0.3843 | 0.0064 |
| ID3 | 70 | 0.2937 | 0.0082 | −0.2489 | 0.0313 |
| ID4 | 70 | 0.3982 | 0.0003 | −0.2972 | 0.0096 |
| ID5 | 70 | 0.3364 | 0.0023 | −0.1033 | 0.3779 |
| ID6 | 70 | 0.3248 | 0.0033 | −0.3163 | 0.0057 |
| ID7 | 67 | 0.2613 | 0.0209 | −0.2791 | 0.0161 |
| ID8 | 57 | 0.2975 | 0.0145 | ns | ns |
| ID9 | 40 | 0.3461 | 0.012 | −0.3731 | 0.0083 |
3–9, following generations of the bronchial tree; ID, inner diameter; LA, lumen area; ns, not significant; r-value, Spearman’s rank correlation coefficient; Rocc, respiratory resistance.
Correlation coefficients were calculated with Spearman’s rank correlation coefficient, p values of < 0.05 were considered significant.
The Bland–Altman test revealed small intraobserver bias between measurements of the WT3-WT5. The reproducibility graphs are presented in Figure 5.
Figure 5.
Bland–Altman plots of wall thickness measurements agreement (a) WT 3; (b) WT 4; and (c) WT 5.
Discussion
The use of 128-slice computed tomography scanners and advanced post-processing software enables us to obtain quantitative data of the airway up to the ninth generation of the bronchial tract, which is a considerable improvement.9,11 Most of the previous studies focusing on the parameters in obstructive airway diseases involved measurements of proximal airways – up to the sixth generation.4,6,10,14 Li and colleagues in the study investigating sex-related differences in COPD, using CT with automatic measurements, extracted bronchi up to the seventh generation.15 The median values of WT from the fifth to the seventh generations observed in our study were slightly higher than those reported in the study by Li and colleagues. This result could be associated, first, with the ethnic differences, second, with the different post-processing software used, and third, with the different patient characteristics.
Our study presents a significantly higher value of WT in all assessed bronchial generations and a larger WA4%–WA9% in patients with asthma than in the control group. Similar results were reported in other studies, but mainly within the proximal airways.16–18 Gono and colleagues compared normal, healthy subjects with two groups of asthmatic patients – symptomatic and asymptomatic – using high-resolution CT. They showed significant differences in WT, WA%, and WA of the right B1 segmental bronchus in the symptomatic group.19 The analysis of the airway dimensions in the chest using multidetector CT scans was performed in 2009 by Hoshino and colleagues. They reported differences in patients with asthma of different degrees of severity. A significant correlation between CT airway parameters and lung function tests was stated. The authors suggested that the airflow limitations could be associated mostly with the distal bronchi.10 We found that the LA and ID from the seventh to the ninth generations were significantly smaller in the examined group than in the control group, whereas there were no significant differences in proximal airways. Moreover, we described the relationship between LA, ID and LFTs – mainly FEV1 – and we noticed that the correlation coefficients tend to increase with more distal bronchi. We also found a negative, weak correlation of the LA and the ID with the airway’s resistance value, except for the fifth and eighth generations.
We hypothesise that a combination of airway thickness assessment and adequately adjusted treatment can result in the optimisation of asthma management, the formulation of the most efficient treatment algorithms and minimize the side effects of therapy in future.
There were several potential limitations of our study. First, we did not discriminate patients according to asthma severity. Some essential differences might potentially be noticed.10 Second, we performed measurements only in the posterior basal bronchus of the right lung (B10), assuming that the distribution of changes in the airways should be regular in both lungs. Third, the image analysis was performed by only one observer. The inter observer evaluations for the further studies may be more objective. Owing to the scanning protocol (only full-inspire CT scans), we did not perform the assessment of lung densitometry. Dose reduction protocols were enabled in this study, which resulted in different radiation parameters for each patient.
Conclusion
The study showed increased airway thickness in patients with asthma compared with healthy volunteers. More changes were noticed in the medium, and small airways (fifth to the ninth generation of the bronchi). The correlations revealed between qCT and LFT indicate the usefulness of the imaging techniques and their post-processing methods in the diagnosis and management of asthma. Further studies on the relationship between airway thickness, airflow limitation, severity of asthma and different treatment algorithms will possibly bring further improvement in asthma management and prognosis.
Supplemental Material
Supplemental material, Author_response_to_reviewer_comments for Airway wall thickness and airflow limitations in asthma assessed in quantitative computed tomography by Mateusz Patyk, Andrzej Obojski, Dąbrówka Sokołowska-Dąbek, Martyna Parkitna-Patyk and Urszula Zaleska-Dorobisz in Therapeutic Advances in Respiratory Disease
Supplemental material, Reviewer_1_v.1 for Airway wall thickness and airflow limitations in asthma assessed in quantitative computed tomography by Mateusz Patyk, Andrzej Obojski, Dąbrówka Sokołowska-Dąbek, Martyna Parkitna-Patyk and Urszula Zaleska-Dorobisz in Therapeutic Advances in Respiratory Disease
Supplemental material, Reviewer_1_v.2 for Airway wall thickness and airflow limitations in asthma assessed in quantitative computed tomography by Mateusz Patyk, Andrzej Obojski, Dąbrówka Sokołowska-Dąbek, Martyna Parkitna-Patyk and Urszula Zaleska-Dorobisz in Therapeutic Advances in Respiratory Disease
Supplemental material, Reviewer_2_v.1 for Airway wall thickness and airflow limitations in asthma assessed in quantitative computed tomography by Mateusz Patyk, Andrzej Obojski, Dąbrówka Sokołowska-Dąbek, Martyna Parkitna-Patyk and Urszula Zaleska-Dorobisz in Therapeutic Advances in Respiratory Disease
Supplemental material, Reviewer_2_v.2 for Airway wall thickness and airflow limitations in asthma assessed in quantitative computed tomography by Mateusz Patyk, Andrzej Obojski, Dąbrówka Sokołowska-Dąbek, Martyna Parkitna-Patyk and Urszula Zaleska-Dorobisz in Therapeutic Advances in Respiratory Disease
Acknowledgments
The authors wish to thank Małgorzata Rąpała for checking and correction of the statistical analysis. The authors made the following contributions to this manuscript: conception and design: MP, AO and UZD, collecting data: MP, AO, and MPP, analysis and interpretation: MP, AO, DSD, and UZD; statistical analysis: MP, MPP, drafting the manuscript: MP, AO.
Footnotes
Funding: The author(s) disclosed receipt of the following financial support for the research, authorship, and/or publication of this article: This work was supported by the Polish Ministry of Science and Higher Education - Diamond Grant Award (grant registration number DI 2013 018143).
Conflict of interest statement: The authors declare that there is no conflict of interest.
ORCID iD: Mateusz Patyk  https://orcid.org/0000-0001-7316-1890
All relevant data are within the paper and its Supporting Information files.
Supplemental material: The reviews of this paper are available via the supplemental material section.
Contributor Information
Mateusz Patyk, Department of General and Paediatric Radiology, Wroclaw Medical University, Wroclaw, Poland.
Andrzej Obojski, Department of Internal Diseases, Pneumology and Allergology, Wroclaw Medical University, Curie-Skłodowskiej 68, Wroclaw 50-369, Poland.
Dąbrówka Sokołowska-Dąbek, Department of General and Paediatric Radiology, Wroclaw Medical University, Wroclaw, Poland.
Martyna Parkitna-Patyk, Department of Conservative Dentistry and Pedodontics, Wroclaw Medical University, Wroclaw, Poland.
Urszula Zaleska-Dorobisz, Department of General and Paediatric Radiology, Wroclaw Medical University, Wroclaw, Poland.
References
- 1. Shimizu K, Hasegawa M, Makita H, et al. Comparison of airway remodelling assessed by computed tomography in asthma and COPD. Respir Med 2011; 105: 1275–1283. [DOI] [PubMed] [Google Scholar]
- 2. Chung KF, Wenzel SE, Brozek JL, et al. International ERS/ATS guidelines on definition, evaluation and treatment of severe asthma. Eur Respir J 2014; 43: 343–373. [DOI] [PubMed] [Google Scholar]
- 3. Adams JE. Quantitative computed tomography. Eur J Radiol 2009; 71: 415–424. [DOI] [PubMed] [Google Scholar]
- 4. Shim SS, Schiebler ML, Evans MD, et al. Lumen area change (Delta Lumen) between inspiratory and expiratory multidetector computed tomography as a measure of severe outcomes in asthmatic patients. J Allergy Clin Immunol 2018; 142: 1773–1780.e9. [DOI] [PMC free article] [PubMed] [Google Scholar]
- 5. Tashkin DP, Kim HJ, Zeidler M, et al. Evaluating small-airways disease in asthmatic patients: the utility of quantitative computed tomography. J Allergy Clin Immunol 2017; 139: 49–51.e2. [DOI] [PubMed] [Google Scholar]
- 6. Grenier PA, Fetita CI, Brillet P. Quantitative computed tomography imaging of airway remodeling in severe asthma. Quant Imaging Med Surg 2016; 6: 76–83. [DOI] [PMC free article] [PubMed] [Google Scholar]
- 7. Niimi A, Matsumoto H, Takemura M, et al. Clinical assessment of airway remodeling in asthma: utility of computed tomography. Clin Rev Allergy Immunol 2004; 27: 45–58. [DOI] [PubMed] [Google Scholar]
- 8. Pepe C, Foley S, Shannon J, et al. Differences in airway remodeling between subjects with severe and moderate asthma. J Allergy Clin Immunol 2005; 116: 544–549. [DOI] [PubMed] [Google Scholar]
- 9. Berair R, Hartley R, Mistry V, et al. Associations in asthma between quantitative computed tomography and bronchial biopsy-derived airway remodelling HHS public access. Eur Respir J 2017; 49: 160150. [DOI] [PMC free article] [PubMed] [Google Scholar]
- 10. Hoshino M, Matsuoka S, Handa H, et al. Correlation between airflow limitation and airway dimensions assessed by multidetector CT in asthma. Respir Med 2010; 104: 794–800. [DOI] [PubMed] [Google Scholar]
- 11. Hartley RA, Barker BL, Newby C, et al. Relationship between lung function and quantitative computed tomographic parameters of airway remodeling, air trapping, and emphysema in patients with asthma and chronic obstructive pulmonary disease: a single-center study. J Allergy Clin Immunol 2016; 137: 1413–1422. [DOI] [PMC free article] [PubMed] [Google Scholar]
- 12. Tsurikisawa N, Oshikata C, Tsuburai T, et al. Bronchial hyperresponsiveness to histamine correlates with airway remodelling in adults with asthma. Respir Med 2010; 104: 1271–1277. [DOI] [PubMed] [Google Scholar]
- 13. Bateman ED, Hurd SS, Barnes PJ, et al. Global strategy for asthma management and prevention: GINA executive summary. Eur Respir J 2008; 31: 143–178. [DOI] [PubMed] [Google Scholar]
- 14. van den Berge M, Ten Hacken NHT, Cohen J, et al. Small airway disease in asthma and COPD: clinical implications. Chest 2011; 139: 412–423. [DOI] [PubMed] [Google Scholar]
- 15. Li Y, Dai YL, Yu N, et al. Sex-related differences in bronchial parameters and pulmonary function test results in patients with chronic obstructive pulmonary disease based on three-dimensional quantitative computed tomography. J Int Med Res 2018; 46: 135–142. [DOI] [PMC free article] [PubMed] [Google Scholar]
- 16. Niimi A, Matsumoto H, Amitani R, et al. Airway wall thickness in asthma assessed by computed tomography: relation to clinical indices. Am J Respir Crit Care Med 2000; 162: 1518–1523. [DOI] [PubMed] [Google Scholar]
- 17. Hasegawa M, Nasuhara Y, Onodera Y, et al. Airflow limitation and airway dimensions in chronic obstructive pulmonary disease. Am J Respir Crit Care Med 2006; 173: 1309–1315. [DOI] [PubMed] [Google Scholar]
- 18. Aysola RS, Hoffman EA, Gierada D, et al. Airway remodeling measured by multidetector CT is increased in severe asthma and correlates with pathology. Chest 2008; 134: 1183–1191. [DOI] [PMC free article] [PubMed] [Google Scholar]
- 19. Gono H, Fujimoto K, Kawakami S, et al. Evaluation of airway wall thickness and air trapping by HRCT in asymptomatic asthma. Eur Respir J 2003; 22: 965–971. [DOI] [PubMed] [Google Scholar]
Associated Data
This section collects any data citations, data availability statements, or supplementary materials included in this article.
Supplementary Materials
Supplemental material, Author_response_to_reviewer_comments for Airway wall thickness and airflow limitations in asthma assessed in quantitative computed tomography by Mateusz Patyk, Andrzej Obojski, Dąbrówka Sokołowska-Dąbek, Martyna Parkitna-Patyk and Urszula Zaleska-Dorobisz in Therapeutic Advances in Respiratory Disease
Supplemental material, Reviewer_1_v.1 for Airway wall thickness and airflow limitations in asthma assessed in quantitative computed tomography by Mateusz Patyk, Andrzej Obojski, Dąbrówka Sokołowska-Dąbek, Martyna Parkitna-Patyk and Urszula Zaleska-Dorobisz in Therapeutic Advances in Respiratory Disease
Supplemental material, Reviewer_1_v.2 for Airway wall thickness and airflow limitations in asthma assessed in quantitative computed tomography by Mateusz Patyk, Andrzej Obojski, Dąbrówka Sokołowska-Dąbek, Martyna Parkitna-Patyk and Urszula Zaleska-Dorobisz in Therapeutic Advances in Respiratory Disease
Supplemental material, Reviewer_2_v.1 for Airway wall thickness and airflow limitations in asthma assessed in quantitative computed tomography by Mateusz Patyk, Andrzej Obojski, Dąbrówka Sokołowska-Dąbek, Martyna Parkitna-Patyk and Urszula Zaleska-Dorobisz in Therapeutic Advances in Respiratory Disease
Supplemental material, Reviewer_2_v.2 for Airway wall thickness and airflow limitations in asthma assessed in quantitative computed tomography by Mateusz Patyk, Andrzej Obojski, Dąbrówka Sokołowska-Dąbek, Martyna Parkitna-Patyk and Urszula Zaleska-Dorobisz in Therapeutic Advances in Respiratory Disease


