Abstract.
Free tissue transfer (FTT) surgery for breast reconstruction following mastectomy has become a routine operation with high success rates. Although failure is low, it can have a devastating impact on patient recovery, prognosis, and psychological well-being. Continuous and objective monitoring of tissue oxygen saturation () has been shown to reduce failure rates through rapid detection time of postoperative vascular complications. We have developed a pervasive wearable wireless device that employs near-infrared spectroscopy (NIRS) to continuously monitor FTT via measurement. Previously tested on different models, the results of a clinical study are introduced. Our goal for the study is to demonstrate that the developed device can reliably detect variations in a clinical setting: 14 patients were recruited. Advanced data analysis was performed on the variations, the relative gradient change, and the classification of the within different clusters of blood occlusion level (from 0% to 100% at 25% step) based on previous studies made on a vascular phantom and animals. The outcomes of the clinical study concur with previous experimental results and the expected biological responses. This suggests that the device is able to correctly detect perfusion changes and provide real-time assessment on the viability of the FTT in a clinical setting.
Keywords: spectroscopy, near-infrared spectroscopy, free tissue transfer, breast reconstruction surgery, wearable device, internet of things
1. Introduction
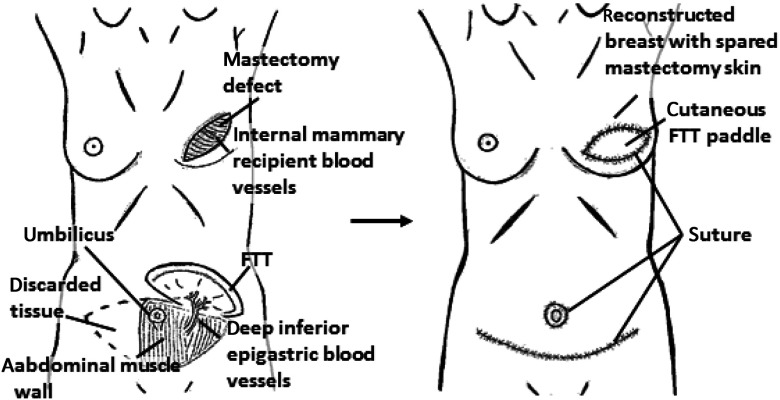
Free tissue transfer (FTT) surgery is commonly performed following trauma or cancer to reconstruct defects. Focusing on breast reconstruction after mastectomy, the autologous FTT consists in harvesting soft tissue, including blood vessels, from a distant body region, and anastomosis to the recipient area for reconstruction (see Fig. 2). The anastomosis involves the suturing of at least a pair of blood vessels (vein and artery) onto the recipient site. FTT survival depends on the patency of the blood vessels following the anastomosis. Compromised blood flow of the vein or/and artery reduces normal perfusion of oxygen and nutrients within the tissue, which will induce necrosis. FTT vascular complications (VCs) have mainly been reported within the first 24 to 48 h after surgery, with an increased rate within the first 4 h following the anastomosis.1 Thrombosis at the venous pedicle causes congested tissue, often inducing hematoma. Thrombosis of the artery causes very pale hypoperfused tissue.2 Early detection and intervention of a VC can allow partial or complete salvation of the tissue. To prevent complete FTT failure and allow early detection, close postoperative monitoring is crucial. Although there are no standardized methods, this is often done with clinical observations, which consist of discrete and regular kinetic and visual assessments of the FTT (e.g., tissue color and texture, skin turgor, and capillary refill time).3 However, early detection of a VC also requires experience and the clinical team cannot continuously observe the patient. Owing to the discrete assessments, methods for continuous monitoring based on the biophysical and biochemical properties of tissue have been developed to ensure early detection of VC and, if needed, prompt intervention from the clinical team.
Fig. 2.
Schematic representations of harvesting and suturing processes of the DIEP FTT operation for breast reconstruction following mastectomy.
Microdialysis and tissue oxygen tension are continuous monitoring methods that use chemical reactions to deduce the health of the monitored tissue. These are implantable probes that are placed close to the FTT to detect small variations of concentration of the investigated chemicals, which allow early detection of VC in the case of abnormal relative chemical concentrations. However, the lack of detailed and large studies investigating their sensitivity and efficiency over different surgery types; patients’ demographics; and potential risks, costs, and practical usability or limitations reduce its acceptability.4,5 The long setup time and recalibration with chemical solutions can also limit its routine use.4,5 The Doppler effect has been used to monitor blood perfusion changes. It has been embodied within different modalities: as an implantable probe and as a handheld device. Although the implantable Doppler has shown to be highly sensitive in detecting FTT VC, the best practice for its placement around the pedicle and the learning curve within the clinical team are still an issue.6–8 Similarly, the manipulation of the handheld Doppler device is operator-dependent and is sensitive to motion with an unknown penetration depth. Spectroscopy has also been used with near-infrared wavelengths to continuously monitor the concentration variations of different hemoglobin compounds to deduce the relative oxygen saturation in an area of tissue (). Studies have shown that near-infrared spectroscopy (NIRS) devices detect FTT VC early with high sensitivity.9 However, the current devices have often overlooked the variations of NIRS results among patients with different demographics [e.g., age, sex, body mass index (BMI), skin color and thickness, smoking or alcohol intake, or physical activity level) and comorbidities (e.g., vascular diseases or diabetes), leading to erroneous interpretation of outcomes.10–16 These continuous monitoring devices are commercially available but have limitations and do not provide complete practical benefit for both the patients and the clinical team.3
We have developed a compact wireless wearable device using NIRS that reliably measures the independent of the patient’s demographics.2,17 Previously validated with phantom, animal, and healthy human studies, the results show that the device can distinguish venous from arterial blood and different levels of venous occlusion for detection of FTT VC.17,18 his paper introduces the results of the clinical study for postoperative FTT monitoring in the case of breast reconstruction using our developed NIRS device. In addition to showing the device suitability for the clinical setting, it is demonstrated that it can adequately detect variations. The use of advanced data analysis provides further real-time and predictive insight on the tissue viability.
2. Device Description
We have developed a wireless wearable device that connects with a tablet for real-time data visualization and remote access.19–21 The device has been designed to continuously monitor in soft living tissue independently of the patient’s demographics. Using spectroscopy, which is the study of the interaction of a given wavelength light with a given environment, properties and composition of the environment can be deduced. When using near-infrared light spectrum on a tissue environment, relative hemoglobin compounds can be measured to deduce ; in particular, oxygenated hemoglobin () and deoxygenated hemoglobin (HHb) can be measured respectively using 520 to 600 nm or 620 to 780 nm and 800 to 1000 nm wavelength ranges. The equations are derived as follows:
| (1) |
where THb is the total hemoglobin, which is estimated as
| (2) |
where and are the nonsignificant errors, and is a calibration coefficient for hardware and/or software specifications of the device. Although, other hemoglobin compounds exist, it is assumed that their concentration is insignificant compared to that of and HHb and so their cumulative effect is not explicitly modeled (included in ).
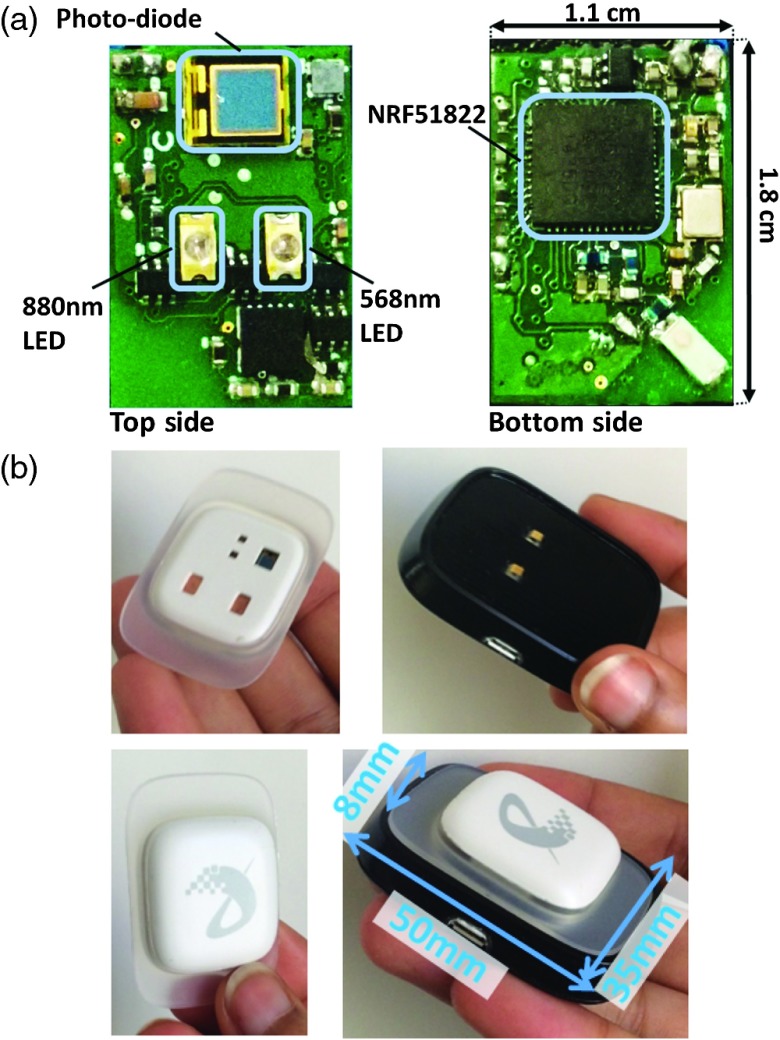
Figure 1(a) shows the electronic board, which has been made waterproof and is embodied within a biocompatible material casing for its use in a clinical setting. The patch-embodied device can be recharged using a designed docking station [see Fig. 1(b)].
Fig. 1.
Views of the device. (a) Top and bottom views of the electronic board of the device for continuous monitoring.17 (b) Top and bottom view of the patch-embodied device (left top and bottom pictures) coming with its charging station (right top and bottom pictures).
The embedded software of the device is based on a closed-loop system allowing self-calibration, independent of the environment conditions or patient’s demographics.17 The device has also been designed to self-recover data, calibration parameters, and communication connections in the cases of lost communication, mobile application, or/and embedded software crash.
The sampling and communication rates are at 0.25 Hz, which allow a battery life of 30 to 40 h, depending on the calibration parameters, using a lithium-polymer battery at 3.7 V, 80 mAh. The sampling rate has been optimized to provide a sufficient battery life without losing too much data information. At this rate, 900 data points are recorded per hour, giving about 1Mo of data per 24 h. The sampling rate and the number of data points are sufficient to perform rigorous statistical analysis and data interpretation.
3. Method
Following ethical approval (REC:16/LO/1584), the clinical study, from which results are reported here, took place at Charing Cross Hospital, Imperial College Healthcare NHS Trust. The goal of the study is to show that the device can adequately measure variations on FTT for 48 h and be suitable for use within the clinical setting.
3.1. Protocol
Over a 6-month period, patients were approached if they were scheduled to undergo a deep inferior epigastric perforator (DIEP) FTT surgery for immediate or delayed breast reconstruction (see Fig. 2). Following written consent, the patients were enrolled in the study. At the end of the reconstructive surgery, once the patient was ready to go to recovery, the device was placed on the cutaneous paddle of the FTT, independent to its relative position on the mastectomy defect. The casing is attached with a medical skin adhesive tape from Softleaves. Therefore, the anastomosis was performed between 2 and 3 h prior to the start of the monitoring. The measurements were undertaken for about 48 h in total. Following ethical guidelines, the clinical team was not allowed access to the real-time results before the discharge of the patient to avoid affecting outcomes. During the use of the device, conventional clinical monitoring, including the use of a handheld acoustic Doppler, was regularly performed, once every 30 min for the first 6 postoperative hours, every hour for the next 24 h, every 2 h for the next 12 h, and finally every 4 h until discharged, inline with the departmental protocols. Vitals including diastolic and systolic blood pressure (mmHg), heart rate (BPM), respiratory rate (BPM), and peripheral capillary oxygen saturation () were also recorded during the regular assessments. Patient’s demographics including age, BMI, sex, skin tone (following the dermatology Fitzpatrick scale2), smoking and alcohol consumptions, and, physical activity level were also recorded (see Table 1).
Table 1.
Patients’ demographics.
| PID | Age | BMI | ST | FS | AC | PA | MW | FW |
|---|---|---|---|---|---|---|---|---|
| 1 | 49 | IV | VI | I | II | I | — | 894 |
| 2 | 41 | II | II | I | I | II | 214 | 291 |
| 3 | 57 | III | II | I | II | II | 693 | 755 |
| 4 | 57 | IV | IV | I | I | III | NA | 759 |
| NA | 741 | |||||||
| 5 | 40 | III | III | V | III | II | — | 628 |
| 6 | 39 | IV | VI | I | I | I | — | 867 |
| 7 | 64 | III | VI | I | I | IV | 806 | 626 |
| 8 | 50 | III | IV | I | II | III | 418 | 612 |
| 9 | 52 | II | III | I | III | III | 158 | 268 |
| 10 | 43 | IV | I | I | I | III | 280 | 362 |
| 11 | 46 | II | II | I | I | V | 490 | 648 |
| 12 | 53 | II | II | I | III | III | — | 493 |
| 13 | 51 | II | II | I | I | III | 370 | 263 |
| 536 | 269 | |||||||
| 14 | 51 | IV | V | V | I | I | 404 | 606 |
Note: PID, patient identification number; BMI, body mass index; which can be I = underweight (), II = healthy (between 18.5 and 24.9), III = overweight (between 25 and 29.9) or IV = obese (); FS, skin tone that follows the Fitzpatrick scale and are I: red/blonde hair, green eyes, and very light skin, II: light/medium colored hair, eyes, and skin, III: medium colored hair, medium to dark eyes, and medium to olive skin, IV: dark hair and eyes and dark olive to light brown skin, V: dark hair, eyes and skin, and VI: dark hair, eyes, and very dark skin;2 SC, smoking consumption, scaled from I to V, with I = nonsmoker, II = less than two cigarettes a week, III = two to five cigarettes a week, IV = five to seven cigarettes a week, V = more than seven cigarettes a week; AC, alcohol consumption; scaled from I to V, with I = nondrinker, II = less than two drinks a week, III = two to five drinks a week, IV = five to seven drinks a week, V = more than seven drinks a week; PA, physical activity level; scale from I to V, with I = sedentary, a week, III = 2 to 5 h a week, IV = 5 to 7 h a week, a week; MW, mastectomy tissue weight in grams; FW, free tissue weight in grams; NA, not available.
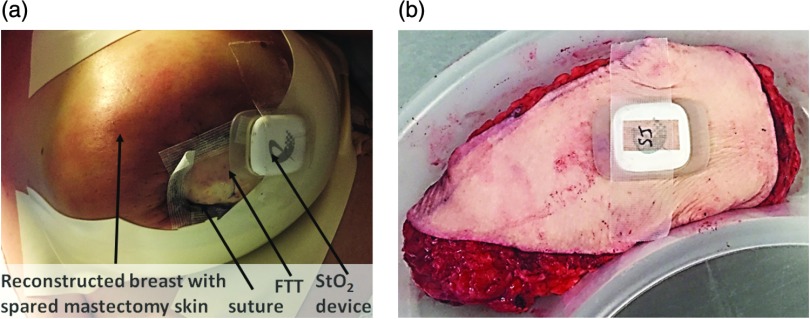
As no FTT VC happened during the trial, freshly excised discarded tissue from the FTT was monitored. The excised tissue behaved similarly as an FTT with a VC. Within 5 min of being excised, a device was placed on the discarded tissue for about 3 h [see Fig. 3(b)]. At the end of the monitoring time, the tissue was disposed following hospital guidelines.
Fig. 3.
Setup of the patch-embodied device during the clinical trial. (a) Setup of the patch-embodied device on the cutaneous paddle of the FTT after breast reconstructive surgery. (b) Setup of the patch-embodied device on human excised discarded tissue—the piece of tissue excluded from the FTT is used to reconstruct the breast defect.
3.2. Patients
A total of 14 patients consented to participate in the study, with 2 patients (ID = 4 and ID = 13) undergoing a bilateral operation; a total of 16 datasets of 48 h of measurements were obtained. Patients 1, 5, 6, and 12 had a delayed reconstruction following mastectomy; all the other patients underwent an immediate reconstruction following mastectomy (see Table 1). The reconstructions were performed either by FH, JH, NJ, or SW. All patients had a successful FTT and showed no complications within the first 48 postoperative hours.
Table 1 shows the patients demographics. Recruited patients were on average 49.5 () years old, with a BMI being in the normal range at 35.7% (), overweight at 28.6% (), and obese at 35.7% (), and a skin tone scaled at I for 7.1% (), at II for 35.7% (), at III and IV for 14.3% (), at V for 7.1% (), and at VI for 21.4% (), according to the Fitzpatrick scale. Most patients were nonsmokers at 85.7% () and the remaining were heavy smokers. Most patients abstained from alcohol at 57.1% (). In terms of physical activity level, 42.8% () exercised 2 to 5 h a week, 14.2% () did a week, and the remaining patients were either sedentary or did of physical activity a week (see Table 1).
3.3. Data Analysis
Each raw dataset was retrieved and analyzed offline. To further ease visualization of the percentage over time, an estimation is performed. To do so, every 3 h, a 2-min data point window, called , is averaged
| (3) |
where , in this case, is the 2-min window, , , denotes the total number of points within the 2-min window, and denotes the time. The difference between two successive points gives the differential of over the 3 h, called
| (4) |
where is the index of the differential of ; . This provides an estimation of the rate of percentage change over time. In addition, a gradient in the differentials over two successive time windows, called , is also calculated. It allows observing how much differential has evolved
| (5) |
where , , is the index of the gradient of the differentials. The 3 h and 2 min time windows are chosen empirically for ease in the visualization, as in Fig. 4, but can be changed to any time window without affecting the final results. Finally, the mean calculated every 30-min window, called , is obtained using the equivalent of Eq. (3). It scales between 35%, appearing in dark blue, and 95%, appearing in bright yellow.
Fig. 4.
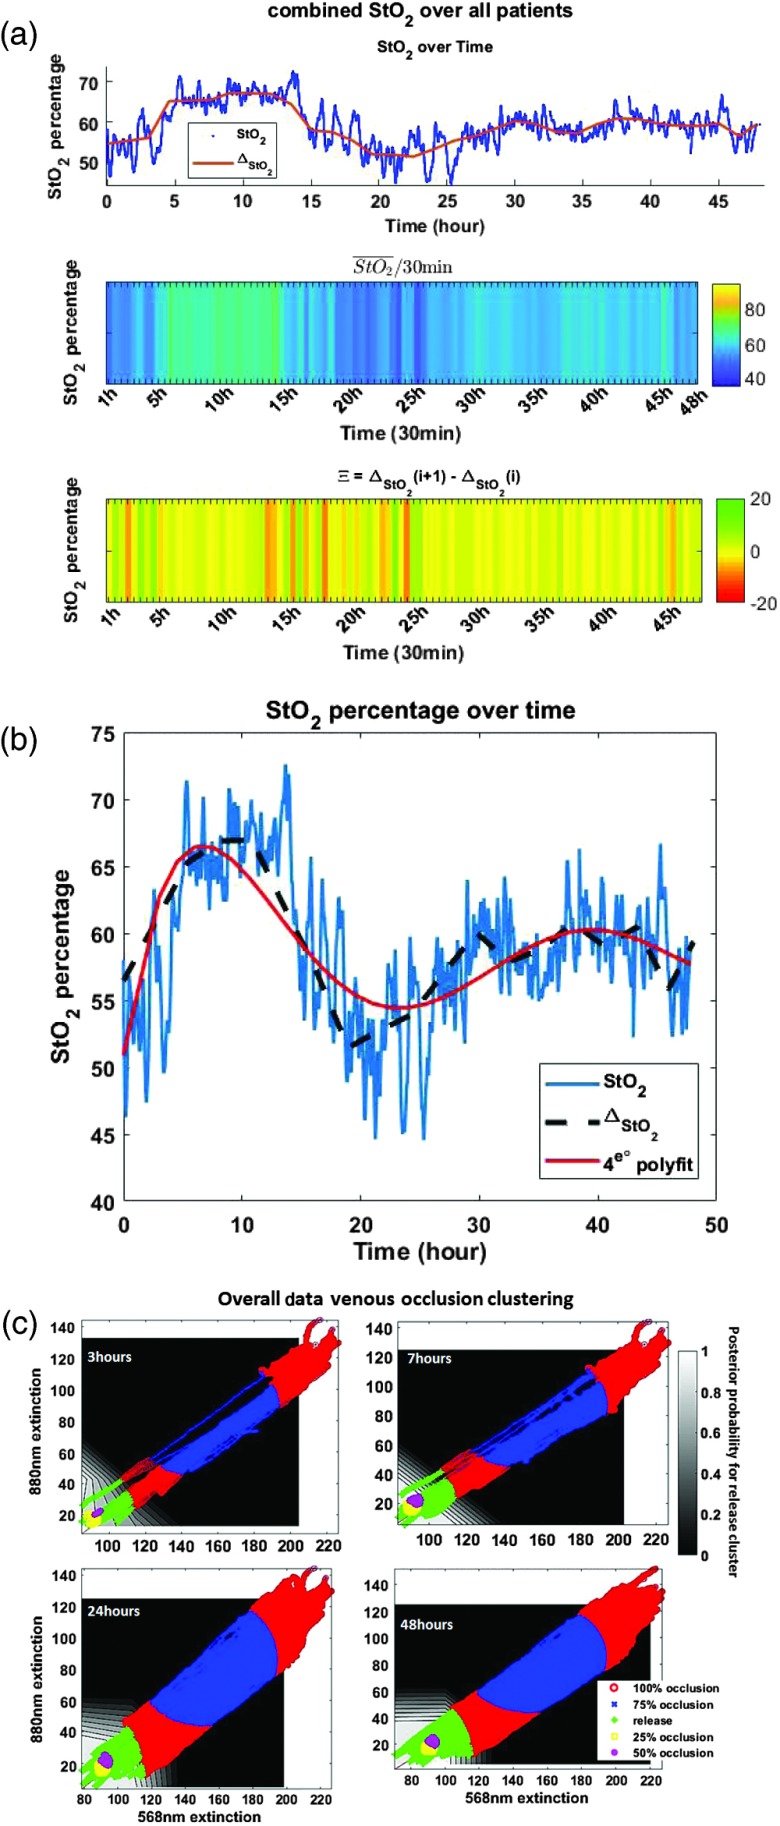
percentage and naive Bayes classification results using overall patients’ data. After time synchronization of all datasets, data are analyzed and processed. (a) percentage results using the combined datasets of all patients. (b) Combined results of all patients. (c) Naive Bayes classification using the combined and HHb datasets of all patients.
Previous work on the detection of partial occlusion using synthetic blood and a vascular phantom had been carried out by emulating 0% (release) to 100% blood occlusion levels at 25% steps.2,17 These results show that it is possible to distinguish low from high occlusion levels of percentage with a two-dimensional naive Bayesian classifier based on 568- and 880-nm light extinctions.17 Equation (6) derives the naive Bayes classifier’s theorem, with the parameters for each class shown in Table 2, as follows:
| (6) |
where is the class , = {0% occlusion (or release), 25% occlusion, 50% occlusion, 75% occlusion, 100% occlusion}, and are the classifiers’ dimensions, which are HHb and based on the light extinctions, is a normalizing constant, is the prior probability of an observation to be part of class , is the variance of the Gaussian distribution of class , and is the mean of the Gaussian distribution of class (see Table 2). Although quantifying the percentage level of occlusion in a blood vessel is impossible in an uncontrolled clinical setting, as blood vessel occlusion is believed to progressively occur,22,23 quantifying the approximate blood occlusion level could assist in the early detection of FTT VC. After being retrieved, the percentage data acquired on patients are separately placed within the trained classifier for quantification of the blood vessel occlusion level. The results of the excised discarded tissue are calculated using Eqs. (1) and (4).
Table 2.
Gaussian parameters for the naive Bayes classifier of the partial venous occlusion distinction.
| Classes | Parameters (k) | ||
|---|---|---|---|
| Mean () | std () | ||
| 0% occlusion | 91.166 | 4.489 | 0.4 |
| 25% occlusion | 90.809 | 2.523 | 0.2 |
| 50% occlusion | 92.103 | 2.299 | 0.13 |
| 75% occlusion | 155.173 | 15.302 | 0.19 |
| 100% occlusion | 158.336 | 20.899 | 0.06 |
Note: Std, standard deviation; , prior probability of the classification; , {0% occlusion, 25% occlusion, 50% occlusion, 75% occlusion, 100% occlusion}.17
4. Results
Figure 4(a) illustrates the results of all the patients’ datasets; the datasets are time-synchronized. is a differential performed at a regular time interval to provide an estimation of the percentage. The shows the evolution of the percentage for every 30-min window. Displayed with a colored matrix, dark blue is 40% and light yellow is 95% . The is a gradient that shows the evolution of the differentials over time. Displayed with a colored matrix, red is , amber is 0%, and green is of percentage change, compared with the previous differential. The gradient, , shows a steady percentage evolution with no notable change between successive differentials; yellow cells are often consecutive. When the percentage decreases over a few hours (especially visible with ), the does not notably negatively change for the same amount of time. This is also similar in the case of percentage increase. This suggests that with , dramatic percentage decrease would be characterized by many consecutive dark red cells.
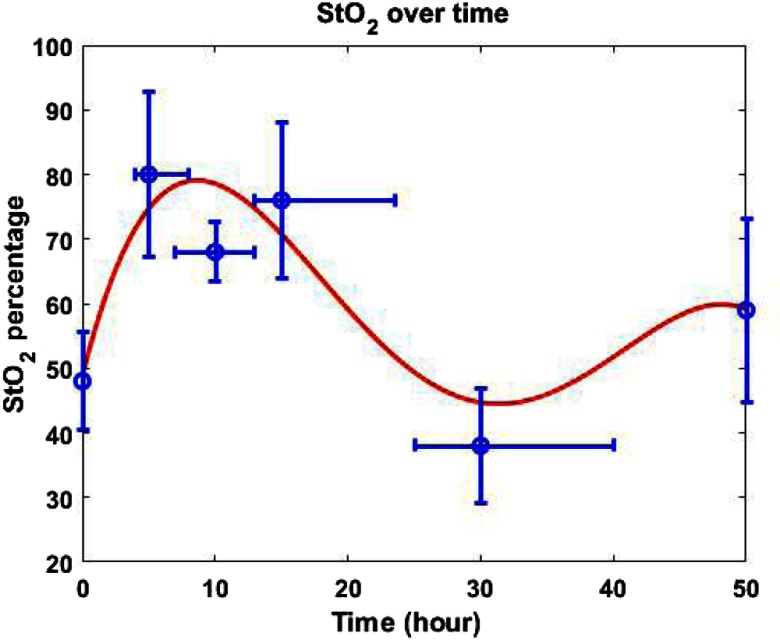
When looking at each patient dataset separately, the percentage increases within the first 24 postoperative hours (on average at , with an average percentage). Also, before the percentage increases, it slightly decreases (average ). In general, the percentage remains above 20% during the first 48 postoperative hours (minimum average percentage is and the maximum average percentage is ), with final values above 70% (average percentage) and which are also above the initial percentage (average percentage). Figure 5 shows the mentioned points with the ranges in time and percentage in blue; the red curve is the 4-deg polynomial fit of the points. It provides a general pattern of the percentage evolution over time.
Fig. 5.
Fitted pattern of the average results of all patients with a 4-deg polynomial fit.
Figure 4(b) also shows a 4-deg polynomial fit over the points from all datasets combined and synchronized. All combined datasets and the resulting polynomial fit have a similar shape. Taken separately, each percentage dataset has a similar polynomial fit. Table 3 shows the coefficients of the polynomial fit of the percentage taken for each patients, the combined datasets, and the fitted pattern.
Table 3.
Coefficients of the polynomial fit of the datasets.
| dataset ID | |||||
|---|---|---|---|---|---|
| 1 | 3 | 6.1064 | 50.5524 | ||
| 2 | 12 | 6.881 | 5.7266 | ||
| 3 | 2.8 | 0.951 | 50.3069 | ||
| 4 | 5.8 | 0.8802 | 48.6621 | ||
| 5 | 0 | 1.5 | 0.7655 | 50.9731 | |
| 6 | 40.5 | 2.7363 | 50.8872 | ||
| 7 | 1 | −2.5 | 0.4956 | 52.5724 | |
| 8 | 7 | −20.2 | 2.093 | 0.4914 | 49.2953 |
| 9 | 22.0 | 2.5699 | 46.4645 | ||
| 10 | -5.5 | 2.223 | 58.9165 | ||
| 11 | 19.0 | 3.1210 | 45.7532 | ||
| 12 | 10.8 | 1.4691 | 38.5091 | ||
| 13 | 0 | 4.2 | 1.0991 | 60.6927 | |
| 14 | 35.6 | 2.6641 | 46.7815 | ||
| 15 | 11 | 0.525 | 1.2129 | 50.31287 | |
| 16 | 12.4 | 0.5980 | 50.6841 | ||
| Averaged coefficients synchronized | 6.2 | 1.1452 | 47.3182 | ||
| Data | 29.6 | 5.6842 | 50.9053 | ||
| Fitted pattern | 18.5 | 8.1902 | 48.7902 |
The 4-deg polynomial fit is derived as , with .
Using the Bayesian classifier trained with data from different partial venous occlusion levels emulated with synthetic venous blood and a vascular phantom [see Eq. (6) and Table 2], the acquired data of all patients, taken at different postoperative hours, were separately placed within the trained classifier. Figure 4(c) shows the occlusion-level classification of the data, with the posterior probability of the data to be attributed to the 0% occlusion level (or release) class, taken at postoperative hours 3, 7, 24, and 48. Results show that in the early postoperative hours the data are more clustered in the higher occlusion levels, whereas data acquired later are shifted to the lower occlusion levels with an increased posterior probability of an observation to be clustered in the 0% occlusion (release) class.
Using the vitals taken at regular intervals during the 48 h of monitoring, the correlation coefficients of the percentage and, respectively, the blood pressure (based on the average of the systolic and diastolic blood pressure—average ), the heart rate (average ), the respiratory rate (average ), and the arterial oxygenation (average ) were analyzed.
In general, for all patients, the disconnection time between the device and the tablet was (average ) over the total 48 h monitoring time. The lost data were extrapolated and did not affect the final data analysis results.
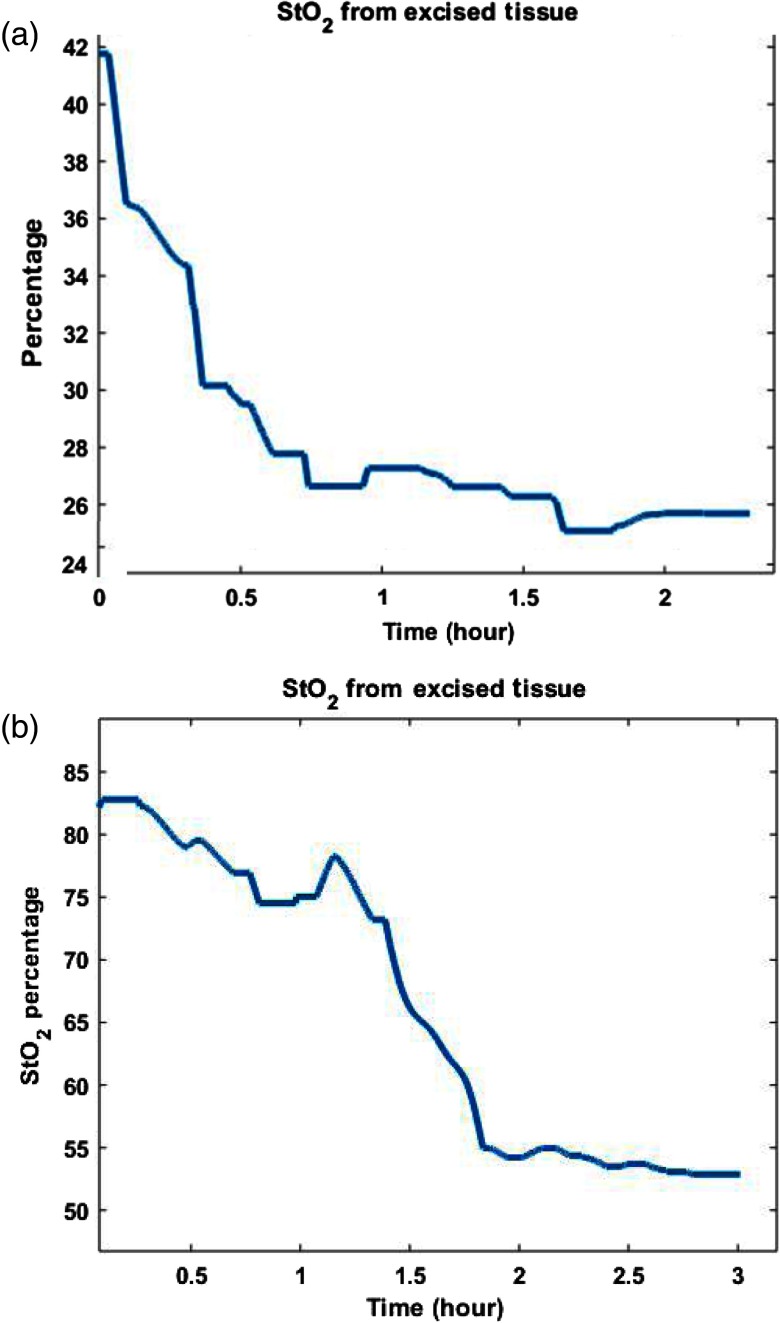
The results from the excised discarded tissue show a sharp decrease over the 3-h monitoring time (see Fig. 6). On the contrary, the pattern in the case of successful FTT shows a sharp increase within the first 3-h period. These outcomes are coherent with the biological response of FTT24–27 and previous results17 and suggest that the device can properly monitor variations in human tissue with different vascular health status.
Fig. 6.
The results from excised discarded tissue. Variations in the decay following excision of tissue are expected as clinical parameters, such as temperature and peripheral vasoconstriction, will vary from patient to patient regardless of weight of tissue excised, as well as the condition of the tissue prior to excision (i.e., there may be some relative ischemia given that the tissue was not planned to be used for transfer). BMI, body mass index; ST, skin tone. (a) The percentage results on human excised discarded tissue. Tissue weight = 460 g, patient age = 60, BMI = healthy, ST = 3. (b) The percentage results on human excised discarded tissue. Tissue weight = 80 g, patient age = 47, BMI = overweight, ST = 3.
On the excised discarded tissue, there is a decrease of about 10% per hour (see Fig. 6). On healthy FTT, from about 10 to 30h after surgery, decreases about 1% per hour [see Figs. 4(b) and 5]. These results suggest that in a case of a VC occurring after 10 postoperative hours, the strength of the slope of can indicate on the viability of the FTT, which is quantifiable using Eqs. (4) and (5).
5. Discussion
FTT is a complex but common plastic surgery that requires close postoperative monitoring to prevent failure. To do so, the clinical team regularly assesses the FTT with observations and palpations. However, to increase salvage rate and reduce staff burden, automatic continuous monitoring devices have been developed and commercialized; NIRS has been specifically shown to be a reliable, noninvasive technique to promptly detect FTT VC.
A compact device that uses NIRS has been developed for the continuous monitoring of percentage. This noninvasive device is wireless and connects with a smart-device for real-time data analysis, visualization, and storage. Integrated with cloud computing, external users can remotely access the data in real time.19,20 The device has been designed to benefit both the patient and the clinical team by providing real-time and reliable data, independent of the patient’s demographics. The steadfast embedded software and network provide complete self-management and recovery schemes with limited need for human input. The device has previously been tested on vascular phantom, animals, and healthy subjects. Results show that the device provides reliable and consistent outcomes for patients of different demographics (e.g., sex, age, BMI, or skin tone) and can provide an estimation of the blood occlusion level.17 Following ethical approval, the device has been tested in a clinical study on patients who underwent FTT for breast reconstructive surgery following mastectomy, for which the results are introduced in this paper. A total of 16 FTTs, which showed no complications, were monitored for 48 h after the surgery. The system has been shown to properly integrate into the clinical setting with ease and no disruption to the clinical staff. The device can robustly, reliably, and continuously monitor percentage in FTT in a clinical setting, independent of the patient’s demographics. Artifacts related to motion and ambient light are respectively eliminated with the adherent skin tape, allowing fixed placement, and the opaque casing preventing the ambient light to affect the measurements.
Specifically, the percentage patterns observed from tissue with different vascular health status are coherent and can be attributed to the biological response of the perforators and the FTT, which have previously been reported.24–27 Indeed, autonomic denervation, inflammatory reaction, and ischemia of the FTT, normally induced by the operation, increase the percentage within the FTT. An increase in the percentage increases the blood flow at the pedicles, which decreases the vascular resistance to dilate the microcirculation within the FTT. These also dissolve any possible microthrombosis and repair micronecrosis.25,28,29 Although the significance of these reactions can vary according to the patient’s vascular pattern, smoking or alcohol abuse, demographics, comorbidities, or age,28,30,31 which can affect the measurements, the percentage trend pattern should remain the same.29 Over the first 3 days after surgery, the pattern of the percentage in the case of a successful FTT usually shows a sharp increase at first, followed by a steady decrease to finally plateau at a slightly lower percentage compared to its initial value.18,27,29
In addition to real-time percentage data analysis and visualization, averaged percentage over time window and percentage gradient variation display can help in understanding the health of the FTT and assess if the tissue should be closely monitored or has entered an percentage equilibrium with unalarming small percentage variations. Real-time classification of the percentage according to the estimated blood vessel occlusion can be an additional parameter to assess the health of the FTT. These outcomes are sufficient to provide a case-by-case analysis.
Future work includes (1) recruiting a sizeable patient population to obtain more datasets with a range of different outcomes and patients’ demographics to assert the given results, (2) pattern modeling in different scenarios and data prediction,32 and (3) more data about the device and its network could also be obtained for further optimization, scaling, and updates of current schemes to ensure data privacy and security.
6. Conclusion
This paper introduces the results of the clinical study of the postoperative monitoring of FTT for the reconstruction of breast following mastectomy using the developed optoelectronic device. The device is designed to meet the needs of the patients and the clinical team as it is wireless, ubiquitous, inexpensive, pervasive, compact, and small. Results concur with previous animal studies and show that the device can accurately measure percentage variations in human tissue. The real-time data visualization and 30-min slots of data analysis provide sufficient information to deduce the health of the FTT. Future work consists in a larger multicentered study to acquire more datasets from a larger range of patients and reconstructive surgeries to assert the findings.
Acknowledgments
This study was supported by EPSRC Smart Sensing for Surgery (EP/LO14149/1) and the EPSRC CDT HiPEDS (EP/LO16796/1).
Biography
Biographies of the authors are not available.
Disclosures
No conflicts of interest.
References
- 1.Chen K.-T., et al. , “Timing of presentation of the first signs of vascular compromise dictates the salvage outcome of free flap transfers,” Plastic Reconstr. Surg. 120(1), 187–195 (2007). 10.1097/01.prs.0000264077.07779.50 [DOI] [PubMed] [Google Scholar]
- 2.Berthelot M., et al. , “Wireless wearable self-calibrated sensor for perfusion assessment of myocutaneous tissue,” in IEEE 13th Int. Conf. Wearable and Implantable Body Sensor Networks (BSN), IEEE, pp. 171–176 (2016). [Google Scholar]
- 3.Chao A. H., et al. , “A review of devices used in the monitoring of microvascular free tissue transfers,” Expert Rev. Med. Devices 10(5), 649–660 (2013). 10.1586/17434440.2013.827527 [DOI] [PubMed] [Google Scholar]
- 4.Mourouzis C., et al. , “Microdialysis: use in the assessment of a buried bone-only fibular free flap,” Plastic Reconstr. Surg. 120(5), 1363–1366 (2007). 10.1097/01.prs.0000279555.75241.4c [DOI] [PubMed] [Google Scholar]
- 5.Sinis N., et al. , “Free flap monitoring with continuous tissue oxygen tension measurement,” Eur. J. Plastic Surg. 28(8), 507–512 (2006). 10.1007/s00238-006-0032-7 [DOI] [Google Scholar]
- 6.Chang E. I., et al. , “Deciphering the sensitivity and specificity of the implantable Doppler probe in free flap monitoring,” Plastic Reconstr. Surg. 137(3), 971–976 (2016). 10.1097/01.prs.0000480016.20326.8f [DOI] [PubMed] [Google Scholar]
- 7.Swartz W. M., et al. , “Direct monitoring of microvascular anastomoses with the 20-mhz ultrasonic Doppler probe: an experimental and clinical study,” Plastic Reconstr. Surg. 81(2), 149–158 (1988). 10.1097/00006534-198802000-00001 [DOI] [PubMed] [Google Scholar]
- 8.Swartz W. M., Izquierdo R., Miller M. J., “Implantable venous Doppler microvascular monitoring: laboratory investigation and clinical results,” Plastic Reconstr. Surg. 93(1), 152–163 (1994). 10.1097/00006534-199401000-00024 [DOI] [PubMed] [Google Scholar]
- 9.Kagaya Y., Miyamoto S., “A systematic review of near-infrared spectroscopy in flap monitoring: current basic and clinical evidence and prospects,” J. Plastic Reconstr. Aesthetic Surg. 71(2), 246–257 (2018). 10.1016/j.bjps.2017.10.020 [DOI] [PubMed] [Google Scholar]
- 10.Amirlak B., et al. , “Skin anatomy. Medscape,” 2017, https://emedicine.medscape.com/article/1294744-overview (28 May 2019).
- 11.Wassenaar E., Van den Brand J., “Reliability of near-infrared spectroscopy in people with dark skin pigmentation,” J. Clin. Monit. Comput. 19(3), 195–199 (2005). 10.1007/s10877-005-1655-0 [DOI] [PubMed] [Google Scholar]
- 12.Fuller L., Higgins E., “Racial influences on skin disease,” in Rook’s Textbook of Dermatology, 8th ed., pp. 1–19, Blackwell Publishing Ltd., West Sussex: (2010). [Google Scholar]
- 13.Hayashi K., et al. , “Stiffness and elastic behavior of human intracranial and extracranial arteries,” J. Biomech. 13(2), 175–184 (1980). 10.1016/0021-9290(80)90191-8 [DOI] [PubMed] [Google Scholar]
- 14.Archer C., “Functions of the skin,” in Rook’s Textbook of Dermatology, 8th ed., pp. 1–11, Blackwell Publishing Ltd., West Sussex: (2010). [Google Scholar]
- 15.Wukitsch M. W., et al. , “Pulse oximetry: analysis of theory, technology, and practice,” J. Clin. Monit. 4(4), 290–301 (1988). 10.1007/BF01617328 [DOI] [PubMed] [Google Scholar]
- 16.McGibbon D., “Subcutaneous fat,” in Rook’s Textbook of Dermatology, 8th ed., pp. 1–49, Blackwell Publishing Ltd., West Sussex: (2010). [Google Scholar]
- 17.Berthelot M., Yang G.-Z., Lo B., “A self-calibrated tissue viability sensor for free flap monitoring,” IEEE J. Biomed. Health Inf. 22(1), 5–14 (2018). 10.1109/JBHI.6221020 [DOI] [PubMed] [Google Scholar]
- 18.Berthelot M., et al. , “Pilot study: free flap monitoring using a new tissue oxygen saturation (sto2) device,” Eur. J. Surg. Oncol. 44(6), 900 (2018). 10.1016/j.ejso.2018.02.166 [DOI] [Google Scholar]
- 19.Li S., Xu L., Zhao S., “The internet of things: a survey,” Inf. Syst. Front. 17(2), 243–259 (2015). 10.1007/s10796-014-9492-7 [DOI] [Google Scholar]
- 20.Bhatt C., Dey N., Ashour A. S., Internet of Things and Big Data Technologies for Next Generation Healthcare, Springer International Publishing, Cham: (2017). [Google Scholar]
- 21.Lee E. A., Seshia S. A., Introduction to Embedded Systems: A Cyber-Physical Systems Approach, MIT Press, Cambridge, Massachusetts: (2016). [Google Scholar]
- 22.Ponticorvo A., et al. , “Quantitative assessment of partial vascular occlusions in a swine pedicle flap model using spatial frequency domain imaging,” Biomed. Opt. Express 4(2), 298–306 (2013). 10.1364/BOE.4.000298 [DOI] [PMC free article] [PubMed] [Google Scholar]
- 23.Gimbel M. L., et al. , “Monitoring partial and full venous outflow compromise in a rabbit skin flap model,” Plastic Reconstr. Surg. 124(3), 796–803 (2009). 10.1097/PRS.0b013e3181b03768 [DOI] [PubMed] [Google Scholar]
- 24.Figus A., Mosahebi A., Ramakrishnan V., “Microcirculation in DIEP flaps: a study of the haemodynamics using laser Doppler flowmetry and lightguide reflectance spectrophotometry,” J. Plastic Reconstr. Aesthetic Surg. 59(6), 604–612 (2006). 10.1016/j.bjps.2005.09.047 [DOI] [PubMed] [Google Scholar]
- 25.Hölzle F., et al. , “Free flap monitoring using simultaneous non-invasive laser Doppler flowmetry and tissue spectrophotometry,” J. Cranio-maxillo-facial Surg. 34(1), 25–33 (2006). 10.1016/j.jcms.2005.07.010 [DOI] [PubMed] [Google Scholar]
- 26.Mericli A. F., et al. , “A prospective clinical trial comparing visible light spectroscopy to handheld Doppler for postoperative free tissue transfer monitoring,” Plastic Reconstr. Surg. 140(3), 604–613 (2017). 10.1097/PRS.0000000000003600 [DOI] [PubMed] [Google Scholar]
- 27.Najefi A., et al. , “Monitoring of free flaps using near-infrared spectroscopy: a systematic review of the initial trials,” Plastic Reconstr. Surg. 125(4), 182e–184e (2010). 10.1097/PRS.0b013e3181d45dc6 [DOI] [PubMed] [Google Scholar]
- 28.Schultze-Mosgau S., et al. , “Micro-lightguide spectrophotometry as an intraoral monitoring method in free vascular soft tissue flaps,” J. Oral Maxillofacial Surg. 61(3), 292–297 (2003). 10.1053/joms.2003.50059 [DOI] [PubMed] [Google Scholar]
- 29.Raittinen L., et al. , “How we do it: postoperative tissue oxygen monitoring in microvascular free flaps,” Clin. Otolaryngol. 30(3), 276–278 (2005). 10.1111/coa.2005.30.issue-3 [DOI] [PubMed] [Google Scholar]
- 30.Ozturk C. N., et al. , “Variables affecting postoperative tissue perfusion monitoring in free flap breast reconstruction,” Microsurgery 35(2), 123–128 (2015). 10.1002/micr.v35.2 [DOI] [PubMed] [Google Scholar]
- 31.Jonas R., et al. , “Monitoring in microvascular tissue transfer by measurement of oxygen partial pressure: four years experience with 125 microsurgical transplants,” J. Cranio-Maxillo-Facial Surg. 41(4), 303–309 (2013). 10.1016/j.jcms.2012.10.008 [DOI] [PubMed] [Google Scholar]
- 32.Rav D., et al. , “Deep learning for health informatics,” IEEE J. Biomed. Health Inf. 21(1), 4–21 (2017). 10.1109/JBHI.2016.2636665 [DOI] [PubMed] [Google Scholar]


