

Abstract
Climate change is predicted to impact freshwater aquatic environments through changes to water temperature (Twater), river flow and eutrophication. Riverine habitats contain many economically and ecologically important fishes. One such group is the migratory salmonids, which are sensitive to warm Twater and low O2 (hypoxia). While several studies have investigated the independent effects of Twater and hypoxia on fish physiology, the combined effects of these stressors is less well known. Furthermore, no study has investigated the effects of Twater and O2 saturation levels within the range currently experienced by a salmonid species. Thus, the aim of this study was to investigate the simultaneous effects of Twater and O2 saturation level on the energetics and kinematics of steady-state swimming in brown trout, Salmo trutta. No effect of O2 saturation level (70 and 100% air saturation) on tail-beat kinematics was detected. Conversely, Twater (10, 14, 18 and 22°C) did affect tail-beat kinematics, but a trade-off between frequency (ftail) and amplitude (A, maximum tail excursion) maintained the Strouhal number (St = ftail• A/U, where U is swimming speed) within the theoretically most mechanically efficient range. Swimming oxygen consumption rate ( ) and cost of transport increased with both U and Twater. The only effect of O2 saturation level was observed at the highest Twater (22°C) and fastest swimming speed (two speeds were used—0.6 and 0.8 m s−1). As the extremes of this study are consistent with current summer conditions in parts of UK waterways, our findings may indicate that S. trutta will be negatively impacted by the increased Twater and reduced O2 levels likely presented by anthropogenic climate change.
Keywords: Climate change, energetics, fish, kinematics, locomotion, physiology
Introduction
Climate change and anthropogenic influences present aquatic organisms with significant challenges (Perry et al., 2005; Ficke et al., 2007; Diaz and Rosenberg, 2008; Woodward et al., 2010). The decline in freshwater quality, as a result of agriculture-driven elevation in nutrient and sediment load, the loss of riparian shade, the presences of continuity barriers (i.e. dams and weirs), combined with increased water temperatures and lowered dissolved O2 levels challenge riverine species with multiple stressors. How these challenges affect survival and distribution of economically important fresh water and anadromous fishes, including species native to the British Isles, is of particular interest to conservation physiologists, ecologists and consumers alike (Eaton and Scheller, 1996; Perry et al., 2005; Hari et al., 2006; Almodóvar et al., 2012). Freshwater fishes are believed to be particularly vulnerable to global fluctuations in atmospheric temperature and its effect on freshwater systems (Eaton and Scheller, 1996; Ficke et al., 2007; Woodward et al., 2010; Isaak et al., 2012). Because of this, the physiological mechanisms underlying the whole animal response to climate change have been studied extensively by fish physiologists, with many recent studies focusing on the effects of increasing environmental temperature on various activities associated with survival (e.g. Portner and Knust, 2007; Clark et al., 2008; Farrell et al., 2008; Lea et al., 2015).
The brown trout, Salmo trutta, is an active, cold-water European fish with a distribution ranging from Iceland and arctic Scandinavia to the Mediterranean Sea (Jonsson and Jonsson, 2010). S. trutta is an important fisheries and recreational fishing species and as such has been introduced worldwide. Water temperature (Twater in °C) is believed to be the main abiotic factor limiting the geographical distribution of S. trutta, which is commonly found in 5–25°C waters (Elliott and Elliott, 2010). Indeed, Twater of 4–24°C was recorded in two streams of the Ribble catchment in the UK known to be inhabited by S. trutta (Fig. 1). S. trutta is also defined as an O2 sensitive species, due to its active life history and high O2 demands (Jonsson and Jonsson, 2010). Indeed, adequate O2 is required to meet the metabolic demands of various life history activities including swimming, feeding, growth, reproduction and predator avoidance. Thus, S. trutta is believed to be particularly vulnerable to decreases in environmental O2 levels (hypoxia), which is often a direct result of anthropogenic pollution and eutrophication of freshwater habitats, as well as an indirect consequence of decreased O2 solubility in water due to increases in Twater (Landman et al., 2005).
Figure 1.
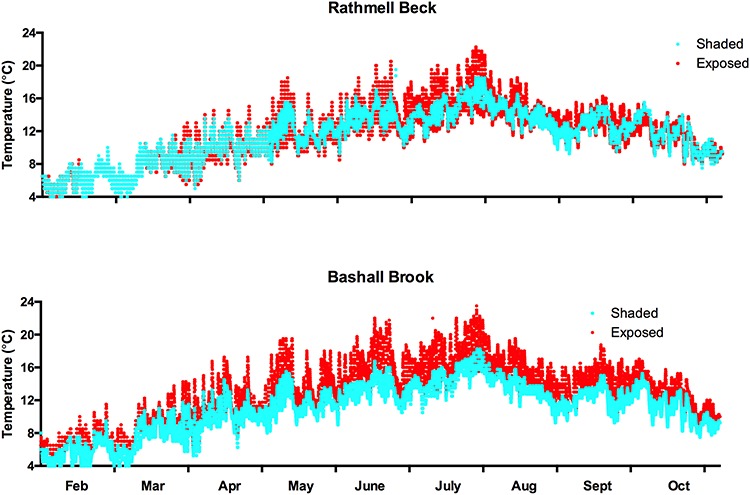
Temperature variation over 9 months in 2014 in two streams in the River Ribble catchment, North West of England. Each data point is a reading from a temperature logger from shaded (blue dots) or exposed (red dots) stretches of Rathmell Beck and Bashall Brook streams. Both streams are known to be inhabited by brown trout, S. trutta.
Migratory S. trutta (sea trout) undertake repeat migrations up and down rivers during spring and autumn where they can encounter changes in water flow, temperature and hypoxia. Thus, understanding how swim speed (U in m s−1), Twater and hypoxia affect their swimming efficiency is of utmost importance in order to understand how climate change may affect this species. One way to quantify kinematic efficiency in animals that use oscillatory propulsion (such as tail or wing beats) is to calculate the Strouhal number (St). St is a dimensionless parameter and in fish, and other swimming animals is derived from tail-beat frequency (ftail), amplitude (A) and swimming speed (U), which is representative of vortex shedding frequency, wake width and forward velocity, respectively (Nudds et al., 2014). Most animals studied to date move within the theoretical optimal range of 0.2 < St < 0.4 (Triantafyllou et al., 1991; Triantafyllou et al., 1993), with geometrically similar organisms adhering to similar St (Taylor et al., 2003; Nudds et al., 2004). Optimal is defined in terms of the highest propulsive efficiency (best mechanical energy input to mechanical energy output ratio). St may decrease slightly with increasing U in fish (Hunter and Zweifel, 1971; Webb, 1971; Lauder and Tytell, 2005; Lea et al., 2015), but was also found to increase concomitantly with U in rainbow trout, Oncorhynchus mykiss (Nudds et al., 2014) and remain constant with U in eels, Anguilla rostrate (Tytell, 2004). In all cases, however, St appears to remain within the defined optimal range (Nudds et al., 2014). Indeed, a change in Twater was shown to induce changes in ftail and A, which appeared to be traded off in maintenance of St (Nudds et al., 2014).
Energetic efficiency of locomotion is most often estimated from activity-induced changes in O2 consumption ( ), used as a proxy for whole animal metabolic rate. Efficiency is also measured in relation to the cost of locomotion, often expressed as the cost of transport (COT, in J·km−1·kg−1). COT provides an index of overall swimming efficiency; the lower the COT value, the more efficient the locomotion (Claireaux et al., 2006). In resting animals, increases in Twater lead to increased
  associated with increased cost of basal metabolic processes (Brett, 1973; Beamish, 1978). Swimming has a similar effect on energy expenditure, with swimming at higher swimming speeds resulting in higher
  . The effects of hypoxia on
  are less clear, with fish exhibiting species-specific responses. In salmonids, a decrease in available O2 leads to an increase in spontaneous swimming activity and therefore an increase in
  , believed to be a behavioural escape response where the fish is seeking higher O2 levels (Chapman and McKenzie, 2009).
The independent effects of Twater or hypoxia on the energetics of swimming performance are well studied in salmonids (Farrell et al., 1998; McKenzie et al., 2004; Evans et al., 2007; Clark et al., 2011; Norin and Malte, 2012; Svendsen et al., 2012; Eliason et al., 2013), whereas the combined effects of these environmental stressors are rarely examined (Schurmann and Steffensen, 1997; Barnes et al., 2011). Even fewer studies have examined the energetics and kinematics of swimming simultaneously (Bushnell et al., 1984; Dickson et al., 2002; Lea et al., 2015). The majority of these studies were conducted under substantial (i.e. <50% air saturation, PO2 < 10 kPa, [O2] < 8 mg/l−1 at 10°C and 1 atm) or severe (below critical O2 threshold, i.e. <13% air saturation, for rainbow trout, O. mykiss,Svendsen et al., 2012) hypoxia. Fewer studies have examined moderate hypoxic conditions (i.e. ~60% air saturation, e.g. Farrell et al., 1998). We know of no studies that have investigated the effect of mild (i.e. ~70% air saturation) hypoxia on salmonid swimming kinematics and metabolism when combined with other environmental stressors relevant to climate change. Because mild hypoxia is increasingly common in un-shaded, slow-flowing parts of rivers where aquatic plants/algae are abundant and because such topology is becoming increasingly common in salmonid waterways due to anthropogenic alteration of physical habitat, such studies are warranted. To our knowledge, this is the first study investigating the combined effects of Twater, mild hypoxia and swimming speed on the energetics and kinematics of swimming in S. trutta. It was hypothesized that fish would maintain locomotor mechanical efficiency (St) under combined stressors by modulating their individual kinematic parameters (ftail and A). Additionally, it was predicted that energetic costs ( and COT) would increase concomitantly with increases in Twater and decreases in O2 saturation.
Materials and Methods
Experimental animals
The data presented here are from 18 sub-adult female brown trout (S. trutta) with a mean body mass of 236 ± 54 g (range from 172–380 g) and mean body length (BL) of 25.47 ± 1.81 cm (range from 23.0–30.2 cm). Two studies were conducted. The first (study 1) in March of 2014 using 12 fish and the second (study 2) in March of 2015 using 6 fish. In both cases, the fish were collected from Dunsop Trout farm (Dunsop Bridge, Lancashire, England) and kept at the University of Manchester at 10°C (± 1°C) in 500 l recirculating freshwater tanks (8–10 fish per tank) under a daily 12 h:12 h light cycle for at least 4 weeks prior to the start of the experiments. A 10°C acclimation was chosen as it is at the lower end, yet sufficiently above the lower critical range, of the brown trout’s preferred temperature tolerance polygon and allowed for temperature increases of sufficient difference to be tested without approaching the upper incipient lethal temperature (Jonsson and Jonsson, 2010). Fish were fed commercial fish food three times a week. Food, however, was withheld for at least 24 h prior to the start of the experiments so that the trout were post absorptive. All husbandry, housing and experimental protocols were in accordance with UK Home Office legislation for working with animals (project license 40/3584 held by HAS).
Swimming protocol
A custom built Steffensen-style swim flume (as used in Nudds et al., 2014; Lea et al., 2015) was used to measure the energetics and quantify the tail-beat kinematics of swimming trout at different Twater and speeds and under two different dissolved O2 levels. Study 1 used Twater of 14, 18 and 22°C and study 2 used Twater of 10, 14 and 18°C. In both cases, dissolved O2 levels were 100% and 70% (henceforth high and low) air saturation. Twater values were selected to provide breadth while remaining within the range experienced by wild trout in the UK during the summer months (Fig. 1). DO recorders were deposited alongside the temperature monitors in the same wild trout streams but these failed. Thus, mild hypoxia at 70% air saturation (PO2 ~ 14.6 kPa and [O2] ~ 7.91 mg/l−1 at 10°C ranging to PO2 ~ 14.4 kPa and [O2] ~ 6.16 mg/l−1 at 22°C) was chosen due to O2 dip-probe records from the Ribble River Trust (Gareth Jones, Pers comms) and because this is the level of routine hypoxia commonly found in S. trutta in fish farms in the UK (Johansson et al., 2006).
The evening before each experiment, a trout was randomly selected, weighed and placed in the swim flume at a water velocity of 0.4 m s−1 at 10°C (controlled by a Grant Optima TX150 heating system, Grant Instruments Ltd, Cambridge, UK) and 100% air saturation (normoxia) to acclimatize to the flume. For study 1, the Twater was increased slowly during the 12-h dark period so that it reached 14°C by the following morning. The following morning, the water velocity was increased from 0.4 m s−1 to 0.6 m s−1 (low U) and the trout swam at this speed for 40 min. Then the velocity was increased to 0.8 m s−1 (high U) and trout were once more swam for 40 min. These swimming velocities are at the upper range of swimming speeds for salmonids of this size, particularly swimming over this temperature range (Beaumont et al., 2000; Altimiras et al., 2002; Lea et al., 2015). After this, the speed was turned back down to 0.4 m s−1 and the trout rested for 40 min. After this recovery period, a 2-h warming commenced at a rate of 2°C per hour. At 18°C (or 14°C for study 2), the two-speed swimming protocol was repeated, followed by the 40-min recovery and a second warming period up to 22°C (18°C for study 2) over 2 h. The speed was then once more increased to 0.6 and 0.8 m s−1. At the end of the 40 min at high U, the velocity returned to 0.4 m s−1 and the swim flume was rapidly cooled down to 14°C (10°C for study 2). The trout recover at this Twater overnight while the O2 content was slowly changed to 70% air saturation (hypoxia) using an automated gas mixer (International Aqua-Tech Ltd, Gaerwen, Wales, UK) connected to a nitrogen gas cylinder. The following day, the warming/swimming protocol was repeated in the 70% air saturation This time at the end of the warmest Twater 40 min swimming trial, the trout was removed, placed back in its holding tank and closely monitored, while the swim flume was drained, cleaned, refilled and set ready for the next fish. The order of 70% and 100% saturation days was switched at random to account for any potential training effects. Experimental Twater was changed in a consistent order. The results obtained, however, were comparable to previous studies (Nudds et al., 2014; Lea et al., 2015). Not all fish swam at the highest speed in the highest temperatures—if a fish rested at the back of the working area for an extended period of time, and would not respond to encouragement by a gentle tail poke, the experiment was terminated.
Kinematics
At all Twater and at both air saturations, the trout were filmed from above (dorsal view) at 100 frames/second using a Sony HDR-SR8E video recorder (Sony, Tokyo, Japan). Recordings were only taken when the trout were swimming steadily in the selected water velocity (0.6 or 0.8 m s−1).
The video footage was imported into Tracker 4.8 video analysis software (Open Source Physics). Clips of three consecutive tail beats were chosen for frame-by-frame digitization of three body parts through time—head, dorsal fin and tail tip. The coordinates of head and tail tip position at each tail beat were used to calculate tail beat amplitude. The midpoint of the tail excursion was taken as a line drawn through the centre of the head parallel to the flow. The max distance that the tail tip reached perpendicularly from this line was then taken as the peak amplitude. Left and right excursions were then summed to give peak-to-peak tail tip amplitude (A). In addition, the time stamp at each video frame was used to calculate tail-beat frequency in Hz (ftail).
From A and ftail, the St was derived using (Nudds et al., 2014):
St = ftail • A/U. (1)
If necessary, adjustments to U were made to account for fore–aft positional change between the beginning and end of the video clips.
Energetics
The mass specific rate of O2 consumption ( ) was used as a proxy for metabolic rate. The energy expenditure for each trout was measured continuously throughout the 2-day experiment using intermittent stop-flow respirometry (Cech and Brauner, 2011; Clark et al., 2013). A fibre-optic O2 electrode connected to a Witrox 1 O2 analyser (Loligo Systems, Viborg, Denmark) was placed in the swim flume to record the O2 concentration in the water. Water oxygenation and the flushing pump were controlled through a DAQ-4 data acquisition and relay system (Loligo Systems). Flushing duration was controlled and
  calculated automatically in AutoResp software (Loligo systems) using the following (taken from Clark et al., 2013):
 (mg O2 kg−1 h−1) = [(Vr-Vf) • Δ
 ]/(Δt • Mf), (2)
where Vr is the respirometer volume, Vf is the fish volume (assuming 1 g of fish is equivalent to 1 ml of water), Δ is change in O2 concentration in the closed swim flume, Δt is the time duration (h) and Mf is trout body mass (kg).
The COT was calculated by converting  data to J km−1 kg−1 as described by Claireaux et al. (2006) using the oxycalorific coefficient suggested by Beamish (1978) of 1 mg O2 = 3.24 Cal and 1 Cal = 4.18 J, and, therefore, 1 mg O2 = 13.54 J.
Data analyses
All data were analysed in R version 3.1.2 (R Core Team, 2014). The data from both studies were pooled together for analyses. Using the lme4 package (Bates et al., 2015), linear mixed effects repeated measures models were generated for each dependent variable (ftail, A, St,  and COT), with Twater, U and high O2 saturation as fixed factors, and individual trout as a random factor in all cases. All interaction terms were included in the initial models, but were removed if not significant by stepwise backwards deletion. The deletion stopped when either no more interaction terms were non-significant or when only the main effects remained in the statistical model. Interaction terms are only presented in the results when having a significant effect on the dependent variable. All data are plotted as means ± SEM, unless otherwise stated. P-values were generated using Type II Wald X2 tests.
The number of trout swum at each temperature were n = 6, 18, 18 and 12 at 10, 14, 18 and 22°C, respectively. The n is the same for all combinations of speeds and oxygen saturation levels. Final sample sizes, however, differed slightly in the data analyses due to some fish refusing to swim under some treatments. The reluctance to swim did not appear to be size dependent. Although the smallest fish (BL = 23 cm) refused to swim in 22°C at 0.6 m s−1 under normoxia and in 22°C at 0.8 m s−1 under hypoxia, trout ranging from 25.2 to 25.4 cm also refused to swim under the latter conditions. Furthermore, those trout refusing to swim in other treatment combinations ranged from 25.2 to 26.5 cm BL. The sample sizes for all kinematic parameters (Figs 2 and 3) for normoxia are n = 4, 18, 18 and 11 at 10, 14, 18 and 22°C for low U (0.6 m s−1) swimming and n = 6, 18, 17 and 11 at 10, 14, 18 and 22°C, respectively, for high U (0.8 m s−1) swimming. For hypoxia, they are n = 6, 18, 17 and 12 at 10, 14, 18 and 22°C for low U swimming and n = 6, 17, 17, 9 at 10, 14, 18 and 22°C, respectively, for high U swimming.
Figure 2.
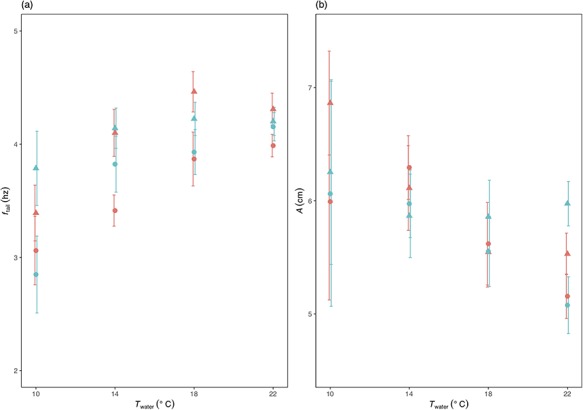
The effect of temperature (Twater) and O2 saturation level on (a) tail-beat frequency, ftail and (b) amplitude, A, at low and high swimming speeds (U = 0.6 and 0.8 ms−1) in S. trutta. ftail was higher at the higher U (triangles) than at the low U (circles) and increased with increases in Twater. A did not differ between the two Us, but decreased with increases in Twater. There were no detectable differences between the low O2 saturation level (blue symbols) and high O2 saturation level (red symbols) on either ftail or A. The error bars have been shifted across the x-axis orientation to improve visual interpretation.
Figure 3.
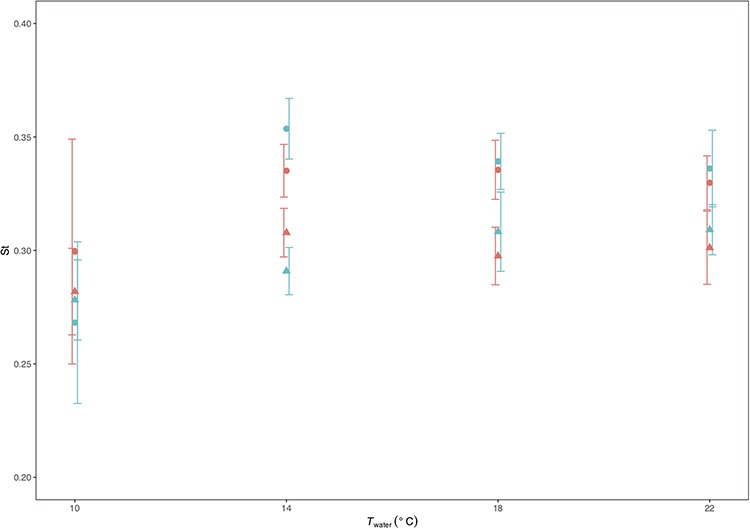
The effects of temperature (Twater) and O2 saturation level (low = blue and high = red symbols) on Strouhal number (St) at low (circles) and high (triangles) swimming speeds (U = 0.6 and 0.8 ms−1) in S. trutta. St was lower at the higher U, but neither Twater nor O2 saturation level had a detectable effect on St. The error bars have been shifted across the x-axis orientation to improve visual interpretation.
For both  and COT (Fig. 4) in normoxia sample sizes were n = 6, 18, 18 and 12 at 10, 14, 18 and 22°C for low U (0.6 m s−1) swimming and n = 6, 18, 17 and 12 at 10, 14, 18 and 22°C, respectively, for high U (0.8 m s−1) swimming. In hypoxia, n = 6, 18, 17 and 11 at 10, 14, 18 and 22°C for low U swimming and n = 6, 17, 17 and 11 at 10, 14, 18 and 22°C, respectively, for high U swimming.
Figure 4.
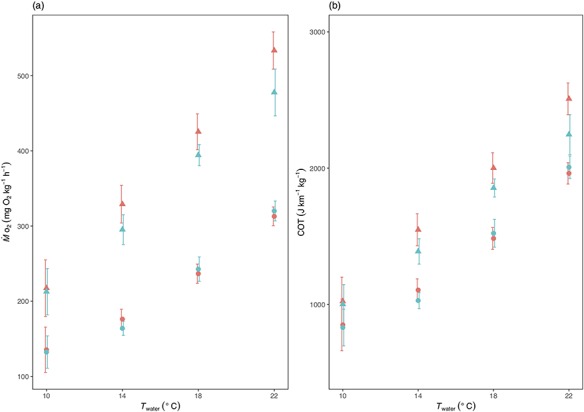
The effect of temperature (Twater) and O2 saturation level on (a) O2 consumption,  , and (b) cost of transport, COT, at low and high swimming speeds (U = 0.6 and 0.8 m s−1) in S. trutta.
  was higher at the higher U (triangles) than at the lower U (circles).
  also increased with increases in Twater. The only detectable difference in
  between O2 saturation levels was at the highest U and Twater combination, where
  was found to be lower in the low O2 saturation level (blue) than in the higher O2 saturation level (red) conditions. The results for COT are similar to those seen for
  . The error bars have been shifted across the x-axis orientation to improve visual interpretation.
Results
Kinematics
f tail (Fig. 2a and Table 1) was greater at high U (X2 = 24.256, P < 0.001) and increased with increasing Twater (X2 = 5.237, P = 0.022). In contrast, O2 saturation level had no detectable effect on ftail (X2 = 1.006, P = 0.316). A (Fig. 2b and Table 1) was not affected by either U (X2 = 0.898, P = 0.343) or O2 level (X2 = 0.304, P = 0.581), but decreased with increasing Twater (X2 = 3.946, P = 0.047). There was no detectable effect of either Twater (X2 = 1.570, P = 0.210) or O2 saturation level (X2 = 0.077, P = 0.782) on St. St, however, was lower at the higher U (X2 = 20.834, P < 0.001).
Table 1.
Means ± standard error for each of the dependent variables and each combination of independent variable (treatments)
| Independent variables | Dependent variables | ||||||
|---|---|---|---|---|---|---|---|
|
T
(°C) |
Oxygen saturation (%) |
U
(m s −1) |

(mg O2 kg−1 h−1) |
COT | f tail (Hz) |
A
(cm) |
St |
| 10 | 70 | 0.6 | 132.35 ± 21.51 | 829.81 ± 134.86 | 2.85 ± 0.34 | 6.06 ± 0.99 | 0.27 ± 0.04 |
| 0.8 | 212.76 ± 30.85 | 1000.52 ± 145.07 | 3.79 ± 0.33 | 6.25 ± 0.82 | 0.28 ± 0.02 | ||
| 100 | 0.6 | 135.42 ± 30.15 | 849.08 ± 189.04 | 3.06 ± 0.30 | 5.99 ± 0.87 | 0.30 ± 0.05 | |
| 0.8 | 217.37 ± 37.64 | 1022.17 ± 176.98 | 3.39 ± 0.25 | 6.86 ± 0.46 | 0.28 ± 0.02 | ||
| 14 | 70 | 0.6 | 163.91 ± 9.40 | 1027.72 ± 58.94 | 3.82 ± 0.25 | 5.97 ± 0.30 | 0.35 ± 0.01 |
| 0.8 | 295.23 ± 19.80 | 1388.30 ± 93.09 | 4.14 ± 0.18 | 5.87 ± 0.37 | 0.29 ± 0.01 | ||
| 100 | 0.6 | 176.22 ± 13.07 | 1104.90 ± 81.97 | 3.41 ± 0.14 | 6.29 ± 0.28 | 0.34 ± 0.01 | |
| 0.8 | 329.04 ± 25.01 | 1547.30 ± 117.62 | 4.10 ± 0.21 | 6.11 ± 0.37 | 0.31 ± 0.01 | ||
| 18 | 70 | 0.6 | 242.66 ± 16.24 | 1521.46 ± 101.83 | 3.93 ± 0.20 | 5.55 ± 0.31 | 0.34 ± 0.01 |
| 0.8 | 394.30 ± 14.08 | 1854.19 ± 66.23 | 4.22 ± 0.15 | 5.86 ± 0.32 | 0.31 ± 0.02 | ||
| 100 | 0.6 | 236.60 ± 12.82 | 1483.46 ± 80.36 | 3.87 ± 0.24 | 5.62 ± 0.36 | 0.34 ± 0.01 | |
| 0.8 | 425.40 ± 23.87 | 2000.45 ± 112.27 | 4.46 ± 0.18 | 5.55 ± 0.31 | 0.30 ± 0.01 | ||
| 22 | 70 | 0.6 | 320.07 ± 13.23 | 2006.86 ± 82.93 | 4.15 ± 0.12 | 5.08 ± 0.25 | 0.34 ± 0.02 |
| 0.8 | 477.71 ± 31.16 | 2246.44 ± 146.52 | 4.20 ± 0.12 | 5.97 ± 0.20 | 0.31 ± 0.01 | ||
| 100 | 0.6 | 312.85 ± 12.50 | 1961.60 ± 78.39 | 3.99 ± 0.10 | 5.16 ± 0.20 | 0.33 ± 0.01 | |
| 0.8 | 533.48 ± 24.76 | 2508.71 ± 116.44 | 4.31 ± 0.14 | 5.53 ± 0.18 | 0.30 ± 0.02 | ||
Energetics
 (Fig. 4a and Table 1) was greater at the higher swimming speed than at the lower speed (X2 = 349.239, P < 0.001) and increased with increases in Twater (X2 = 267.628, P < 0.001). Taken together across all temperatures,
  was similar in both oxygen saturation levels (X2 = 3.122, P = 0.077). There was, however, a higher incremental increase (interaction between temperature and U) in
  with Twater at the higher speed (X2 = 10.679, P < 0.001). A significant interaction between U and O2 saturation level (X2 = 3.878, P = 0.049) indicated that the effect of mild hypoxia on
  was inconsistent between speeds with low saturation inducing a lower measured
  at the higher speed, whereas oxygen saturation level did not detectably affect
  at the lower speed.
COT (Fig. 4b and Table 1) was higher at the higher swimming speed than at the lower speed (X2 = 82.946, P < 0.001) and increased with increases in Twater (X2 = 289.100, P < 0.001), but it was not affected by oxygen saturation level (X2 = 2.494, P = 0.114).
Discussion
Swimming is an energetically costly behaviour and a fundamental part of S. trutta life history. The aim of this study was to determine the combined effects of Twater, O2 saturation level and swimming speed on the tail-beat kinematics and energetics of brown trout, with applicability to climate change. Arguably, two of the findings are particularly pertinent to this aspect; both  and St give an indication of whether the trout are able to tolerate the range of conditions experienced in terms of aerobic respiration for the former and propulsive efficiency for the latter. We found that St was not affected by either changes to Twater or O2 saturation level that is consistent with the growing body of work showing that fish maintain St in an optimal (or preferred) range (Hunter and Zweifel, 1971; Webb, 1971; Taylor et al., 2003; Lauder and Tytell, 2005; Nudds et al., 2014; Lea et al., 2015) (Fig. 3). Thus, it appears that brown trout can maintain propulsive efficiency throughout the natural Twater and O2 saturation ranges currently experienced. Similarly, for the most part, neither current Twater nor O2 saturation levels are likely to present an energetic obstacle. This is with the exception of the highest Twater and low O2 saturation combination, where
  was found to drop (Fig. 4a) (discussed further below).
Strouhal number (St) was marginally lower at the high U, similar to findings from previous studies on fish (Hunter and Zweifel, 1971; Webb, 1971; Lauder and Tytell, 2005; Lea et al., 2015), with the trout maintaining St within the theoretical range for mechanical efficiency of 0.2 to 0.4 (Triantafyllou et al., 1991; Triantafyllou et al., 1993; Taylor et al., 2003) in all combinations of Twater, O2 saturation level and U. The data indicate no effect of O2 saturation level on swimming kinematics in the trout, but ftail increased and A decreased with increasing Twater. Here, and as in previous studies, a Twater driven trade-off between ftail and A appears to be initiated in order to maintain a preferred St. The exact nature of this trade-off, however, is not necessarily consistent among studies. Increases in Twater may lead to concomitant increases in ftail as found this present study (Stevens, 1979; Nudds et al., 2014; Lea et al., 2015), decreases (Stevens, 1979) in ftail or, alternatively, no detectable effect (Rome et al., 1990). Similarly, as found here, increases in Twater were previously linked to decreases in A for salmonids (Nudds et al., 2014; Lea et al., 2015), yet had no discernable effect on A in carp (Rome et al., 1990). Determining whether these differences are due to methodology or taxa requires further work.
Swimming represents a considerable component of the energy budget of active fishes, and high intensity aerobic swimming can utilize a significant proportion of aerobic metabolic scope (Claireaux and Lefrançois, 2007; Chapman and McKenzie, 2009). As predicted,  increased with both swimming speed and temperature, but O2 saturation level had no detectable effect. The
  values presented in this study are well within the range of those presented in other salmonid studies carried out at similar temperatures (e.g. Beaumont et al., 2000; Altimiras et al., 2002; Lee et al., 2003; Clark et al., 2011; Eliason et al., 2013). Calculating COT without accurate CO2 production measurements has its limitations. Nevertheless, the values calculated here are within the range of values seen in other athletic fish species at similar U and at similar Twater, such as the European sea bass, Dicentrarchus labrax (Claireaux et al., 2006).
The lack of a detectable change in  with O2 saturation level at all but the highest Twater, U and lowest O2 saturation level deserves further consideration. It is possible that 70% air saturation is not hypoxic enough to induce a change in swimming physiology in the brown trout at anything other than the more extreme conditions their wild counterparts encounter. Under these conditions, it is possible the fish switched from aerobic to anaerobic metabolism, with overall metabolism increasing despite the observed reduction in O2 uptake. Indeed, previous studies suggest fish may start switching to anaerobic metabolism when swimming at just 70% of their Ucrit (Burgetz et al., 1998). It may be that in the most extreme combination of the conditions used here, the fish were approaching the limit for sustainable steady-state swimming. Indeed, our highest U was just below burst and glide locomotion. During hypoxia and intense swimming, salmonid glycolytic white muscle produces significant amounts of lactate, more than can be processed by aerobic tissues like red muscle and the heart (Weber et al., 2016). Additionally, the fish may have reduced blood flow to organs like the liver and the gut during the more extreme swimming conditions that may have reduced over all O2 consumption (Thorarensen and Farrell, 2006). Whether, however, these processes account for the lowered
  observed here, or had an effect, albeit lesser, at the less extreme combinations of the treatments is not known. Previous studies show that mild hypoxia can have a significant negative effect on repeated swimming performance in mature wild caught sockeye salmon, Oncorhynchus nerka (Farrell et al., 1998). Therefore, it may be that hypoxia can be accommodated by the fish over the duration of a single swimming event as used here, whereas over multiple swims and longer swim durations, changes in O2 saturation may have detrimental effects. It should, however, also be noted that swimming performance is not the only trait that may be limited by hypoxia. In Atlantic salmon (Salmo salar) aquaculture, fish exposed to cyclic episodes of hypoxia at O2 concentrations of 6 mg/l and lower (air saturation equivalent of 66–78% DO at Twater of 10–18°C) show signs of physiological changes such as sub-optimal growth (Farrell and Richards, 2009; Burt et al., 2012).
Multiple statistical tests were conducted within this present study and two P-values that are only just below the α = 0.05 level are interpreted as significant effects. We would argue that the relatively small sample sizes, would mean any correction for a false discovery rate (Curran-Everett, 2000) would be too conservative. Furthermore, one of these P-values (P = 0.047), relates to a decrease in A with Twater, which is supported logically. Specifically, because St remained unaffected by, whilst ftail increased with increases in Twater, clearly A had to decrease with increasing Twater, because St is a product of ftail and A (when U is fixed). Hence, we would argue that the conclusion of a significant effect here is robust. The second P-value (P = 0.049) relates to the interaction between U and O2 saturation level on  , which is interpreted as an indication that the trout were perhaps switching from aerobic to anaerobic metabolism at the highest Twater and U combination in the low O2 saturation level condition. Although this result does not have the logic-based support of the A and Twater result, it, nonetheless, is certainly not an unexpected finding.
Both warming waters and hypoxia are O2-limiting stressors for energetically demanding activities such as locomotion (Claireaux and Lefrançois, 2007; Ejbye-Ernst et al., 2016; Ern et al., 2016). To our knowledge this study is the first to examine tail-beat kinematics and the energetics of swimming under combined environmental stressors in a species of fish. Kinematic (mechanical) efficiency was not compromised, with no change in St detected in response to Twater changes or O2 saturation level. However, the energetic cost of locomotion ( ), increased with increases in Twater and with higher U. Mild hypoxia had no detectable effect on swimming performance except at the most extreme combination of conditions experienced. Future studies should expand the range of the conditions tested in this study to further probe the vulnerability of this ionic fish. Indeed, our data suggests that if anthropogenic climate change pushes conditions beyond those used in this study and the trout are unable to either migrate or avoid compromised areas, they will experience detrimental levels of physiological stress.
Acknowledgements
The authors would like to thank Prof. Pat Butler (University of Birmingham) for the generous donation of the swim-flume respirometer; Sallie Painter, Syafiq Musa, Billie Walker-O’Dowd, Alex Thomas and Emma Samson for help with data collection; and Jack Spees and Gareth Jones at Ribble Rivers Trust for the temperature loggers and field work assistance. R.L.N and H.A.S. designed the study; K.O., M.F. and O.H.W. conducted the study; M.F., K.O. and R.L.N. analysed the data and all authors contributed to the writing of the manuscript.
Funding
K.O. was supported by a Natural Environment Research Council studentship to H.A.S. and M.F. was supported by a Biotechnology and Biological Sciences Research Council DTP studentship to RLN.
References
- Almodóvar A, Nicola GG, Ayllón D, Elvira B (2012) Global warming threatens the persistence of Mediterranean brown trout. Glob Chang Biol 18: 1549–1560. [Google Scholar]
- Altimiras J, Axelsson M, Claireaux G, Lefrancois C, Mercier C, Farrell AP (2002) Cardiorespiratory status of triploid brown trout during swimming at two acclimation temperatures. J Fish Biol 60: 102–116. [Google Scholar]
- Barnes R, King H, Carter CG (2011) Hypoxia tolerance and oxygen regulation in Atlantic salmon, Salmo salar from a Tasmanian population. Aquaculture 318: 397–401. [Google Scholar]
- Bates D, Machler M, Bolker BM, Walker SC (2015) Fitting linear mixed-effects models using lme4. J Stat Softw 67: 1–48. [Google Scholar]
- Beamish FWH. (1978) Swimming capacity In Hoar WS, Randall DJ, eds, Fish Physiology. Academic Press, New York, NY, USA, pp. 101–187. [Google Scholar]
- Beaumont MW, Butler PJ, Taylor EW (2000) Exposure of brown trout, Salmo trutta, to a sub-lethal concentration of copper in soft acidic water: effects upon muscle metabolism and membrane potential. Aquat Toxicol 51: 259–272. [DOI] [PubMed] [Google Scholar]
- Brett JR. (1973) Energy expenditure of sockeye salmon, Oncorhynchus nerka, during sustained performance. J Fish Res Board Can 30: 1799–1809. [Google Scholar]
- Burgetz I, Rojas-Vargas A, Hinch S, Randall D (1998) Initial recruitment of anaerobic metabolism during sub-maximal swimming in rainbow trout (Oncorhynchus mykiss). J Exp Biol 201: 2711–2721. [DOI] [PubMed] [Google Scholar]
- Burt K, Hamoutene D, Mabrouk G, Lang C, Puestow T, Drover D, Losier R, Page F (2012) Environmental conditions and occurrence of hypoxia within production cages of Atlantic salmon on the south coast of Newfoundland. Aquacult Res 43: 607–620. [Google Scholar]
- Bushnell PG, Steffensen JF, Johansen K (1984) Oxygen consumption and swimming performance in hypoxia-acclimated rainbow trout Salmo gairdneri. J Exp Biol 133: 225–235. [Google Scholar]
- Cech J, Brauner C (2011) Techniques in whole animal respiratory physiology. Encyclopedia of Fish Physiology: From Genome to Environment, Vol 2 Academic Press, New York, pp 846–853. [Google Scholar]
- Chapman LJ, Mckenzie DJ (2009) Behavioral responses and ecological consequences In Fish Physiology. Academic Press, New York, NY, USA, pp. 25–77. [Google Scholar]
- Claireaux G, Lefrançois C (2007) Linking environmental variability and fish performance: integration through the concept of scope for activity. Philos Trans R Soc B 362: 2031–2041. [DOI] [PMC free article] [PubMed] [Google Scholar]
- Claireaux G, Couturier C, Groison A-L (2006) Effect of temperature on maximum swimming speed and cost of transport in juvenile European sea bass (Dicentrarchus labrax). J Exp Biol 209: 3420–3428. [DOI] [PubMed] [Google Scholar]
- Clark TD, Sandblom E, Cox GK, Hinch SG, Farrell AP (2008) Circulatory limits to oxygen supply during an acute temperature increase in the Chinook salmon (Oncorhynchus tshawytscha). Am J Physiol Integr Comp Physiol 295: R1631–R1639. [DOI] [PubMed] [Google Scholar]
- Clark TD, Jeffries KM, Hinch SG, Farrell AP (2011) Exceptional aerobic scope and cardiovascular performance of pink salmon (Oncorhynchus gorbuscha) may underlie resilience in a warming climate. J Exp Biol 214: 3074–3081. [DOI] [PubMed] [Google Scholar]
- Clark TD, Sandblom E, Jutfelt F (2013) Aerobic scope measurements of fishes in an era of climate change: respirometry, relevance and recommendations. J Exp Biol 216: 2771–2782. [DOI] [PubMed] [Google Scholar]
- Curran-Everett D. (2000) Multiple comparisons: philosophies and illustrations. Am J Physiol Integr Comp Physiol 279: R1–R8. [DOI] [PubMed] [Google Scholar]
- Diaz RJ, Rosenberg R (2008) Spreading dead zones and consequences for marine ecosystems. Science 321: 926–929. [DOI] [PubMed] [Google Scholar]
- Dickson KA, Donley JM, Sepulveda C, Bhoopat L (2002) Effects of temperature on sustained swimming performance and swimming kinematics of the chub mackerel Scomber japonicas. J Exp Biol 205: 969–980. [DOI] [PubMed] [Google Scholar]
- Eaton JG, Scheller RM (1996) Effects of climate warming on fish thermal habitat in streams of the United States. Limnol Oceanogr 41: 1109–1115. [Google Scholar]
- Ejbye-Ernst R, Michaelsen TY, Tirsgaard B, Wilson JM, Jensen LF, Steffensen JF, Pertoldi C, Aarestrup K, Svendsen JC (2016) Partitioning the metabolic scope: the importance of anaerobic metabolism and implications for the oxygen- and capacity-limited thermal tolerance (OCLTT) hypothesis. Conserv Physiol 4: cow019. [DOI] [PMC free article] [PubMed] [Google Scholar]
- Eliason EJ, Clark TD, Hinch SG, Farrell AP (2013) Cardiorespiratory performance and blood chemistry during swimming and recovery in three populations of elite swimmers: adult sockeye salmon. Comp Biochem Physiol, Part A 166: 385–397. [DOI] [PubMed] [Google Scholar]
- Elliott JM, Elliott JA (2010) Temperature requirements of Atlantic salmon Salmo salar, brown trout Salmo trutta and Arctic charr Salvelinus alpinus: predicting the effects of climate change. J Fish Biol 77: 1793–1817. [DOI] [PubMed] [Google Scholar]
- Ern R, Norin T, Gamperl AK, Esbaugh AJ (2016) Oxygen-dependence of upper thermal limits in fishes. J Exp Biol 219(21):3376–3383 [DOI] [PubMed] [Google Scholar]
- Evans DO. (2007) Effects of hypoxia on scope-for-activity and power capacity of lake trout (salvelinus namaycush). Can J Fish Aquat Sci 64(2): 345–361 [Google Scholar]
- Farrell AP, Richards JG (2009) Defining hypoxia: an integrative synthesis of the responses of fish to hypoxia In Fish Physiology Vol 27 Academic Press, New York, NY, USA, pp. 487–503 [Google Scholar]
- Farrell AP, Gamperl AK, Birtwell IK (1998) Prolonged swimming, recovery and repeat swimming performance of mature sockeye salmon Oncorhynchus nerka exposed to moderate hypoxia and pentachlorophenol. J Exp Biol 201: 2183–2193. [DOI] [PubMed] [Google Scholar]
- Farrell A, Hinch S, Patterson D, Eliason E, Steinhausen M, Hanson L (2008) Salmonids in hot water: examining aerobic scope and cardiac limitations. Comp Biochem Physiol, Part A 150: S167–S168. [Google Scholar]
- Ficke AD, Myrick CA, Hansen LJ (2007) Potential impacts of global climate change on freshwater fisheries. Rev Fish Biol Fish 17: 581–613. [Google Scholar]
- Hari RE, Livingstone DM, Siber R, Burkhardt-Holm P, Guttinger H (2006) Consequences of climatic change for water temperature and brown trout populations in Alpine rivers and streams. Glob Chang Biol 12: 10–26. [Google Scholar]
- Hunter JR, Zweifel JR (1971) Swimming speed, tail beat frequency, tail beat amplitude, and size in jack mackerel, Trachurus symmetricus, and other fishes. Fish Bull 69: 253–266. [Google Scholar]
- Isaak DJ, Wollrab S, Horan D, Chandler G (2012) Climate change effects on stream and river temperatures across the northwest U.S. from 1980–2009 and implications for salmonid fishes. Clim Change 133: 499–524. [Google Scholar]
- Johansson D, Ruohonen K, Kiessling A, Oppedal F, Stiansen J-E, Kelly M, Juell J-E (2006) Effect of environmental factors on swimming depth preferences of Atlantic salmon (Salmo salar L.) and temporal and spatial variations in oxygen levels in sea cages at a fjord site. Aquaculture 254: 594–605. [Google Scholar]
- Jonsson B, Jonsson N (2010) A review of the likely effects of climate change on anadromous Atlantic salmon Salmo salar and brown trout Salmo trutta, with particular reference to water temperature and flow. J Fish Biol 75: 2381–2447. [DOI] [PubMed] [Google Scholar]
- Landman MJ, Van Den Heuvel MR, Ling N (2005) Relative sensitivities of common freshwater fish and invertebrates to acute hypoxia. N Z J Mar Freshw Res 39: 1061–1067. [Google Scholar]
- Lauder GV, Tytell ED (2005) Hydrodynamics of undulatory propulsion. Fish Physiol 23: 425–468. [Google Scholar]
- Lea JMD, Keen AN, Nudds RL, Shiels HA (2015) Kinematics and energetics of swimming performance during acute warming in brown trout Salmo trutta. J Fish Biol 88: 403–417. [DOI] [PubMed] [Google Scholar]
- Lee CG, Farrell AP, Lotto A, MacNutt MJ, Hinch SG, Healey MC (2003) The effect of temperature on swimming performance and oxygen consumption in adult sockeye (Oncorhynchus nerka) and coho (O. kisutch) salmon stocks. J Exp Biol 206: 3239–3251. [DOI] [PubMed] [Google Scholar]
- McKenzie DJ, Wong S, Randall DJ, Egginton S, Taylor EW, Farrell AP (2004) The effects of sustained exercise and hypoxia upon oxygen tensions in the red muscle of rainbow trout. J Exp Biol 207: 3629–3637. [DOI] [PubMed] [Google Scholar]
- Norin T, Malte H (2012) Intraspecific variation in aerobic metabolic rate of fish: relations with organ size and enzyme activity in brown trout. Physiol Biochem Zool 85: 645–656. [DOI] [PubMed] [Google Scholar]
- Nudds RL, Taylor GK, Thomas ALR (2004) Tuning of Strouhal number for high propulsive efficiency accurately predicts how wingbeat frequency and stroke amplitude relate and scale with size and flight speed in birds. Proc R Soc Lond B 271: 2071–2076. [DOI] [PMC free article] [PubMed] [Google Scholar]
- Nudds RL, John EL, Keen AN, Shiels HA (2014) Rainbow trout provide the first experimental evidence for adherence to a distinct Strouhal number during animal oscillatory propulsion. J Exp Biol 217: 2244–2249. [DOI] [PubMed] [Google Scholar]
- Perry AL, Low PJ, Ellis JR, Reynolds JD (2005) Climate change and distribution shifts in marine fishes. Science 308: 1912–1915. [DOI] [PubMed] [Google Scholar]
- Portner HO, Knust R (2007) Climate change affects marine fishes through the oxygen limitation of thermal tolerance. Science 315: 95–97. [DOI] [PubMed] [Google Scholar]
- R Core Team (2014) R: a language and environment for statistical computing In R Foundation for Statistical Computing. Austria. URL, Vienna, http://www.R-project.org/ [Google Scholar]
- Rome LC, Funke RP, Alexander RM (1990) The influence of temperature on muscle velocity and sustained performance in swimming carp. J Exp Biol 154: 163–178. [DOI] [PubMed] [Google Scholar]
- Schurmann H, Steffensen JF (1997) Effects of temperature, hypoxia and activity on the metabolism of juvenile Atlantic cod. J Fish Biol 50: 1166–1180. [Google Scholar]
- Stevens ED. (1979) Effect of temperature on tail beat frequency of fish swimming at constant velocity. Can J Zool 57: 1628–1635. [Google Scholar]
- Svendsen JC, Steffensen JF, Aarestrup K, Frisk M, Etzerodt A, Jyde M (2012) Excess posthypoxic oxygen consumption in rainbow trout (oncorhynchus mykiss): recovery in normoxia and hypoxia. Can J Zool 90: 1–11. [Google Scholar]
- Taylor GK, Nudds RL, Thomas ALR (2003) Flying and swimming animals cruise at a Strouhal number tuned for high power efficiency. Nature 425: 707–711. [DOI] [PubMed] [Google Scholar]
- Thorarensen H, Farrell AP (2006) Postprandial intestinal blood flow, metabolic rates, and exercise in Chinook salmon (Oncorhynchus tshawytscha). Physiol Biochem Zool 79: 688–694. [DOI] [PubMed] [Google Scholar]
- Triantafyllou MS, Triantafyllou GS, Gopalkrishnan R (1991) Wake mechanics for thrust generation in oscillating foils. Phys Fluids 3: 2835–2283. [Google Scholar]
- Triantafyllou GS, Triantafyllou MS, Grosenbaugh MA (1993) Optimal thrust development in oscillating foils with application to fish propulsion. J Fluids Struct 7: 205–224. [Google Scholar]
- Tytell ED. (2004) The hydrodynamics of eel swimming II. Effect of swimming speed. J Exp Biol 207: 3265–3279. [DOI] [PubMed] [Google Scholar]
- Webb PW. (1971) The swimming energetics of trout. I. Thrust and power output at cruising speeds. J Exp Biol 55: 489–520. [DOI] [PubMed] [Google Scholar]
- Weber J-M, Choi K, Gonzalez A, Omlin T (2016) Metabolic fuel kinetics in fish: swimming, hypoxia and muscle membranes. J Exp Biol 219: 250–258. [DOI] [PubMed] [Google Scholar]
- Woodward G. (2010) Climate change and freshwater ecosystems: impacts across multiple levels of organization. Philos Trans R Soc B 365: 2093–2106. [DOI] [PMC free article] [PubMed] [Google Scholar]