

Abstract
This study in children born extremely preterm (EP; <28 weeks’ gestational age) or extremely low birth weight (ELBW; <1,000 g) investigated whether adaptive working memory training using Cogmed® is associated with structural and/or functional brain changes compared with a placebo program. Ninety‐one EP/ELBW children were recruited at a mean (standard deviation) age of 7.8 (0.4) years. Children were randomly allocated to Cogmed or placebo (45‐min sessions, 5 days a week over 5–7 weeks). A subset had usable magnetic resonance imaging (MRI) data pretraining and 2 weeks posttraining (structural, n = 48; diffusion, n = 43; task‐based functional, n = 18). Statistical analyses examined whether cortical morphometry, white matter microstructure and blood oxygenation level‐dependent (BOLD) signal during an n‐back working memory task changed from pretraining to posttraining in the Cogmed and placebo groups separately. Interaction analyses between time point and group were then performed. There was a significant increase in neurite density in several white matter regions from pretraining to posttraining in both the Cogmed and placebo groups. BOLD signal in the posterior cingulate and precuneus cortices during the n‐back task increased from pretraining to posttraining in the Cogmed but not placebo group. Evidence for group‐by‐time interactions for the MRI measures was weak, suggesting that brain changes generally did not differ between Cogmed and placebo groups. Overall, while some structural and functional MRI changes between the pretraining and posttraining period in EP/ELBW children were observed, there was little evidence of training‐induced neuroplasticity, with changes generally identified in both groups. Trial registration Australian New Zealand Clinical Trials Registry, http://anzctr.org.au; ACTRN12612000124831.
Keywords: Cogmed, diffusion imaging, functional imaging, magnetic resonance imaging, microstructure, preterm birth
1. INTRODUCTION
Children born extremely preterm (EP; <28 weeks’ gestational age) or extremely low birth weight (ELBW; <1,000 g) are at increased risk for general cognitive impairment (Anderson et al., 2004; Hutchinson et al., 2013; Kerr‐Wilson, Mackay, Smith, & Pell, 2012), with deficits observed across a wide range of cognitive domains (Anderson, 2014). It has been speculated that children born EP/ELBW have a specific vulnerability for deficits in working memory (Anderson, 2014; Omizzolo et al., 2014), which is the capacity to temporarily store and manipulate information. Given working memory is a core cognitive skill, this vulnerability may have consequences for higher‐order cognitive functions that are dependent on intact working memory (Mulder, Pitchford, & Marlow, 2010).
Cognitive training programs that focus on working memory, such as the widely used adaptive working memory training program called Cogmed®, have been associated with improved working memory functioning in typically developing children (Sala & Gobet, 2017) and in preterm children (Grunewaldt, Lohaugen, Austeng, Brubakk, & Skranes, 2013; Grunewaldt, Skranes, Brubakk, & Lahaugen, 2016; Lee, Pei, Andrew, Kerns, & Rasmussen, 2017; Lohaugen et al., 2011). However, these findings in preterm children were from small, nonrandomised controlled studies. In contrast, in a recent randomised controlled trial, we reported little benefit of Cogmed on working memory and academic outcomes in children born EP/ELBW compared with a placebo program that did not tax working memory (Anderson et al., 2018). This trial provided high quality evidence that Cogmed might not be effective in improving working memory and other related functions in children born EP/ELBW compared with a placebo program.
Despite the lack of training‐induced working memory improvements in our trial (Anderson et al., 2018), it is possible that Cogmed may induce neuroplastic changes in EP/ELBW children. Magnetic resonance imaging (MRI) is a powerful technique that has been shown to be sensitive to subtle changes in brain structure and function in preterm‐born individuals, even in the absence of cognitive changes (Froudist‐Walsh et al., 2015). There have not been any studies on the effects of Cogmed on the brain in preterm children, however, there is some evidence that Cogmed is associated with brain structural and functional changes in other clinical groups. In a study of children with attention deficit hyperactivity disorder (ADHD), Cogmed was associated with increased activation in several frontal, parietal and temporal regions as measured using working memory task‐based functional MRI (Stevens, Gaynor, Bessette, & Pearlson, 2016). Another study of children with neurofibromatosis type 1 found that Cogmed was associated with decreases in measures of resting‐state functional MRI activity in small clusters in the cerebellum, thalamus and superior frontal sulcus, and also, with increases in activity in a small cluster in the occipital fusiform gyrus (Yoncheva et al., 2017). However, these previous studies were not randomised controlled trials, which, along with statistical analyses of group‐by‐time interactions, are considered the gold‐standard for detecting training‐specific effects on the brain (Metzler‐Baddeley, Caeyenberghs, Foley, & Jones, 2016b; Thomas & Baker, 2013). The only study of children to employ a randomised controlled design and group‐by‐time interaction analysis used magnetoencephalography (MEG), and reported enhanced brain activity and connectivity between frontoparietal, lateral occipital and inferior temporal cortices in typically developing 8‐ to 11‐year‐olds following Cogmed compared with placebo training (Astle, Barnes, Baker, Colclough, & Woolrich, 2015; Barnes, Nobre, Woolrich, Baker, & Astle, 2016). While not directly comparable with studies in children, there have also been some studies in adults that suggest Cogmed is associated with improved measures of white matter microstructure and connectivity (Caeyenberghs, Metzler‐Baddeley, Foley, & Jones, 2016; Metzler‐Baddeley et al., 2017), and increased and decreased brain activity measured using task‐based functional MRI in various cortical regions (Brehmer et al., 2011; Olesen, Westerberg, & Klingberg, 2004). Another study using a different type of working memory training to Cogmed found this training was associated with decreased frontal–parietal brain activity on task‐based functional MRI in children born very preterm (<32 weeks) at 7–12 years of age (Everts, Murner‐Lavanchy, Schroth, & Steinlin, 2017). Additional studies using randomised controlled designs and group‐by‐time interaction analyses are therefore needed to understand the effects of Cogmed on the brain in children, including those born EP/ELBW.
Studies using multimodal MRI are needed given the wider literature suggests working memory training may be associated with changes in both brain structure and function (Buschkuehl, Jaeggi, & Jonides, 2012; Constantinidis & Klingberg, 2016; Everts et al., 2017; Metzler‐Baddeley et al., 2016b). Neural mechanisms for training‐induced changes may include grey matter changes like neurogenesis and synaptogenesis, and white matter changes like increases in axon density, diameter and myelination, which may influence structural MRI measures of cortical thickness, area or volume and diffusion MRI measures of white matter microstructure, respectively (Zatorre, Fields, & Johansen‐Berg, 2012). The most common diffusion MRI measures are from the diffusion tensor imaging (DTI) model (Pierpaoli, Jezzard, Basser, Barnett, & Di Chiro, 1996). More advanced models have been developed including neurite orientation dispersion and density imaging (NODDI) and multi‐compartment microscopic diffusion imaging based on the spherical mean technique (SMT), both of which measure axon density, but SMT also factors out influences from fibre crossings (Kaden, Kelm, Carson, Does, & Alexander, 2016; Zhang, Schneider, Wheeler‐Kingshott, & Alexander, 2012). Thus, NODDI and SMT may provide more specific measures of training‐induced neuroplasticity than DTI alone.
The aim of the current study was to explore whether working memory training using Cogmed is associated with changes in brain cortical morphometry, white matter microstructure or blood oxygenation level‐dependent (BOLD) signal during an n‐back working memory task in children born EP/ELBW, compared with a placebo program. We hypothesised that Cogmed would be associated with greater changes in brain structural and functional MRI measures compared with the placebo program. As reviewed above, previous studies outside the EP/ELBW population have reported that working memory training is associated with both increases and decreases in measures of brain structure and function in various brain regions, dependent on the population studied, type of training and brain region analysed (Brehmer et al., 2011; Buschkuehl et al., 2012; Caeyenberghs et al., 2016; Constantinidis & Klingberg, 2016; Everts et al., 2017; Metzler‐Baddeley et al., 2016b; Metzler‐Baddeley et al., 2017; Olesen et al., 2004; Stevens et al., 2016; Yoncheva et al., 2017). Therefore, we have not made specific hypotheses about the direction of possible brain changes following Cogmed training in EP/ELBW children. Additionally, given the lack of previous research in EP/ELBW children, we have not made hypotheses about the location of possible brain changes following Cogmed; rather we used a whole‐brain, exploratory approach.
2. METHODS
2.1. Participants
This study used data collected as part of the ‘Improving Memory in a Preterm Randomised Intervention Trial’ (IMPRINT) study (Anderson et al., 2018; Pascoe et al., 2013). The trial was nested within a geographical cohort of children born EP/ELBW in the state of Victoria, Australia in 2005 (n = 221) (Doyle et al., 2010). Children in the geographical cohort were eligible to participate in the trial if they attended their scheduled 7‐year follow‐up, were attending mainstream schooling, and did not have a severe neurosensory impairment that affected their capacity to complete the training. Of the 172 children who attended the follow‐up, 91 children were recruited and randomised to either the Cogmed working memory training program or a control program (placebo; Anderson et al., 2018). Of the 91 children recruited, 60 had MRI pretraining (Cogmed: n = 30; placebo: n = 30), of which 57 also had MRI posttraining (Cogmed: n = 28; placebo: n = 29). Of the 57 participants scanned at both time points, all had structural MRI, 56 had diffusion MRI and 29 had task‐based functional MRI (Figure 1). The trial was approved by the relevant Human Research and Ethics Committees, and written consent was obtained from the primary caregiver of participating children.
Figure 1.
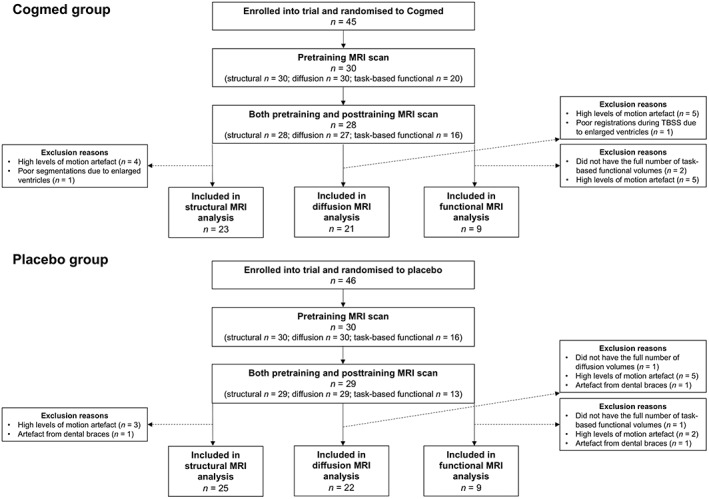
Participant flow chart. This figure shows the number of children who were enrolled into the trial and randomised to either Cogmed or placebo, and of those, the number who had usable scans at both pretraining and posttraining time points and were thus included in the current analysis. MRI, magnetic resonance imaging; TBSS, tract‐based spatial statistics
2.2. Working memory training
Children participated in Cogmed (RM version), a computerised working memory training program that involves practicing a number of working memory activities (forward and backward span tasks) for 45 min, 5 days a week for 5–7 weeks at home. The minimum number of training sessions to be defined as compliant is 20. In the Cogmed program, the difficulty level of each activity increased adaptively with the child's performance. The placebo program involved the same activities as in the Cogmed program, except the difficulty level of the working memory activities was nonadaptive and remained low. The placebo program hence controlled for the experience of sitting in front of a computer and engaging in tasks. Further details are provided in our previous publications (Anderson et al., 2018; Pascoe et al., 2013).
2.3. Magnetic resonance imaging
MRI was performed once pretraining and again within 2 weeks posttraining using a 3 Tesla Siemens Magnetom Trio, Tim system with a 32‐channel head coil, at The Melbourne Children's Campus, Parkville, Australia.
T 1‐weighted images were acquired with ultrafast magnetisation‐prepared rapid gradient‐echo (MPRAGE) sequences. The sequence parameters were as follows: repetition time (TR) = 1,900 ms; echo time (TE) = 2.27 ms; flip angle = 9°; field of view (FOV) = 210 × 210 mm; matrix size = 256 × 256; sagittal slices; slice thickness = 0.85 mm; in‐plane resolution = 0.82 mm2.
Two diffusion‐weighted echo planar imaging MRI sequences were acquired. The first sequence, referred to as ‘b1000’, was acquired with b‐values of 1,000 s/mm2, 30 gradient directions, 6 b‐value = 0 s/mm2 images, TR = 7,293 ms, TE = 87 ms, FOV = 225 × 225 mm, matrix = 98 × 98, 2.3 mm axial slices and in‐plane resolution = 2.3 mm2. The second sequence, referred to as ‘b3000’, was acquired with b‐values of 3,000 s/mm2, 45 gradient directions, 5 b‐value = 0 s/mm2 images, TR = 8,500 ms, TE = 112 ms, FOV = 225 × 225 mm, matrix size = 98 × 98, 2.3 mm axial slices and in‐plane resolution = 2.3 mm2. Along with the diffusion images, a single pair of b = 0 s/mm2 images were acquired with reversed phase‐encode blips, resulting in their distortions going in opposite directions (anterior–posterior and posterior–anterior).
Participants performed an n‐back functional MRI task (Owen, McMillan, Laird, & Bullmore, 2005). The task took 6.5 min, consisting of: (a) crosshair viewing (20 s); (b) zero‐back condition (180 s), in which children pressed a button when the letter X was shown; and (c) one‐back condition (180 s), in which children pressed a button when the same letter was shown consecutively. Functional MRI parallel imaging technique (iPAT, factor 2) echo planar imaging sequences with prospective acquisition correction (PACE) were acquired while participants completed the task. The acquisition parameters were: TR = 2,400 ms; TE = 40 ms; flip angle = 90°; FOV = 210 × 210 mm; matrix size = 64 × 64; axial slices; slice thickness = 3.3 mm; in‐plane resolution = 3.3 mm2.
2.4. Structural image processing
T 1‐weighted images were processed using the FreeSurfer image analysis suite, version 5.3.0 (Fischl, 2012). Each participant's pial and white matter surfaces were visually checked and manually edited as required. Some participants were excluded if either their pretraining or posttraining FreeSurfer output was of poor quality. Of the 57 participants who had structural MRI pretraining and posttraining, nine participants were excluded, mostly due to movement artefact (n = 7), but also due to artefact from dental braces (n = 1) and structural abnormality (enlarged ventricles) that affected surface reconstruction and regional segmentation (n = 1; Figure 1). For each participant, native vertex‐wise data were resampled into a common space (an ‘fsaverage’ surface template provided by FreeSurfer; Fischl, Sereno, Tootell, & Dale, 1999), ensuring between‐participant vertex correspondence.
2.5. Diffusion image processing
The two diffusion sequences (b1000 and b3000) were preprocessed independently using the following pipeline: (a) denoising (Veraart et al., 2016); (b) correction for movement and eddy current‐induced geometric distortions, and magnetic susceptibility‐induced geometric distortions, using the Functional MRI of the Brain (FMRIB) Software Library's (FSL's) ‘topup’ and ‘eddy’ tools from version 5.0.9 (Andersson, Skare, & Ashburner, 2003; Andersson & Sotiropoulos, 2016); and (c) brain extraction using FSL's Brain Extraction Tool (Smith, 2002). The DTI model was fitted to the b1000 sequence using the weighted linear least squares method (FSL's ‘dtifit’). Prior to fitting the NODDI model (Zhang et al., 2012) and the SMT model (Kaden et al., 2016), additional preprocessing was required: (a) the first b = 0 s/mm2 image of the b3000 sequence was linearly registered to the first b = 0 s/mm2 image of the b1000 sequence using FSL's Linear Image Registration tool (FLIRT; Jenkinson, Bannister, Brady, & Smith, 2002; Jenkinson & Smith, 2001), and this registration was applied to the remaining b3000 volumes to bring them into b1000 space; (b) each sequence was separately normalised by its b0 images to attempt to account for the different TE parameter values between the sequences; and (c) the b1000 and b3000 sequences were merged together. The NODDI model (Zhang et al., 2012) and the SMT model (Kaden et al., 2016) were then fitted to the combined b1000 and b3000 images. We visually checked the diffusion images and reconstructed scalar maps. Of the 56 participants who had diffusion MRI, 10 participants were excluded due to motion artefact in either their first or second time point diffusion images and 1 participant was excluded due to artefacts generated by dental braces (Figure 1).
The DTI, NODDI and SMT data were then processed using a combination of DTI ToolKit (DTI‐TK; version 2.3.1) tools and FSL tools. We followed documented steps (http://dti-tk.sourceforge.net/pmwiki/pmwiki.php?n=Documentation.TBSS) to integrate DTI‐TK's tensor‐based registration and study‐specific template into FSL's tract‐based spatial statistics (TBSS) pipeline, as recommended in previous publications as the state‐of‐the‐art method for voxel‐wise analysis of diffusion tensor data (Bach et al., 2014). First, FSL's ‘dtifit’ outputs were converted into DTI‐TK's single volume nifti‐tensor format. Then, DTI‐TK was used for tensor‐based registration of all the participants’ volumes to a study‐specific template (Zhang, Yushkevich, Alexander, & Gee, 2006). From the spatially normalised volumes, we generated high‐resolution (1 mm3) fractional anisotropy (FA), axial diffusivity (AD), radial diffusivity (RD) and mean diffusivity (MD) images using DTI‐TK, and a mean FA image using FSL. We then used FSL's TBSS tools (Smith et al., 2006) to generate a FA skeleton (threshold 0.2). Maximal FA values within close proximity to the skeleton, assumed to be the centre of the white matter bundle, were projected onto the skeleton. The AD, RD and MD images were also projected onto the mean FA skeleton using the same projection method. The scalar maps from NODDI (neurite orientation dispersion and density) and SMT (neurite density and intrinsic diffusivity) were normalised to the study‐specific template using the transformations calculated during the tensor‐based registration. The normalised NODDI and SMT maps were then projected onto the mean FA skeleton using the original distance maps from the FA projection. This was similar to a previously published method (Timmers et al., 2015). We visually checked all of the registrations of the scalar maps to the population‐specific template, and excluded one participant with poor registration caused by enlarged ventricles.
2.6. Task‐based functional image processing
Functional images were processed using the Functional MRI Expert Analysis Tool (FEAT) version 6 from FSL version 5.0.6 (different to the FSL version used for diffusion processing as the functional analysis was undertaken first). The images underwent brain extraction using BET (Smith, 2002), motion correction using a FLIRT based algorithm (MCFLIRT; Jenkinson et al., 2002), temporal filtering with a 100 s high pass filter to remove low drifts, and spatial smoothing with a Gaussian kernel with a full width at half maximum (FWHM) of 5 mm. Functional images were registered to the T 1 images using boundary‐based registration (Greve & Fischl, 2009) and then the T 1 images were nonlinearly registered to the MNI152 atlas. All affine transforms (motion correction, functional to T 1 space and T 1 space to MNI152 space) were composed and functional images were resliced into MNI152 atlas space using spline interpolation. Of the 29 participants who had task‐based functional MRI pretraining and posttraining, we excluded 3 participants because they did not have the total number of volumes, 7 participants because they had motion artefact and 1 participant because they had artefact from dental braces.
For the first level analysis (Woolrich, Ripley, Brady, & Smith, 2001), we used FSL's method for general linear modelling, FMRIB's improved linear model (FILM). Three contrasts of interest were generated: zero‐back task versus crosshair viewing, one‐back task versus crosshair viewing and one‐back task versus zero‐back task. We used an event‐related design convolved with the gamma function, and we applied temporal filtering and the temporal derivative. The rigid‐body motion parameter estimates were added as an additional confounding variable. We also used FILM's prewhitening for removal of temporal autocorrelations. The first level statistical images were thresholded using cluster thresholding, with Z > 2.3 and p < .05, family‐wise error rate‐corrected.
2.7. Statistical analyses
Statistical analyses were performed using the following methods.
Cortical morphometry: Vertex‐wise statistical analysis of left and right hemisphere cortical thickness, area and volume was performed using the paired analysis stream in FreeSurfer (https://surfer.nmr.mgh.harvard.edu/fswiki/PairedAnalysis). Per‐vertex posttraining minus pretraining differences were computed for each measure. Data were smoothed using a geodesic Gaussian kernel with a FWHM of 10 mm. General linear modelling was employed.
White matter microstructure: Voxel‐wise statistical analysis of the skeletonised diffusion images (FA, AD, RD, MD from DTI, neurite density and orientation dispersion from NODDI and neurite density and intrinsic diffusivity from SMT) was performed using general linear modelling and nonparametric permutation testing with the FSL ‘Randomise’ tool (Winkler, Ridgway, Webster, Smith, & Nichols, 2014). For all tests, 5,000 permutations were performed and threshold‐free cluster enhancement (TFCE) was applied. To perform paired analyses, we calculated the difference between the pretraining and posttraining skeletonised diffusion values for each participant.
Task‐based functional MRI: For the second level (group level) analysis (Woolrich, Behrens, Beckmann, Jenkinson, & Smith, 2004), we used FMRIB's local analysis of mixed effects (FLAME).
First, as a descriptive analysis only and to enable comparison with previous studies that did not include placebo groups, we examined whether there were differences between the pretraining and posttraining data for the Cogmed and placebo groups separately. To do this, we performed the following analyses.
Cortical morphometry and white matter microstructure: We tested whether the mean paired difference for each measure differed from zero using one‐sample t‐tests.
Task‐based functional MRI: We created a general linear model design to conduct a paired t test between the pretraining and posttraining measurements in the Cogmed and placebo groups separately.
Second, as the inferential analysis, to investigate possible training‐specific effects (whether any changes in the data from pretraining to posttraining differed between the Cogmed and placebo groups), we performed the following analyses.
Cortical morphometry and white matter microstructure: We tested whether the mean paired difference for each measure differed between the Cogmed and placebo groups using two‐sample t tests.
Task‐based functional MRI: We performed group‐by‐time interactions by creating a ‘2‐group, 2‐levels per subject’ general linear model design (https://fsl.fmrib.ox.ac.uk/fsl/fslwiki/FEAT/UserGuide#ANOVA:_2-factors_2-levels).
For all data, two separate secondary analyses were performed: (a) including age difference between pretraining and posttraining scans as a covariate in all the general linear models; (b) excluding the participants who completed less than 20 training sessions from the inferential analysis, to investigate whether training‐specific neuroplastic changes could be influenced by lack of compliance to the minimum recommended 20 training sessions.
Multiple comparison correction was performed as follows.
Cortical morphometry: Correction for vertex‐wise multiple comparisons was performed using a cluster‐wise (Monte Carlo simulation) method, with a cluster‐forming threshold of p < .0001, adjusting for the two hemispheres and two signs (positive and negative tests), and a cluster‐wise threshold of p < .05 (Hagler Jr., Saygin, & Sereno, 2006).
White matter microstructure: Results were considered significant at p < .05 following correction to control the family‐wise error rate across all skeleton voxels. To obtain the coordinates in standard space of significant clusters, we registered the study‐specific template to the MNI152 1 mm3 T 1 image using FLIRT, and applied this registration to the significant clusters to bring them into MNI space.
Task‐based functional MRI: Results of the second level analysis were thresholded using cluster thresholding, with Z > 2.3 and p < .05, family‐wise error‐rate corrected. Regions of statistical significance were anatomically localised using the ‘Talairach Daemon Labels’ atlas provided within FSL (Lancaster et al., 2000).
3. RESULTS
3.1. Participant characteristics
After exclusions during image processing, the sample included 48 participants with usable cortical morphometry data, 43 participants with usable white matter microstructure data and 18 participants with usable task‐based functional data, at both pretraining and posttraining (Figure 1).
Characteristics of the structural, diffusion and functional analysis subsamples are reported in Table 1. Baseline characteristics (perinatal medical data, sex, age) were similar between participants in the Cogmed and placebo groups in each of the subsamples. The number of completed training sessions was similar between Cogmed and placebo groups, although not all participants completed the minimum recommended 20 training sessions. As reflected by the ‘Cogmed Index Improvement’ score, the children in the Cogmed group improved on Cogmed training tasks from pretraining to posttraining, however there was variability in the degree of improvement as shown by the large standard deviations. The average improvement score for our sample is similar to that reported in another comparable study in children (Barnes et al., 2016). Working memory outcomes at posttraining were similar between the Cogmed and placebo groups in each of the MRI subsamples. This is in line with the findings of our wider trial (i.e., which included all eligible participants, not just those with usable MRI data; Anderson et al., 2018).
Table 1.
Characteristics of the participants in the Cogmed and placebo groups in each of the analysis subsamples
| Characteristic | Structural sample | Diffusion sample | Functional sample | |||
|---|---|---|---|---|---|---|
| Cogmed (n = 23) | Placebo (n = 25) | Cogmed (n = 21) | Placebo (n = 22) | Cogmed (n = 9) | Placebo (n = 9) | |
| Gestational age at birth (weeks), mean (SD, min–max) | 27.0 (2.3, 23.5–33) | 26.5 (1.6, 24–31) | 26.7 (2.3, 23.5–33) | 26.5 (1.6, 24–31) | 26.6 (2.7, 23.5–33) | 27.0 (1.8, 24.3–31) |
| Birth weight (g), mean (SD, min–max) | 850 (149, 600–1,180) | 898 (225, 600–1,395) | 830 (156, 600–1,180) | 909 (220, 600–1,395) | 853 (157, 600–1,073) | 993 (256, 640–1,395) |
| Males, n (%) | 8 (35) | 13 (52) | 7 (33) | 11 (50) | 3 (33) | 5 (56) |
| Intraventricular haemorrhage grade 3 or 4a, n (%) | 2 (9) | 2 (8) | 2 (10) | 2 (9) | 1 (11) | 1 (11) |
| Cystic periventricular leukomalaciaa, n (%) | 0 (0)b | 1 (4)b | 0 (0)b | 1 (5) | 0 (0) | 1 (11) |
| Number of completed training sessions, mean (SD, min–max) | 21 (7, 3–25) | 22 (6, 4–25) | 21 (6, 3–25) | 21 (6, 4–25) | 22 (7, 3–25) | 24 (2, 20–25) |
| Completed less than 20 training sessions, n (%) | 4 (17) | 3 (12) | 4 (19) | 4 (18) | 1 (11) | 0 (0) |
| Cogmed index improvement scorec, mean (SD) | 25.4 (30.7)b | – | 26.9 (31.4)b | – | 20.4 (7.8)b | – |
| Corrected age at pretraining scan (years), mean (SD) | 7.9 (0.4) | 7.8 (0.4) | 7.9 (0.4) | 7.8 (0.4) | 8.1 (0.3) | 8.0 (0.4) |
| Corrected age at posttraining scan (years), mean (SD) | 8.0 (0.4) | 7.9 (0.4) | 8.0 (0.4) | 7.9 (0.5) | 8.2 (0.3) | 8.2 (0.4) |
| Age difference between pretraining and posttraining scans (months), mean (SD) | 1.81 (0.34) | 1.77 (0.47) | 1.8 (0.3) | 1.8 (0.5) | 1.80 (0.36) | 1.72 (0.33) |
| Intracranial volume pretraining (cm3), mean (SD) | 1,383 (172) | 1,371 (154) | – | – | – | – |
| Intracranial volume posttraining (cm3), mean (SD) | 1,390 (200) | 1,395 (180) | – | – | – | – |
| Change in intracranial volume between pretraining and posttraining (cm3), mean (SD, % of pretraining volume) | 7 (59, 0.4) | 25 (64, 1.7) | – | – | – | – |
| Working memory (backward digit recall) pretrainingd, mean (SD) | 9.0 (2.6)b | 9.2 (2.8)b | 9.0 (2.4) | 9.2 (2.9)b | 8.9 (2.4) | 9.6 (1.7) |
| Working memory (backward digit recall) posttrainingd, mean (SD) | 11.2 (4.1) | 12.2 (3.9)b | 12.0 (3.6) | 12.2 (3.9)b | 11.9 (4.0) | 12.8 (4.4) |
| Working memory (mister X) pretrainingd, mean (SD) | 7.2 (3.1)b | 8.7 (4.0)e | 7.5 (3.2)b | 8.5 (3.8)e | 7.8 (4.1) | 9.5 (4.5)b |
| Working memory (mister X) posttrainingd, mean (SD) | 9.5 (3.8) | 9.2 (3.4) | 10.0 (3.4) | 9.0 (3.7) | 10.0 (2.9) | 11.0 (2.9) |
| Working memory (backward block recall) pretrainingd, mean (SD) | 12.0 (5.7)b | 13.0 (4.8)b | 12.1 (4.9)b | 14.0 (4.7)b | 13.1 (5.1) | 14.3 (4.6) |
| Working memory (backward block recall) posttrainingd, mean (SD) | 15.9 (5.2) | 14.2 (4.8) | 15.8 (4.6) | 14.5 (5.0) | 16.8 (5.0) | 16.0 (3.9) |
Abbreviation: SD, standard deviation.
Major brain injuries, intraventricular haemorrhage and periventricular leukomalacia, were diagnosed from cranial ultrasounds during the neonatal period. Intraventricular haemorrhage was graded according to a previous publication (Papile et al., 1978).
n = 1 missing.
The Cogmed Index Improvement Score is a score provided by the program for the Cogmed group only, and represents the average improvement on the two trained working memory tasks over the course of training.
Working memory was assessed using subtests of the Working Memory Test Battery for Children (WMTB‐C; the Backward Digit Recall and Backward Block Recall subtests are presented here) and Automated Working Memory Assessment (AWMA; the Mister X subtest is presented here); raw scores were used (Anderson et al., 2018).
n = 2 missing.
Characteristics were also generally similar between the participants and nonparticipants (i.e., those of the original n = 91 participants who were enrolled in the trial but were subsequently excluded from the MRI analyses; data not shown). However, the participants had a slightly younger gestational age at birth than nonparticipants (for the structural sample, mean difference 95% confidence interval, CI, = −0.8 [−1.6, 0.04] weeks, p = .06; for the diffusion sample, mean difference [95% CI] = −1.0 [−1.8, −0.1] weeks, p = .02; for the functional sample, mean difference [95% CI] = −0.4 [−1.5, 0.7] weeks, p = .5). Additionally, more participants included in the MRI analyses completed the minimum recommended 20 training sessions compared with nonparticipants (for the structural sample, 85% vs. 60%, p = .009; for the diffusion sample, 81% vs. 67%, p = .1; for the functional sample, 94% vs. 67%, p = .05).
3.2. Cortical structure results
Most of the cortex did not increase or decrease significantly in thickness, area or volume from pretraining to posttraining in the Cogmed or placebo groups. The one exception was a small cluster in the left lateral occipital cortex, in which thickness decreased significantly over time in the placebo group but not in the Cogmed group (Figure 2a). Group‐by‐time interactions for thickness, area and volume were generally nonsignificant, except for a similar small cluster in the left lateral occipital cortex (Figure 2b). In this cluster, cortical thickness decreased between pretraining and posttraining in the placebo group, but increased slightly in the Cogmed group; the mean (standard deviation) difference over time for the placebo group was −0.17 (0.13) mm versus 0.05 (0.10) mm for the Cogmed group.
Figure 2.

FreeSurfer results. (a) The cluster of vertices in the left lateral occipital cortex in which thickness decreased significantly (p < .05, multiple comparison corrected) between pretraining and posttraining in the placebo group, shown in blue. (b) The cluster of vertices that had a significant group‐by‐time interaction for cortical thickness, shown in red. For each cluster, the number of vertices it occupies and its size in mm2, are shown. The percentage refers to the cluster's size relative to the total cortical surface area (65,416.6 mm2)
When we adjusted for age difference between pretraining and posttraining scans, there were no longer any significant changes over time in either group, or group‐by‐time interactions, for cortical thickness, area or volume.
When we excluded the participants who completed less than the minimum recommended 20 training sessions, there remained a significant group‐by‐time interaction for thickness in the left lateral occipital cortex (228 vertices), and there remained no significant group‐by‐time interactions for cortical area or volume.
3.3. White matter microstructure results
Neurite density from both NODDI and SMT increased significantly between pretraining and posttraining in both the Cogmed and placebo groups (Figure 3). Regions increasing in NODDI density in the Cogmed group included the corpus callosum, corona radiata, internal and external capsules, cerebral peduncle, left corticospinal tract and right thalamic white matter, while in the placebo group included the corpus callosum and left corona radiata, internal capsule and superior longitudinal fasciculus. Regions increasing in SMT density in the Cogmed group included the corpus callosum, and in the placebo group included the corpus callosum, corona radiata and left superior longitudinal fasciculus. There were no regions where neurite density decreased significantly in the pretraining to posttraining period in the Cogmed or placebo groups. There was little evidence that the remaining diffusion measures—FA, AD, RD and MD from DTI, neurite orientation dispersion from NODDI and intrinsic diffusivity from SMT—changed between pretraining and posttraining in either group.
Figure 3.

Tract‐based spatial statistics results. Regions where neurite density based on Neurite Orientation Dispersion and Density Imaging (NODDI) and the Spherical Mean Technique (SMT) increased significantly from pretraining to posttraining in the Cogmed and placebo groups. The number of voxels that increased significantly over time and their percentage of the mean fractional anisotropy (FA) skeleton (total 68,099 voxels) are also shown. All results are presented at p < .05, family‐wise error rate (FWE)‐corrected. p values are overlaid on the study specific template (mean FA image). TFCE, threshold‐free cluster enhancement
There were no significant group‐by‐time interactions for most microstructure parameters, except for FA. There was one small cluster of 20 voxels (0.03% of the mean FA skeleton; centre of gravity = −26.9 × 3.84 × 31.6 mm; located approximately in the left superior corona radiata) in which FA increased slightly between pretraining and posttraining in the Cogmed group, but decreased slightly over this period in the placebo group. Due to the small size of this cluster relative to the size of the mean FA skeleton, these results have not been shown.
When we adjusted for age difference between pretraining and posttraining scans, results were similar, that is, there remained significant increases in neurite density from pretraining to posttraining in both groups, and there remained few group‐by‐time interactions for the diffusion parameters.
When we excluded the participants who completed less than the minimum recommended 20 training sessions, there were no significant group‐by‐time interactions for any diffusion parameters.
3.4. Functional results
BOLD signal increase during completion of the n‐back task (one‐back versus zero‐back) increased significantly from pretraining to posttraining in the Cogmed group, in the precuneus and posterior cingulate cortices, but not in the placebo group (Figure 4). However, no significant group‐by‐time interactions for BOLD signal during the n‐back task were identified.
Figure 4.
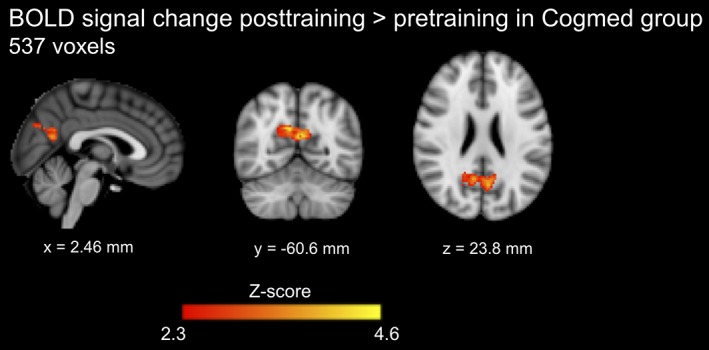
Task‐based functional MRI results. The regions where the blood oxygenation level‐dependent (BOLD) signal increase during completion of the n‐back task (one‐back condition vs. zero‐back condition) increased significantly from pretraining to posttraining in the Cogmed group. The number of significant voxels is shown. Results are presented at Z‐score >2.3 and p < .05, family wise error rate corrected. The coordinates beneath the images are MNI coordinates
When we adjusted for age difference between pretraining and posttraining scans, results were similar, that is, there remained significant increases in BOLD signal change during completion of the n‐back task from pretraining to posttraining in the Cogmed group, and there remained no significant group‐by‐time interactions for BOLD signal change.
When we excluded the participants who completed less than the minimum recommended 20 training sessions, there were no significant group‐by‐time interactions for BOLD signal change.
4. DISCUSSION
The overall finding of this study is that, in general, Cogmed did not differentially affect brain changes over time in EP/ELBW children compared with placebo training. Indeed, there were few significant group‐by‐time interaction effects observed across the MRI modalities and measures.
In terms of cortical morphometry, the volume, area and thickness for most of the cortex remained stable during the pretraining to posttraining period for both the Cogmed and placebo groups. There was a small region in the left lateral occipital cortex in which the change in thickness from pretraining to posttraining differed significantly between the Cogmed and placebo groups; thickness decreased slightly in the placebo group but increased slightly in the Cogmed group. However, this finding should be interpreted with caution given its small spatial extent (<1% of the total cortex), and the fact that it was no longer significant after accounting for variances in age between participants, meaning it may reflect a type 1 error despite vertex‐wise multiple comparison correction. Additionally, the cortex is thin and curved in the location of the significant cluster, which may lead to errors in the placement of the pial and white matter surfaces during FreeSurfer's preprocessing pipeline, and thus partial volume effects may have influenced the result. Indeed, previous studies have found small differences in FreeSurfer cortical thickness measurements when compared with ground‐truth histological or manual methods for measuring cortical thickness of approximately 0.1–0.5 mm (Cardinale et al., 2014; Kuperberg et al., 2003; Rosas et al., 2002; Salat et al., 2004). This is similar to the magnitude of change over time in cortical thickness reported in the current study. This does not necessarily imply that the current differences in cortical thickness change over time between groups are not real or important, because any measurement error should affect both the Cogmed and placebo groups equally (and will be reflected in the standard errors for the measurements in both groups). However, the potential for error in cortical thickness measurement to influence the results should be considered. While no previous studies have examined the effects of Cogmed on cortical morphometry in children, a study in healthy adults aged 19–40 years examined the effects of Cogmed on cortical morphometry using similar methods to those we used (Metzler‐Baddeley et al., 2016b; Metzler‐Baddeley, Caeyenberghs, Foley, & Jones, 2016a). Their results were similar, in that on vertex‐wise analysis, they found no significant group‐by‐time interactions (Metzler‐Baddeley et al., 2016a). On analysis of parcellated regions of interest, they found that the thickness of the right caudal middle frontal and right pars opercularis, and volume of the left pallidum, displayed small increases in the Cogmed group and small decreases in the placebo group from pretraining to posttraining, but these group‐by‐time interactions did not survive multiple‐comparison correction (Metzler‐Baddeley et al., 2016b).
We found few significant training‐specific changes in white matter microstructure, although both groups showed relatively widespread increases in neurite density. This may reflect typical white matter development (Genc, Malpas, Holland, Beare, & Silk, 2017; Mah, Geeraert, & Lebel, 2017). Without a placebo group, the increase in neurite density in the Cogmed group may have been incorrectly interpreted as training‐induced neuroplasticity, reinforcing the strength of a randomised controlled design.
There were no significant group‐by‐time interactions for brain activation during completion of the n‐back working memory task. Our only finding was increased activation during the task from pretraining to posttraining in the Cogmed group only, consistent with previous studies that found changes in brain activity following Cogmed in children (Stevens et al., 2016; Yoncheva et al., 2017). However, unlike our study, these previous studies did not include placebo groups, and therefore could not determine if changes in brain activation were specific to Cogmed or reflected typical development. Our lack of evidence for group‐by‐time interactions suggests that Cogmed does not have training‐specific effects on brain activity in response to the n‐back task, which is different to the working memory training activities (forward and backward span tasks) performed during Cogmed.
Our study is strengthened by the use of a population‐based sample and randomised controlled design, including an active control group. A limitation is that our structural, microstructural and functional MRI analyses all depend on accurate registration to a template. Specific to TBSS, while we attempted to improve the standard TBSS pipeline by performing tensor‐based registration, our TBSS results must be interpreted with the known limitations of the skeletonisation step in mind, that is, that it introduces a spatial heterogeneity and orientational dependency of the statistical sensitivity, and has limited ability for anatomical localisation (Bach et al., 2014; Edden & Jones, 2011; Van Hecke et al., 2010). The number of participants with usable MRI data in our study was similar to or larger than in other related studies (Barnes et al., 2016; Metzler‐Baddeley et al., 2016b; Stevens et al., 2016; Yoncheva et al., 2017). However, our task‐based functional MRI analysis was based on a small sample, which yielded low power to detect training‐specific effects. Another limitation is that not all participants completed the minimum recommended number of training sessions, raising the possibility that these children may not have completed enough training to induce neural changes. However, secondary analyses excluding these participants revealed similar results to the original analyses. This indicates that lack of compliance with the training program did not explain the lack of training‐induced neuroplastic changes.
Based on the same trial, we previously observed little benefit of Cogmed on working memory and academic outcomes in children born EP/ELBW (Anderson et al., 2018). When we performed a similar analysis of working memory outcomes in the Cogmed compared with the placebo participants for the MRI subsamples, we also found little difference in working memory performance between groups. Hence, overall, while we speculated that MRI may be sensitive for detecting subtle neuroplastic changes even in the absence of cognitive improvements, it appears that the results in the current study are consistent with our previous report (Anderson et al., 2018), and that in our trial, lack of training‐induced cognitive improvements and lack of neuroplastic changes occurred simultaneously. The lack of training‐induced cognitive improvements in the wider trial (Anderson et al., 2018) could have limited our power to detect neuroplastic changes.
5. CONCLUSIONS
While we found some structural and functional brain changes between the pretraining and posttraining period in our sample of children born EP/ELBW who undertook Cogmed training, we found little evidence of training‐induced neuroplasticity, with similar changes generally identified in both the Cogmed and placebo groups. This study is based on a population of EP/ELBW children, and therefore cannot be generalised to other populations. Further research is needed using larger scale randomised controlled trials in different clinical populations to determine whether working memory training programs like Cogmed are beneficial and associated with training‐induced neuroplasticity. Based on the available evidence and converging findings from the current study and our previous study (Anderson et al., 2018), there is currently insufficient evidence that Cogmed is effective in improving working memory and brain structure and function in EP/ELBW children compared with a placebo program.
CONFLICT OF INTEREST
The authors declare no conflicts of interest.
ACKNOWLEDGMENTS
This research was conducted within the Developmental Imaging and Victorian Infant Brain Studies research groups at the Murdoch Children's Research Institute, and the Children's MRI Centre at the Royal Children's Hospital, Melbourne, Victoria. We thank all participating children and families who made this research possible. We thank the Royal Children's Hospital Medical Imaging staff for their assistance and expertise in the collection of the MRI data included in this study. This study was supported by the Murdoch Children's Research Institute, the Royal Children's Hospital, The Royal Children's Hospital Foundation, the Department of Paediatrics at The University of Melbourne, Monash University and the Victorian Government's Operational Infrastructure Support Program. This study was also supported by the Australian National Health and Medical Research Council (NHMRC: Project Grant 1028422, Centre of Research Excellence in Newborn Medicine [1060733], Program Grant 606789, Senior Research Fellowship 1081288 and Career Development Fellowships 1085754 and 1127984). The funding sources had no role in the design, data collection, analysis, interpretation or writing of the study, or in the decision to submit it for publication.
Kelly CE, Thompson DK, Chen J, et al. Working memory training and brain structure and function in extremely preterm or extremely low birth weight children. Hum Brain Mapp. 2020;41:684–696. 10.1002/hbm.24832
Funding information Department of Paediatrics at The University of Melbourne, Melbourne, Australia; Monash University, Melbourne, Australia; Murdoch Children's Research Institute, Melbourne, Australia; National Health and Medical Research Council, Grant/Award Numbers: 1028422, 1060733, 1081288, 1085754, 1127984, 606789; The Royal Children's Hospital Foundation, Melbourne, Australia; Victorian Government's Operational Infrastructure Support Program, Australia; The Royal Children's Hospital, Melbourne, Australia
DATA AVAILABILITY STATEMENT
The data that support the findings of this study are available from the corresponding author upon reasonable request.
REFERENCES
- Anderson, P. J. (2014). Neuropsychological outcomes of children born very preterm. Seminars in Fetal & Neonatal Medicine, 19, 90–96. [DOI] [PubMed] [Google Scholar]
- Anderson, P. J. , Doyle, L. W. , & Victorian Infant Collaborative Study Group . (2004). Executive functioning in school‐aged children who were born very preterm or with extremely low birth weight in the 1990s. Pediatrics, 114, 50–57. [DOI] [PubMed] [Google Scholar]
- Anderson, P. J. , Lee, K. J. , Roberts, G. , Spencer‐Smith, M. M. , Thompson, D. K. , Seal, M. L. , … Pascoe, L. (2018). Long‐term academic functioning following Cogmed working memory training for children born extremely preterm: A randomized controlled trial. The Journal of Pediatrics, 202, 92–97. [DOI] [PubMed] [Google Scholar]
- Andersson, J. L. , Skare, S. , & Ashburner, J. (2003). How to correct susceptibility distortions in spin‐echo echo‐planar images: Application to diffusion tensor imaging. NeuroImage, 20, 870–888. [DOI] [PubMed] [Google Scholar]
- Andersson, J. L. R. , & Sotiropoulos, S. N. (2016). An integrated approach to correction for off‐resonance effects and subject movement in diffusion MR imaging. NeuroImage, 125, 1063–1078. [DOI] [PMC free article] [PubMed] [Google Scholar]
- Astle, D. E. , Barnes, J. J. , Baker, K. , Colclough, G. L. , & Woolrich, M. W. (2015). Cognitive training enhances intrinsic brain connectivity in childhood. The Journal of Neuroscience, 35, 6277–6283. [DOI] [PMC free article] [PubMed] [Google Scholar]
- Bach, M. , Laun, F. B. , Leemans, A. , Tax, C. M. , Biessels, G. J. , Stieltjes, B. , & Maier‐Hein, K. H. (2014). Methodological considerations on tract‐based spatial statistics (TBSS). NeuroImage, 100, 358–369. [DOI] [PubMed] [Google Scholar]
- Barnes, J. J. , Nobre, A. C. , Woolrich, M. W. , Baker, K. , & Astle, D. E. (2016). Training working memory in childhood enhances coupling between Frontoparietal control network and task‐related regions. The Journal of Neuroscience, 36, 9001–9011. [DOI] [PMC free article] [PubMed] [Google Scholar]
- Brehmer, Y. , Rieckmann, A. , Bellander, M. , Westerberg, H. , Fischer, H. , & Backman, L. (2011). Neural correlates of training‐related working‐memory gains in old age. NeuroImage, 58, 1110–1120. [DOI] [PubMed] [Google Scholar]
- Buschkuehl, M. , Jaeggi, S. M. , & Jonides, J. (2012). Neuronal effects following working memory training. Developmental Cognitive Neuroscience, 2(Suppl 1), S167–S179. [DOI] [PMC free article] [PubMed] [Google Scholar]
- Caeyenberghs, K. , Metzler‐Baddeley, C. , Foley, S. , & Jones, D. K. (2016). Dynamics of the human structural connectome underlying working memory training. The Journal of Neuroscience, 36, 4056–4066. [DOI] [PMC free article] [PubMed] [Google Scholar]
- Cardinale, F. , Chinnici, G. , Bramerio, M. , Mai, R. , Sartori, I. , Cossu, M. , … Ferrigno, G. (2014). Validation of FreeSurfer‐estimated brain cortical thickness: Comparison with histologic measurements. Neuroinformatics, 12, 535–542. [DOI] [PubMed] [Google Scholar]
- Constantinidis, C. , & Klingberg, T. (2016). The neuroscience of working memory capacity and training. Nature Reviews. Neuroscience, 17, 438–449. [DOI] [PubMed] [Google Scholar]
- Doyle, L. W. , Roberts, G. , Anderson, P. J. , & Victorian Infant Collaborative Study Group . (2010). Outcomes at age 2 years of infants < 28 weeks’ gestational age born in Victoria in 2005. The Journal of Pediatrics, 156, 49–53.e1. [DOI] [PubMed] [Google Scholar]
- Edden, R. A. , & Jones, D. K. (2011). Spatial and orientational heterogeneity in the statistical sensitivity of skeleton‐based analyses of diffusion tensor MR imaging data. Journal of Neuroscience Methods, 201, 213–219. [DOI] [PMC free article] [PubMed] [Google Scholar]
- Everts, R. , Murner‐Lavanchy, I. , Schroth, G. , & Steinlin, M. (2017). Neural change following different memory training approaches in very preterm born children—A pilot study. Developmental Neurorehabilitation, 20, 14–24. [DOI] [PubMed] [Google Scholar]
- Fischl, B. (2012). FreeSurfer. NeuroImage, 62, 774–781. [DOI] [PMC free article] [PubMed] [Google Scholar]
- Fischl, B. , Sereno, M. I. , Tootell, R. B. , & Dale, A. M. (1999). High‐resolution intersubject averaging and a coordinate system for the cortical surface. Human Brain Mapping, 8, 272–284. [DOI] [PMC free article] [PubMed] [Google Scholar]
- Froudist‐Walsh, S. , Karolis, V. , Caldinelli, C. , Brittain, P. J. , Kroll, J. , Rodriguez‐Toscano, E. , … Nosarti, C. (2015). Very early brain damage leads to Remodeling of the working memory system in adulthood: A combined fMRI/Tractography study. The Journal of Neuroscience, 35, 15787–15799. [DOI] [PMC free article] [PubMed] [Google Scholar]
- Genc, S. , Malpas, C. B. , Holland, S. K. , Beare, R. , & Silk, T. J. (2017). Neurite density index is sensitive to age related differences in the developing brain. NeuroImage, 148, 373–380. [DOI] [PubMed] [Google Scholar]
- Greve, D. N. , & Fischl, B. (2009). Accurate and robust brain image alignment using boundary‐based registration. NeuroImage, 48, 63–72. [DOI] [PMC free article] [PubMed] [Google Scholar]
- Grunewaldt, K. H. , Lohaugen, G. C. , Austeng, D. , Brubakk, A. M. , & Skranes, J. (2013). Working memory training improves cognitive function in VLBW preschoolers. Pediatrics, 131, e747–e754. [DOI] [PubMed] [Google Scholar]
- Grunewaldt, K. H. , Skranes, J. , Brubakk, A. M. , & Lahaugen, G. C. (2016). Computerized working memory training has positive long‐term effect in very low birthweight preschool children. Developmental Medicine and Child Neurology, 58, 195–201. [DOI] [PubMed] [Google Scholar]
- Hagler, D. J., Jr. , Saygin, A. P. , & Sereno, M. I. (2006). Smoothing and cluster thresholding for cortical surface‐based group analysis of fMRI data. NeuroImage, 33, 1093–1103. [DOI] [PMC free article] [PubMed] [Google Scholar]
- Hutchinson, E.A. , De Luca, C.R. , Doyle, L.W. , Roberts, G. , Anderson, P.J. , Victorian Infant Collaborative Study Group . (2013) School‐age outcomes of extremely preterm or extremely low birth weight children. Pediatrics, 131:e1053‐61Placeholder Text. [DOI] [PubMed] [Google Scholar]
- Jenkinson, M. , Bannister, P. , Brady, M. , & Smith, S. (2002). Improved optimization for the robust and accurate linear registration and motion correction of brain images. NeuroImage, 17, 825–841. [DOI] [PubMed] [Google Scholar]
- Jenkinson, M. , & Smith, S. (2001). A global optimisation method for robust affine registration of brain images. Medical Image Analysis, 5, 143–156. [DOI] [PubMed] [Google Scholar]
- Kaden, E. , Kelm, N. D. , Carson, R. P. , Does, M. D. , & Alexander, D. C. (2016). Multi‐compartment microscopic diffusion imaging. NeuroImage, 139, 346–359. [DOI] [PMC free article] [PubMed] [Google Scholar]
- Kerr‐Wilson, C. O. , Mackay, D. F. , Smith, G. C. , & Pell, J. P. (2012). Meta‐analysis of the association between preterm delivery and intelligence. Journal of Public Health (Oxford, England), 34, 209–216. [DOI] [PubMed] [Google Scholar]
- Kuperberg, G. R. , Broome, M. R. , McGuire, P. K. , David, A. S. , Eddy, M. , Ozawa, F. , … Fischl, B. (2003). Regionally localized thinning of the cerebral cortex in schizophrenia. Archives of General Psychiatry, 60, 878–888. [DOI] [PubMed] [Google Scholar]
- Lancaster, J. L. , Woldorff, M. G. , Parsons, L. M. , Liotti, M. , Freitas, C. S. , Rainey, L. , … Fox, P. T. (2000). Automated Talairach atlas labels for functional brain mapping. Human Brain Mapping, 10, 120–131. [DOI] [PMC free article] [PubMed] [Google Scholar]
- Lee, C. S. C. , Pei, J. , Andrew, G. , Kerns, A. K. , & Rasmussen, C. (2017). Effects of working memory training on children born preterm. Applied Neuropsychology: Child, 6, 281–296. [DOI] [PubMed] [Google Scholar]
- Lohaugen, G. C. , Antonsen, I. , Haberg, A. , Gramstad, A. , Vik, T. , Brubakk, A. M. , & Skranes, J. (2011). Computerized working memory training improves function in adolescents born at extremely low birth weight. The Journal of Pediatrics, 158, 555–561.e4. [DOI] [PubMed] [Google Scholar]
- Mah, A. , Geeraert, B. , & Lebel, C. (2017). Detailing neuroanatomical development in late childhood and early adolescence using NODDI. PLoS One, 12, e0182340. [DOI] [PMC free article] [PubMed] [Google Scholar]
- Metzler‐Baddeley, C. , Caeyenberghs, K. , Foley, S. , & Jones, D. K. (2016a). Longitudinal data on cortical thickness before and after working memory training. Data in Brief, 7, 1143–1147. [DOI] [PMC free article] [PubMed] [Google Scholar]
- Metzler‐Baddeley, C. , Caeyenberghs, K. , Foley, S. , & Jones, D. K. (2016b). Task complexity and location specific changes of cortical thickness in executive and salience networks after working memory training. NeuroImage, 130, 48–62. [DOI] [PMC free article] [PubMed] [Google Scholar]
- Metzler‐Baddeley, C. , Foley, S. , de Santis, S. , Charron, C. , Hampshire, A. , Caeyenberghs, K. , & Jones, D. K. (2017). Dynamics of white matter plasticity underlying working memory training: Multimodal evidence from diffusion MRI and Relaxometry. Journal of Cognitive Neuroscience, 29, 1509–1520. [DOI] [PMC free article] [PubMed] [Google Scholar]
- Mulder, H. , Pitchford, N. J. , & Marlow, N. (2010). Processing speed and working memory underlie academic attainment in very preterm children. Archives of Disease in Childhood. Fetal and Neonatal Edition, 95, F267–F272. [DOI] [PubMed] [Google Scholar]
- Olesen, P. J. , Westerberg, H. , & Klingberg, T. (2004). Increased prefrontal and parietal activity after training of working memory. Nature Neuroscience, 7, 75–79. [DOI] [PubMed] [Google Scholar]
- Omizzolo, C. , Scratch, S. E. , Stargatt, R. , Kidokoro, H. , Thompson, D. K. , Lee, K. J. , … Anderson, P. J. (2014). Neonatal brain abnormalities and memory and learning outcomes at 7 years in children born very preterm. Memory, 22, 605–615. [DOI] [PMC free article] [PubMed] [Google Scholar]
- Owen, A. M. , McMillan, K. M. , Laird, A. R. , & Bullmore, E. (2005). N‐back working memory paradigm: A meta‐analysis of normative functional neuroimaging studies. Human Brain Mapping, 25, 46–59. [DOI] [PMC free article] [PubMed] [Google Scholar]
- Papile, L. A. , Burstein, J., Burstein , R., Koffler, H. (1978). Incidence and evolution of subependymal and intraventricular hemorrhage: a study of infants with birth weights less than 1,500 gm. J Pediatr, 92, 529–534. [DOI] [PubMed] [Google Scholar]
- Pascoe, L. , Roberts, G. , Doyle, L. W. , Lee, K. J. , Thompson, D. K. , Seal, M. L. , … Anderson, P. J. (2013). Preventing academic difficulties in preterm children: A randomised controlled trial of an adaptive working memory training intervention—IMPRINT study. BMC Pediatrics, 13, 144. [DOI] [PMC free article] [PubMed] [Google Scholar]
- Pierpaoli, C. , Jezzard, P. , Basser, P. J. , Barnett, A. , & Di Chiro, G. (1996). Diffusion tensor MR imaging of the human brain. Radiology, 201, 637–648. [DOI] [PubMed] [Google Scholar]
- Rosas, H. D. , Liu, A. K. , Hersch, S. , Glessner, M. , Ferrante, R. J. , Salat, D. H. , … Fischl, B. (2002). Regional and progressive thinning of the cortical ribbon in Huntington's disease. Neurology, 58, 695–701. [DOI] [PubMed] [Google Scholar]
- Sala, G. , & Gobet, F. (2017). Working memory training in typically developing children: A meta‐analysis of the available evidence. Developmental Psychology, 53, 671–685. [DOI] [PubMed] [Google Scholar]
- Salat, D. H. , Buckner, R. L. , Snyder, A. Z. , Greve, D. N. , Desikan, R. S. , Busa, E. , … Fischl, B. (2004). Thinning of the cerebral cortex in aging. Cerebral Cortex, 14, 721–730. [DOI] [PubMed] [Google Scholar]
- Smith, S. M. (2002). Fast robust automated brain extraction. Human Brain Mapping, 17, 143–155. [DOI] [PMC free article] [PubMed] [Google Scholar]
- Smith, S. M. , Jenkinson, M. , Johansen‐Berg, H. , Rueckert, D. , Nichols, T. E. , Mackay, C. E. , … Behrens, T. E. (2006). Tract‐based spatial statistics: Voxelwise analysis of multi‐subject diffusion data. NeuroImage, 31, 1487–1505. [DOI] [PubMed] [Google Scholar]
- Stevens, M. C. , Gaynor, A. , Bessette, K. L. , & Pearlson, G. D. (2016). A preliminary study of the effects of working memory training on brain function. Brain Imaging and Behavior, 10, 387–407. [DOI] [PMC free article] [PubMed] [Google Scholar]
- Thomas, C. , & Baker, C. I. (2013). Teaching an adult brain new tricks: A critical review of evidence for training‐dependent structural plasticity in humans. NeuroImage, 73, 225–236. [DOI] [PubMed] [Google Scholar]
- Timmers, I. , Zhang, H. , Bastiani, M. , Jansma, B. M. , Roebroeck, A. , & Rubio‐Gozalbo, M. E. (2015). White matter microstructure pathology in classic galactosemia revealed by neurite orientation dispersion and density imaging. Journal of Inherited Metabolic Disease, 38, 295–304. [DOI] [PMC free article] [PubMed] [Google Scholar]
- Van Hecke, W. , Leemans, A. , De Backer, S. , Jeurissen, B. , Parizel, P. M. , & Sijbers, J. (2010). Comparing isotropic and anisotropic smoothing for voxel‐based DTI analyses: A simulation study. Human Brain Mapping, 31, 98–114. [DOI] [PMC free article] [PubMed] [Google Scholar]
- Veraart, J. , Novikov, D. S. , Christiaens, D. , Ades‐Aron, B. , Sijbers, J. , & Fieremans, E. (2016). Denoising of diffusion MRI using random matrix theory. NeuroImage, 142, 394–406. [DOI] [PMC free article] [PubMed] [Google Scholar]
- Winkler, A. M. , Ridgway, G. R. , Webster, M. A. , Smith, S. M. , & Nichols, T. E. (2014). Permutation inference for the general linear model. NeuroImage, 92, 381–397. [DOI] [PMC free article] [PubMed] [Google Scholar]
- Woolrich, M. W. , Behrens, T. E. , Beckmann, C. F. , Jenkinson, M. , & Smith, S. M. (2004). Multilevel linear modelling for FMRI group analysis using Bayesian inference. NeuroImage, 21, 1732–1747. [DOI] [PubMed] [Google Scholar]
- Woolrich, M. W. , Ripley, B. D. , Brady, M. , & Smith, S. M. (2001). Temporal autocorrelation in univariate linear modeling of FMRI data. NeuroImage, 14, 1370–1386. [DOI] [PubMed] [Google Scholar]
- Yoncheva, Y. N. , Hardy, K. K. , Lurie, D. J. , Somandepalli, K. , Yang, L. , Vezina, G. , … Acosta, M. T. (2017). Computerized cognitive training for children with neurofibromatosis type 1: A pilot resting‐state fMRI study. Psychiatry Research, 266, 53–58. [DOI] [PMC free article] [PubMed] [Google Scholar]
- Zatorre, R. J. , Fields, R. D. , & Johansen‐Berg, H. (2012). Plasticity in gray and white: Neuroimaging changes in brain structure during learning. Nature Neuroscience, 15, 528–536. [DOI] [PMC free article] [PubMed] [Google Scholar]
- Zhang, H. , Schneider, T. , Wheeler‐Kingshott, C. A. , & Alexander, D. C. (2012). NODDI: Practical in vivo neurite orientation dispersion and density imaging of the human brain. NeuroImage, 61, 1000–1016. [DOI] [PubMed] [Google Scholar]
- Zhang, H. , Yushkevich, P. A. , Alexander, D. C. , & Gee, J. C. (2006). Deformable registration of diffusion tensor MR images with explicit orientation optimization. Medical Image Analysis, 10, 764–785. [DOI] [PubMed] [Google Scholar]
Associated Data
This section collects any data citations, data availability statements, or supplementary materials included in this article.
Data Availability Statement
The data that support the findings of this study are available from the corresponding author upon reasonable request.