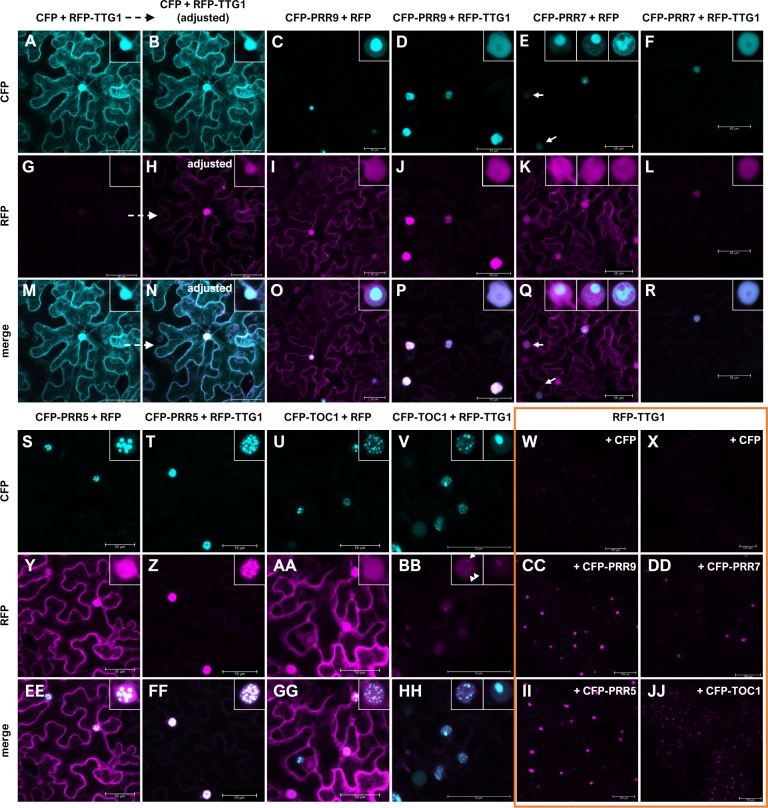
Figure 6. PRRs can re-localize TTG1 to different distinct (sub-)nuclear localizations.
Representative, sequentially scanned and merged confocal stacks of N. benthamiana leaf epidermal cells. Combinations of RFP-TTG1 or RFP with CFP-PRR and CFP given above each column were co-expressed: CFP/RFP-TTG1 (A,B,G,H,M,N,W,X), CFP-PRR9/RFP (C,I,O), CFP-PRR9/RFP-TTG1 (D,J,P,CC), CFP-PRR7/RFP (E,K,Q), CFP-PRR7/RFP-TTG1 (F,L,R,DD), CFP-PRR5/RFP (S,Y,EE) CFP-PRR5/RFP-TTG1 (T,Z,FF,II), CFP-TOC1/RFP (U,AA,GG) and CFP-TOC1/RFP-TTG1 (V,BB,HH,JJ). The CFP- (A-F, S-V) and RFP-channel (G-L, W-DD, II, JJ) were merged (M-R, EE-HH) and a brightness-contrast correction was only applied for the CFP/RFP-TTG1 combination in B, H and N to visualize RFP-TTG1 presence and localization. Insets show representative observed nuclear localization. Please note that for CFP-PRR7/RFP (and to a minor extend for CFP-TOC1/RFP-TTG1) different subnuclear localizations were seen in all three experiments conducted and that the subnuclear localization of PRR9 and PRR7 was also modified by RFP-TTG1. White arrows for CFP-PRR7/RFP (E,Q) point to week CFP fluorescing nuclei without intense subnuclear foci. These were not dominant but present. For the CFP-TOC1/RFP-TTG1 combination (BB), arrowheads in the left inset of a characteristic nucleus point to faint subnuclear foci into which RFP-TTG1 is recruited. Pictures of all nuclei, including bars for those which are shown as insets, are shown in Fig. S8. Orange box: Non-adjusted pictures of the RFP channel detection for co-infiltrations of RFP-TTG1 with CFP or CFP-tagged PRRs showing an area of the respective leave. See also Fig. S9 for pictures with increased brightness and contrast. Bars equal 50 µm for representative cells and 100 µm for the leaf areas.

