Abstract
Background
Thyroid cancer is the most common endocrine system malignancy. Scientists have done considerable research into the molecular mechanisms involved, but many mechanisms remain undiscovered.
Material/Methods
We performed a comprehensive analysis of the whole-transcriptome resequencing derived from thyroid tissues and paired papillary thyroid cancer (PTC) and showed that lysophosphatidic acid receptor 5 (LPAR5) is strongly overexpressed in thyroid carcinoma. Then, we used TPC-1 and KTC-1 to explore the effect of LPAR5 knockdown on colony formation, migration, proliferation, invasion, and apoptosis of PTC cell line cells. AKT activator was used for the recovery test. Finally, we designed proteomic experiments to explore the role of LPAR5 in the AKT pathway and the EMT process.
Results
Cell function experiments showed that LPAR5 knockdown can significantly induce apoptosis of KTC-1 and TPC-1 cells. Furthermore, LPAR5 can promote PTC metastasis and tumorigenesis by activating the PI3K/AKT pathway and decreasing its cancer-promoting effect when using AKT agonist. We also found that LPAR5 can regulate the expression of EMT-related proteins, which affect invasion and migration.
Conclusions
In summary, downregulation of LPAR5 expression can inhibit the physiological process of PTC, and this phenomenon is related to the PI3K/AKT pathway and EMT.
MeSH Keywords: Oncogene Protein v-akt; Receptors, Lysophosphatidic Acid; Thyroid Neoplasms
Background
The morbidity rate of thyroid cancer has been gradually rising worldwide [1]. Papillary thyroid cancer (PTC) is the most common thyroid cancer and accounts for 80–85% of all thyroid cancers [2]. PTC patients have a 5-year survival rate of up to 90% and most have a good prognosis [3]. Although it has high incidence and low mortality rates, PTC still is an important therapeutic target.
The study of molecular mechanism provides extensive information on PTC. For instance, we previously discovered the major BRAF mutation in thyroid cancer [4]. Because of the substitution of valine 600 by glutamic acid (p.V600E), the major BRAF mutation is a thymine-to-adenine transversion (c.1799T>A). Mutations in BRAF oncogenes generally activate the MAPK pathway and have a 45% prevalence in PTCs [5]. PI3K, TERT, and RAS gene mutations also are involved in PTC progression [6,7].
Despite previous research, many features of PTC are still relatively unknown. In our previous research, we used 19 pairs tissue samples of PTC for bioinformatics analysis and next-generation sequencing to study its mRNA expression [8], revealing that one of the most remarkably overexpressed genes was lysophosphatidic acid receptor 5 (LPAR5).
A member of the rhodopsin class of the G protein-coupled transmembrane receptors is encoded by LPAR5 [9]. This protein mediates various cellular processes through heterotrimeric G protein and transmits extracellular signals of phospholipid acid to cells. Lee et al. [10] revealed that LPAR5 increases cAMP and LPA5. The LPAR5 gene is a recently discovered Gq-coupled lysophosphatidic acid receptor that has been linked to human cancer in many studies.
Dong et al. [11] showed that the invasive activities of human sarcoma cell lines and cell motility were negatively regulated by LPAR5. Yoo et al. revealed that in intestinal epithelial cells, activation of Na(+)/H(+) exchanger 3 is induced by LPAR5 3 via apical epidermal growth factor receptor [12]. However, the role of the LPAR5 gene in PTC has been unclear.
The results of next-generation sequencing and bioinformatics analysis of PTC and paired parathyroid tissues samples showed that LPAR5 may play a significant role in PTC. However, its function has not been fully reported before and the effect of LPAR5 has not been described in PTC. The present study investigated the role of the LPAR5 gene in PTC.
To further define the mechanism underlying PTC occurrence and progression, we conducted qRT-PCR assay to explore LPAR5 expression levels in 44 tissue specimens consisting of primary PTC specimens and paired parathyroid tissue samples. Next, we carried out cytological experiments and Western blotting by inhibiting the LPAR5 expression in PTC cells, used the AKT agonist, and repeated the experiments to verify our experimental design. We designed our study to investigate the effect of LPAR5 on the metastasis and proliferation of PTC. We also explored the relationship between the LPAR5 molecular features and expression of PTC.
Material and Methods
Patients and tissue collection
We collected 44 tissue specimens, including primary PTC specimens and paired parathyroid tissue samples. All samples were acquired via surgical removal of lesions and stored in −80°C liquid nitrogen. All enrolled patients were from the First Affiliated Hospital of Wenzhou Medical University and they underwent surgery at the Oncological Surgery Department between 2014 and 2018. To determine the histologic diagnosis, 2 pathologists histologically examined the tumor tissues, which were retrospectively examined by 2 senior pathologists. The study was approved by the Ethics Committee of the First Affiliated Hospital in Wenzhou Medical University.
TCGA data
The TCGA data portal (https://portal.gdc.cancer.gov/) was used to download the PTC (TCGA queue) mRNA expression data. We selected 502 cases of PTC sequences, which had complete clinical features. We also selected 58 pairs of patients who had thyroid cancer with normal tissue matching.
RNA isolation and qRT-PCR
The tissue specimens and total RNAs of patients were isolated in the PTC cell line with standard TRIzol® reagent (Invitrogen, Thermo Fisher Scientific, Inc.). RNA quality and amount were evaluated by A260/A280 ratio and spectrophotometric value, respectively. Next, cDNA was synthesized using ReverTra Ace qPCR RT Kit at 18°C for 5 min, 40°C for 30 min and 95°C for 5 min according to the manufacturer’s instructions. In addition, qPCR was performed using SYBR Green real-time PCR Master Mix (TOYOBO, qpg-201-201t). The thermocycling factors were 96°C for 2 min and 40 cycles of 96°C for 15 s, 60°C for 60 s, and 72°C for 5 min. The primer sequences of PCR were:
LPAR5, forward 5′-GAGGTCTCTGCTGCTGAT-3′ and
reverse 5′-AGAACTGTTGGTTGAGGAG-3′;
GAPDH, forward 5′-GGTCGGAGTCAACGGATTTG-3′ and
reverse 5′-ATGAGCCCCAGCCTTCTCCAT-3′.
The relative expression of mRNA was calculated using 2−ΔΔCq method [13].
Cell transfection
SiRNA for LPAR5 was purchased from Shanghai Gene Pharma (Shanghai, China). According to the instructions provided by the manufacturer, 5×10⁵ KTC-1 or 1×10⁶ TPC-1 cells were transfected with 4 μl of RNAiMAX (Life Technologies, USA) and 7.5 μl (KTC-1)/10μl (TPC-1) of siRNA (20 μM) in 6-well plates and were harvested after 48 h.
Cell lines and cell culture
We bought KTC-1 and TPC-1 cells from ATCC (American Type Culture Collection). We used RPMI 1640 (Gibco C11875500BT) to culture TPC-1 cells. Then, we added 1×MEM non-essential amino acids (Gibco 11140-050), 1×sodium pyruvate (Gibco 11360-070), and 10% FBS (Gibco 10099141). KTC-1 cultured cells were supplemented with GlutamaxeI™ (Gibco, 35050-061). All of the cells were cultured in 5% CO2/95% 37°C air. We placed 4×10⁵ cells per well into a 6-well plate, followed by incubation in the medium for 24 h.
Western blot analysis
We divided the cells, which were treated by RIPA lysis buffer in Shanghai, China. The same quantity of protein was extracted by gel electrophoresis. Then, the protein was transferred to polyvinylidene fluoride film. Antibody was used to incubate polyvinylidene fluoride film, which had been blocked by defatted milk. Tween 20 and triple-buffered saline were used to rinse cells 4 times, and then we cultured cells for 1.5 h. The secondary antibody also was incubated with cells. We incubated them at room temperature. Image Lab software qualified all the band intensities. The primary antibodies that were used were EZH2 (Abcam, ab203254), β-actin (Sigma), and vimentin (Abcam, ab92547). The secondary antibody we incubated contained goat anti-mouse/rabbit HRP-conjugated IgG (Abcam).
Proliferation assay and colony formation assay
The 96-well plates were used to culture TPC-1 and KTC-1 cells transfected with siRNA. After cell adhesion, the cells we added 10 ml of CCK-8 liquid to each hole and cultured the mixture for 24 h at 37°C. Each cell plate was constantly cultured at 37°C for 5 days. Absorbance of cell proliferation at 450 nm was measured every day.
We seeded the 2 control cell types or transfected KTC-1 and TPC-1 cells in 6-well plates for colony-forming assay. Next, we fixed cells with 4% paraformaldehyde (PFA, Sigma, USA) with 0.01% crystal violet for about 20 min. Then, cells were incubated for 8–14 days.
Cell apoptosis assay
KTC-1 and TPC-1 cells (2×10³) were cultured in 6-well plates when they were in the exponential growth phase for 24 h. We then transfected siRNA into the cells using Lipo iMAX (Invitrogen) after discarding the supernatant. The final siRNA concentrations were 75 nM (KTC-1) and 100 nM (TPC-1) and cells were incubated for another 48 h.
The 2 PTC cell types were divided into groups, and then cells were detached by EDTA-free trypsin (0.25%). Cells were washed 2 times with PBS, then centrifuged for 5 min (1000 rpm, 37°C). Cell proliferation and cytotoxicity assay kits and annexin V/propidium iodide apoptosis detection kits were used to detect apoptosis. We obtained the cells, washed them 2 times, and finally they were resuspended in 1×binding buffer with 1×10⁶ cells/ml. The 100-μl cell suspensions were stained in the dark with PI and annexin V-fluorescein isothiocyanate (5 μl) for 15 min. Next, we performed flow cytometry.
Migration assays and invasion assays
We seeded the 2 groups of transfected or control cells (5×10⁴ cells) into Transwell (Corning Costar Corp, Cambridge, MA, USA) upper chambers full of culture medium to which 10% FBS was added, and 20% FBS was added to the culture medium in the lower chambers. Cells were then incubated in a humidified incubator at 37°C and 5% CO2 for 24 h.
We collected the migrating or invading cells that did not cross the membrane and used 4% PFA to fix cells for 30 min. Then, 0.01% crystal violet was used to stain cells for 30 min. Finally, cells were imaged under a light microscope at 40× magnification.
Statistical analysis
Distribution data were assessed using the t test, and results are expressed as mean ± standard deviation. Data on categorical variables were assessed by use of the chi-square test or Fisher’s exact test and results are expressed as percentages. P values are double-sided and P<0.05 was regarded as indicating a statistically significant difference. SPSS 22.0 (IBM SPSS, USA) was used for statistical analysis and graphs were generated using GraphPad Prism 6.0 (GraphPad Software, USA).
Results
Overexpressed LPAR5 in PTC
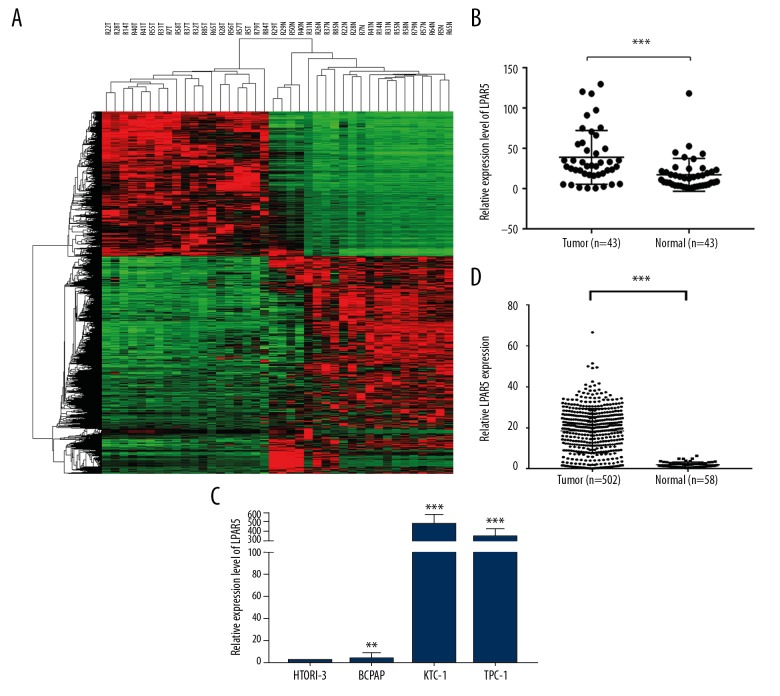
The next-generation sequencing results of 19 pairs of samples, which included normal tissues and tumor tissues, showed that the LPAR5 expression level was significantly increased in PTC compared to adjacent normal tissue (Figure 1A). To verify the data obtained through next-generation sequencing, qRT-PCR was used to assess levels of LPAR5 mRNA in 44 pairs of PTC tumor samples and matched adjacent noncancer tissues (Figure 1B, P<0.001), which confirmed the previous results in the TCGA cohort (Figure 1C, P<0.001). Then, the LPAR5 expression level was tested in PTC cell lines, which revealed it was higher in HTORI3 (normal thyroid cell line) than in KTC-1 and TPC-1 (Figure 1D).
Figure 1.
LPAR5 was overexpressed in PTC. (A) The next-generation sequencing results of 19 pairs of tumor and normal tissue samples. Compared with adjacent normal tissues, the expression level of LPAR5 in PTC was significantly increased. (B) LPAR5 mRNA expression (P<0.001). (C) The expression of LPAR5 in the TCGA cohort was obviously increase (P<0.001). (D) Comparison of LPAR5 expression between thyroid cancer cell lines (compared with GAPDH). ** P<0.01 and *** P<0.001 using the t test in comparison with normal tissue or GAPDH.
Relationship between clinicopathologic features and LPAR5 expression
We analyzed the expression and clinicopathological features of LPAR5 in the TCGA database, comparing the low-expression patient group with the high-expression group, divide by the median value. Table 1 shows the characteristics of the TCGA cohort, in which high LPAR5 level was correlated with histological type (P<0.001) and lymph node metastasis (P<0.003, Table 1). The associations between LPAR5 expression and sex, age, multi-nodularity, tumor size, distant metastasis, and disease stage in both cohorts were insignificant (P>0.05). Therefore, LPAR5 appears to influence lymph node metastasis.
Table 1.
Relationship in TCGA cohort between LPAR5 expression and clinicopathological features.
| Clinicopathologic features | Low expression (N=251) | High expression (N=251) | P value |
|---|---|---|---|
| Sex | 0.841 | ||
| Female | 185 | 182 | |
| Male | 66 | 69 | |
| Age | 0.089 | ||
| Mean±SD | 48.8±16.1 | 45.9±15.5 | |
| ≤45 | 143 | 123 | |
| >45 | 108 | 128 | |
| Histological type | <0.001* | ||
| Classical | 153 | 203 | |
| Other types | 98 | 48 | |
| Multi-nodularity | 0.352 | ||
| Yes | 112 | 124 | |
| No | 139 | 127 | |
| Tumor size (mm) | 0.875 | ||
| ≥20 | 230 | 228 | |
| <20 | 21 | 23 | |
| Lymph node metastasis | 0.003* | ||
| Yes | 120 | 154 | |
| No | 131 | 97 | |
| Distant metastasis | 0.177 | ||
| Yes | 118 | 102 | |
| No | 133 | 149 | |
| Disease stage (AJCC7) | 0.299 | ||
| I+II | 174 | 162 | |
| III+IV | 78 | 89 |
chi-square test;
p value <0.05
High LPAR5 expression was associated with lymph node metastasis in PTC patients
The important variables analyzed by univariate logistic regression for lymph node metastasis included LPAR5 expression (OR: 1.044, 95% CI: 1.026–1.062, P<0.001), tumor size (OR: 0.404, 95% CI: 0.272–0.602, P<0.001), age (OR: 1.557, 95% CI: 1.092–2.219, P=0.014), and histological type (OR: 1.684, 95% CI: 1.142–2.482, P=0.008). Table 2 shows the relationship between LPAR5 and lymph node metastasis. Multivariate logistic analysis showed that LPAR5 expression (OR: 1.037 95% CI: 1.018–1.056, P<0.001), age (OR: 1.151, 95% CI: 1.039–2.195, P=0.0031), and tumor size (OR: 0.413, 95% CI: 0.274–0.624, P<0.001; Table 3) were significantly associated with increased lymph node metastasis. Thus, higher expression of LPAR5 was associated with higher risk of lymph node metastasis in PTC patients.
Table 2.
Risk factor analysis of lymph node metastasis by univariate logistic regression analysis.
| Factor | OR | 95% CI | P value |
|---|---|---|---|
| LPAR5 expression | 1.044 | 1.026–1.062 | <0.001* |
| Histological type | 1.684 | 1.142–2.482 | 0.008* |
| Age, years (≤45 vs. >45) | 1.557 | 1.092–2.219 | 0.014* |
| Sex (Male vs. Female) | 0.701 | 0.469–1.048 | 0.083 |
| Tumor size (mm) | 0.404 | 0.272–0.602 | <0.001* |
| Multi-nodularity | 0.722 | 0.045–11.684 | 0.818 |
p value<0.05.
Table 3.
Risk factor analysis of lymph node metastasis by multivariate logistic regression analysis.
| Factor | OR | 95% CI | P value |
|---|---|---|---|
| LPAR5 expression | 1.037 | 1.018–1.056 | <0.001* |
| Histological type | 1.34 | 0.879–2.043 | 0.174 |
| Age, years (≤45 vs. >45) | 1.51 | 1.039–2.195 | 0.031* |
| Sex (Male vs. Female) | 0.772 | 0.506–1.179 | 0.232 |
| Tumor size (mm) | 0.413 | 0.274–0.624 | <0.001* |
p value<0.05.
Effect of LPAR5 gene knockdown on PTC cell lines
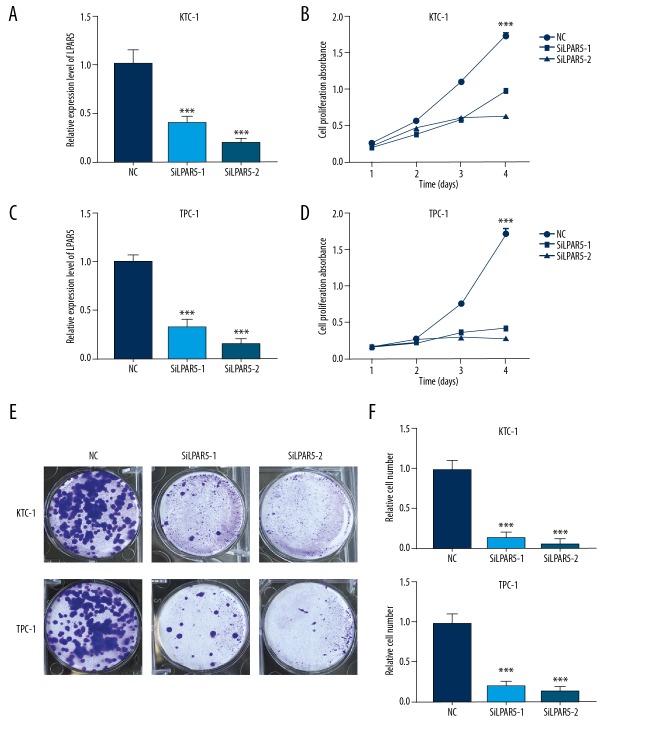
To investigate the effect of LPAR5 to PTC, we downregulated the LPAR5 expression level via siRNA-1 and siRNA-2 transfection. Next, we used qRT-PCR to verify the LPAR5 expression level in the 2 cell lines that were downregulated by siRNA (Figure 2A, 2B). We performed proliferation (Figure 2C, 2D) and colony formation (Figure 2E, 2F) experiments with cell lines with decreased LPAR5 expression level by siRNA, and confirmed that the knockdown of LPAR5 expression can inhibit cell colony formation and cell proliferation.
Figure 2.
Effect of LPAR5 gene knockdown on the thyroid cancer cell lines (A, B) Comparison of LPAR5 expression between TPC-1 and KTC-1 (compared with GAPDH). The expression of LPAR5 in SiLPAR5-1 and SiLPAR5-2 groups was lower than that in the NC group. (C, D) Transfected SiLPAR5 into NC and KTC-1/TPC-1 cell lines, then cells were placed in 96-well plates for 1–4 days. CCK-8 was used to measure cell proliferation. The proliferation of thyroid cells transfected with SiLPAR5-1 and SiLPAR5-2 was significantly inhibited. (E, F) Colony formation assay. The bar chart shows the average number of colonies in at least 4 separate experiments, and the small bars at the top of the columns show SD. *** P<0.001 using the t test in comparison with NC.
Effects of LPAR5 on PTC cell apoptosis
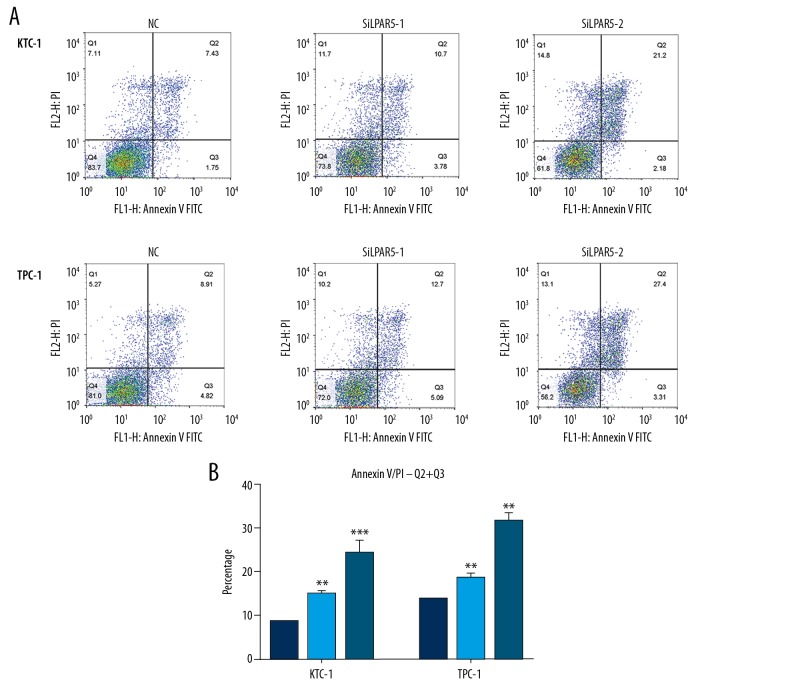
We used flow cytometry to reveal the proportion of apoptotic cells after si-LPAR5 transfection. In contrast to the control cells, LPAR5 knockdown resulted in increased apoptosis of TPC-1 and KTC-1 cells, especially advanced apoptotic cells (Figure 3A, 3B).
Figure 3.
Effects of LPAR5 on PTC cell apoptosis. (A, B) Compared with the control cells, LPAR5 knockdown resulted in increased apoptosis of TPC-1 and KTC-1, especially advanced apoptotic cells. The columns are made by averaging the number of dead cells in at least 3 separate assays ** P<0.01 and *** P<0.001 using the t test in comparison with NC.
LPAR5 downregulation inhibited KTC-1 and TPC-1 migration and invasion
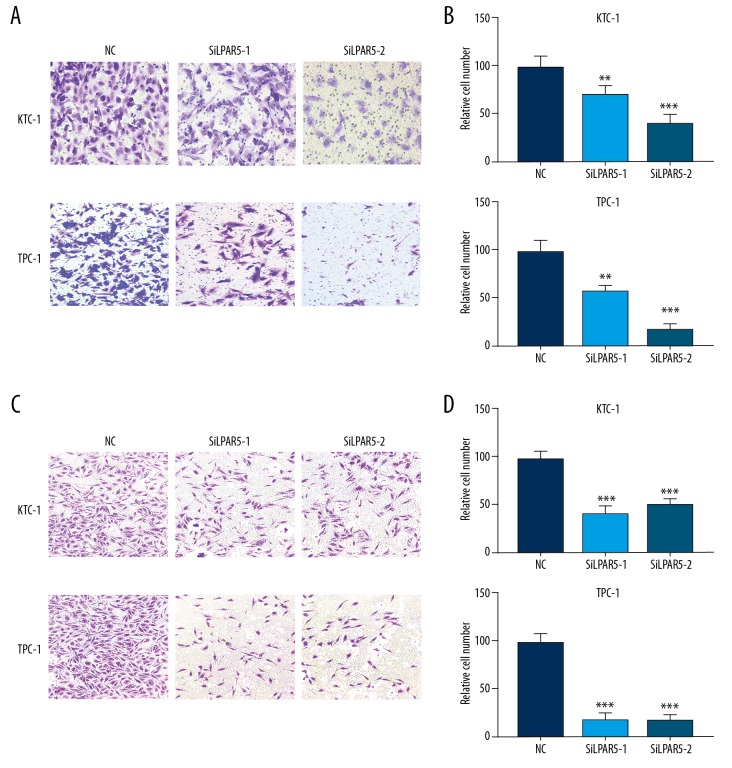
To facilitate in-depth study of the relationship between lymph node metastasis and LPAR5 expression, we conducted migration and invasion experiments on the 2 siRNA-treated cell lines (TPC-1 and KTC-1). The results revealed that the downregulated expression of LPAR5 significantly inhibited migration (Figure 4A, 4B) and invasion (Figure 4C, 4D) of TPC-1 and KTC-1 cells compared with control groups (P<0.001).
Figure 4.
Inhibited KTC-1 and TPC-1 migration and invasion due to LPAR5 downregulation. (A, B) Migration and invasion experiments on siRNA treated KTC-1/TPC-1 and control cells. (C, D) Manually counted from 5 randomly selected areas from the stained cells and statistically analyzed. ** P<0.01; *** P<0.001 using the t test in comparison with NC.
Correlation between LPAR5 and PI3K/AKT pathway
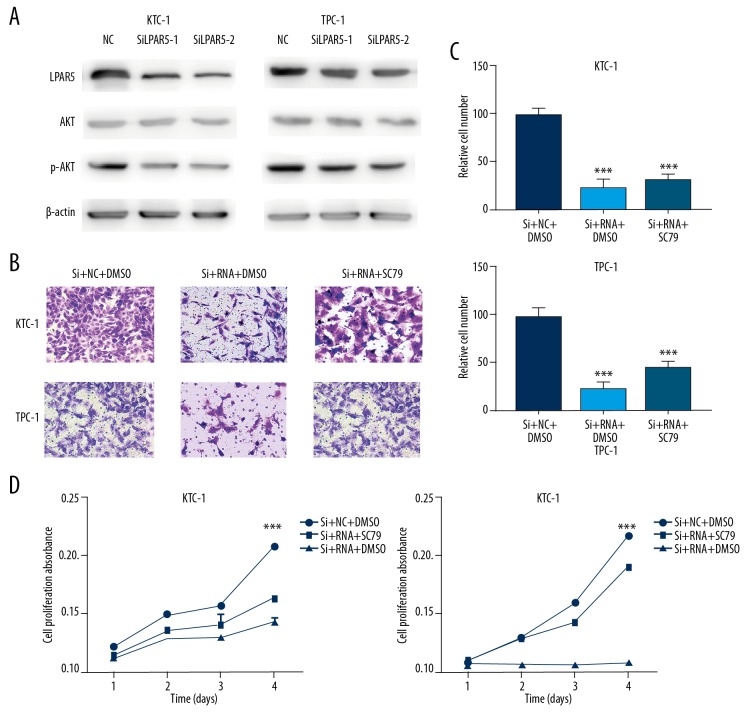
The occurrence and development of thyroid carcinoma appears involve the PI3K/AKT pathway [14–16], which regulates a variety of cell processes, including differentiation, proliferation, and survival. AKT can be directly bound to SC79, which can activate the inactive form of AKT, resulting in AKT hyperactivation [17], and downregulation of LPAR5 expression in TPC-1 and KTC-1 cells can inhibit PI3K/AKT pathway activation (Figure 5A), but the inhibitory effect of LPAR5 on cell migration and proliferation can be reversed by the AKT activator SC79 (Figure 5B–5D).
Figure 5.
Correlation between LPAR5 and PI3K/AKT pathways. (A) Effect of LPAR5 expression on LPAR5, AKT, and p-AKT levels in KTC-1 and TPC-1 (transfected with SiLPAR5-1,2 or NC). (B, C) Migration assay of NC, KTC-1, and TPC-1 cells, which were controlled with siRNA/siRNA+SC79. (D) Cell proliferation assay of NC, KTC-1, and TPC-1 cells, which were controlled with siRNA/siRNA+SC79. CCK-8 was used to measure cell proliferation.
Cancer migration and invasion induced by LPAR5 gene by enhancing the epithelial-mesenchymal transformation (EMT)
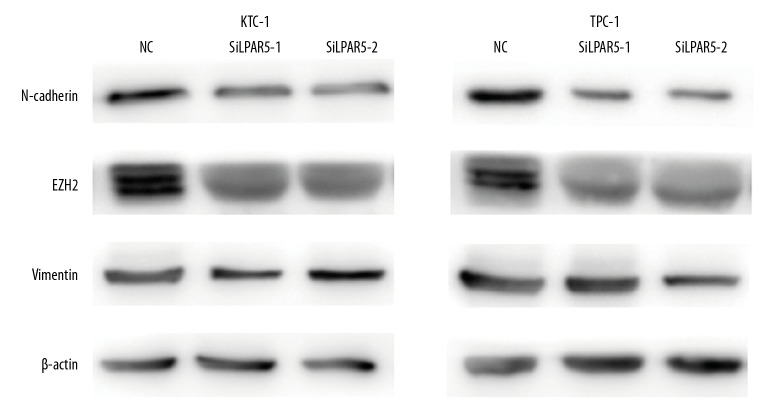
For epithelial neoplasms to acquire mesenchymal cell characteristics during progression and metastasis, EMT is an extremely important process [18]. In cancer cell migration and invasion, EMT can be induced via the AKT/PI3K pathway [19,20]. On the basis of the above results, we speculated that LPAR5 is associated with EMT, not only in PTC cancer promotion, but also in PI3K/AKT. Therefore, Western blot analysis was used to verify that PTC cells (TPC-1 and KTC-1) exhibited higher Vim and lower N-cadherin and EZH2 expression than untransfected cells at the protein level after LPAR5 knockdown (Figure 6).
Figure 6.
Cancer migration and invasion induced by LPAR5 gene by enhancing epithelial-mesenchymal transformation (EMT). Western blot assay for the impact of different LPAR5 levels on the expression of vimentin, EZH2, and N-cadherin in NC, TPC-1, and KTC-1.
Discussion
In the past few decades, the occurrence of thyroid cancer has increased rapidly worldwide, becoming the most frequently diagnosed endocrine cancer [5,21,22]. More than 80% thyroid cancers are caused by the normal histologic type PTC [23]. Previous studies have found that although PTC is a low-mortality, chronic cancer [24,25], it is important to determine its molecular mechanism and to develop targeted therapies
Advances in medical research have led to many new discoveries regarding thyroid cancer, although over 4% of PTC cases exhibit unknown carcinogenic factors, and many epigenetic changes have not been fully studied [26]. Whole-transcriptome resequencing showed that the LPAR5 gene plays a special role in PTC. It was reported that LPAR5 is involved in nasopharyngeal cancer [27] and pancreatic cancer [28]. During tumor progression [29], we assessed the regulated cellular functions in fibrosarcoma HT1080 cells using a previously described method [28]. LPAR5 also participated in anticancer drug treatments in melanoma A375 cells. [30] In human platelet activation, LPAR5 plays a special role by its unique ligand selectivity [31], but few studies have assessed its role in PTC.
In the present study, we explored the role of LPAR5 in thyroid cancer and its potential relationship with clinical features, finding that LPAR5 is associated with lymph node metastasis. Cytological experiments on TPC-1 and KTC-1 cell lines showed that LPAR5 play an important role in a series of cellular functions of tumor cells, including proliferation, colony formation, migration, invasion, and apoptosis. Our Western blot results show that LPAR5 appears to be involved in the PI3K/AKT pathway. We used AKT activator to perform the regression experiment, and experimental results revealed that the significant change in AKT plays a crucial role in the effect of LPAR5 on PTC. We further hypothesized that LPAR5 also affects the EMT process and conducted further experiments.
Some limitations of the present study need to be considered. First, the details of the involvement of LPAR5 in the PI3K/AKT pathway in PTC need further study. Second, experiments in animals are needed. The mechanism of LPAR5 in thyroid tumors still needs to be explored, but LPAR5 clearly plays a significant role in PTC.
Conclusions
In summary, downregulation of PAR5 expression can inhibit the physiological process of PTC, and this phenomenon is related to the PI3K/AKT pathway and EMT. The findings of this study suggest that LPAR5 is a potentially sensitive biomarker of PTC.
Footnotes
Ethics approval and consent to participate
The Ethics Committee of the Affiliated Hospital of Wenzhou Medical University approved this study, and all individual participants provided written informed consent.
Conflict of interest
None.
Source of support: This study was funded by the Natural Science Foundation of Zhejiang Province (grant no. LY18H160053, LY17H160053, and LY18H160053) and the Science and Technology Project of Wenzhou (grant no. Y20170030)
Availability of data and materials
In this article, the datasets of the conclusions are included, these datasets support the conclusions. Additional images that also support this conclusion are also included. Raw data are available on the main electronic data storage system of the First Affiliated Hospital of Wenzhou Medical University and access can be provided upon request to the authors.
References
- 1.Jemal A, Bray F, Center MM, et al. Global cancer statistics. Cancer J Clin. 2011;61(2):69–90. doi: 10.3322/caac.20107. [DOI] [PubMed] [Google Scholar]
- 2.Xing M. Molecular pathogenesis and mechanisms of thyroid cancer. Nat Rev Cancer. 2013;13(3):184–99. doi: 10.1038/nrc3431. [DOI] [PMC free article] [PubMed] [Google Scholar]
- 3.La Vecchia C, Malvezzi M, Bosetti C, et al. Thyroid cancer mortality and incidence: A global overview. Int J Cancer. 2014;136(9):2187–95. doi: 10.1002/ijc.29251. [DOI] [PubMed] [Google Scholar]
- 4.Kimura ET, Nikiforova MN, Zhu Z, et al. High prevalence of BRAF mutations in thyroid cancer: genetic evidence for constitutive activation of the RET/PTC-RAS-BRAF signaling pathway in papillary thyroid carcinoma. Cancer Res. 2003;63(7):1454–57. [PubMed] [Google Scholar]
- 5.Nikiforov YE, Nikiforova MN. Molecular genetics and diagnosis of thyroid cancer. Nat Rev Endocrinol. 2011;7(10):569–80. doi: 10.1038/nrendo.2011.142. [DOI] [PubMed] [Google Scholar]
- 6.Vuong HG, Altibi AM, Duong UN, et al. Role of molecular markers to predict distant metastasis in papillary thyroid carcinoma: Promising value of TERT promoter mutations and insignificant role of BRAF mutations-a meta-analysis. Tumour Biol. 2017;39:1010428317713913. doi: 10.1177/1010428317713913. [DOI] [PubMed] [Google Scholar]
- 7.Decaussin-Petrucci M, Descotes F, Depaepe F, et al. Molecular testing of BRAF, RAS and TERT on thyroid FNAs with indeterminate cytology improves diagnostic accuracy. Cytopathology. 2017;28:482–87. doi: 10.1111/cyt.12493. [DOI] [PubMed] [Google Scholar]
- 8.Wang QX, Chen ED, Cai YF, et al. A panel of four genes accurately differentiates benign from malignant thyroid nodules. J Exp Clin Cancer Res. 2016;35(1):169. doi: 10.1186/s13046-016-0447-3. [DOI] [PMC free article] [PubMed] [Google Scholar]
- 9.Plastira I, Bernhart E, Goeritzer M, et al. Lysophosphatidic acid via LPA-receptor 5/protein kinase D-dependent pathways induces a motile and pro-inflammatory microglial phenotype. J Neuroinflammation. 2017;14(1):253. doi: 10.1186/s12974-017-1024-1. [DOI] [PMC free article] [PubMed] [Google Scholar]
- 10.Lee CW, Rivera R, Gardell S, et al. GPR92 as a new G12/13- and Gq-coupled lysophosphatidic acid receptor that increases cAMP, LPA5. J Biol Chem. 2006;281(33):23589–97. doi: 10.1074/jbc.M603670200. [DOI] [PubMed] [Google Scholar]
- 11.Dong Y, Hirane M, Araki M, et al. Lysophosphatidic acid receptor-5 negatively regulates cell motile and invasive activities of human sarcoma cell lines. Mol Cell Biochem. 2014;393(1–2):17–22. doi: 10.1007/s11010-014-2042-2. [DOI] [PubMed] [Google Scholar]
- 12.Livak KJ, Schmittgen TD. Analysis of relative gene expression data using real-time quantitative PCR and the 2−ΔΔCT method. Methods. 2001;25(4):402–8. doi: 10.1006/meth.2001.1262. [DOI] [PubMed] [Google Scholar]
- 13.Yoo BK, He P, Lee SJ, Yun CC. Lysophosphatidic acid 5 receptor induces activation of Na+/H+ exchanger 3 via apical epidermal growth factor receptor in intestinal epithelial cells. Am J Physiol Cell Physiol. 2011;301(5):C1008–16. doi: 10.1152/ajpcell.00231.2011. [DOI] [PMC free article] [PubMed] [Google Scholar]
- 14.Campos M, Kool MM, Daminet S, et al. Upregulation of the PI3K/Akt pathway in the tumorigenesis of canine thyroid carcinoma. J Vet Intern Med. 2014;28(6):1814–23. doi: 10.1111/jvim.12435. [DOI] [PMC free article] [PubMed] [Google Scholar]
- 15.Hou P, Liu D, Shan Y, et al. Genetic alterations and their relationship in the phosphatidylinositol 3-kinase/Akt pathway in thyroid cancer. Clin Cancer Res. 2007;13(4):1161–70. doi: 10.1158/1078-0432.CCR-06-1125. [DOI] [PubMed] [Google Scholar]
- 16.Santarpia L, El-Naggar AK, Cote GJ, et al. Phosphatidylinositol 3-kinase/Akt and ras/raf-mitogen-activated protein kinase pathway mutations in anaplastic thyroid cancer. J Clin Endocrinol Metab. 2008;93(1):278–84. doi: 10.1210/jc.2007-1076. [DOI] [PubMed] [Google Scholar]
- 17.Thiery JP, Sleeman JP. Complex networks orchestrate epithelial-mesenchymal transitions. Nat Rev Mol Cell Biol. 2006;7(2):131–42. doi: 10.1038/nrm1835. [DOI] [PubMed] [Google Scholar]
- 18.Jo H, Mondal S, Tan D, et al. Small molecule-induced cytosolic activation of protein kinase Akt rescues ischemia-elicited neuronal death. Proc Natl Acad Sci USA. 2012;109(26):10581–86. doi: 10.1073/pnas.1202810109. [DOI] [PMC free article] [PubMed] [Google Scholar]
- 19.Larue L, Bellacosa A. Epithelial-mesenchymal transition in development and cancer: Role of phosphatidylinositol 3′ kinase/AKT pathways. Oncogene. 2005;24(50):7443–54. doi: 10.1038/sj.onc.1209091. [DOI] [PubMed] [Google Scholar]
- 20.Yan W, Fu Y, Tian D, et al. PI3 kinase/Akt signaling mediates epithelial-mesenchymal transition in hypoxic hepatocellular carcinoma cells. Biochem Biophys Res Commun. 2009;382(3):631–36. doi: 10.1016/j.bbrc.2009.03.088. [DOI] [PubMed] [Google Scholar]
- 21.Siegel RL, Miller KD, Jemal A. Cancer statistics, 2017. Cancer J Clin. 2017;67(1):7–30. doi: 10.3322/caac.21387. [DOI] [PubMed] [Google Scholar]
- 22.Ferlay J, Shin HR, Bray F, et al. Estimates of worldwide burden of cancer in 2008: GLOBOCAN 2008. Int J Cancer. 2010;127(12):2893–917. doi: 10.1002/ijc.25516. [DOI] [PubMed] [Google Scholar]
- 23.Burns WR, Zeiger MA. Differentiated thyroid cancer. Semin Oncol. 2010;37(6):557–66. doi: 10.1053/j.seminoncol.2010.10.008. [DOI] [PubMed] [Google Scholar]
- 24.Lundgren CI, Hall P, Dickman PW, et al. Clinically significant prognostic factors for differentiated thyroid carcinoma: A population-based, nested case-control study. Cancer. 2006;106(3):524–31. doi: 10.1002/cncr.21653. [DOI] [PubMed] [Google Scholar]
- 25.Ansari M, Babaei AA, Shafiei B, et al. Pathological evaluation of differentiated thyroid cancer in patients with positive serum thyroglobulin and negative iodine scan. Eur Rev Med Pharmacol Sci. 2014;18(13):1925–29. [PubMed] [Google Scholar]
- 26.Agarwal N, Akbani R, Aksoy BA, et al. Integrated genomic characterization of papillary thyroid carcinoma. Cancer Genome Atlas Research Network. Cell. 2014;159:676–90. doi: 10.1016/j.cell.2014.09.050. [DOI] [PMC free article] [PubMed] [Google Scholar]
- 27.Yap LF, Velapasamy S, Lee HM, et al. Down-regulation of LPA receptor 5 contributes to aberrant LPA signalling in EBV-associated nasopharyngeal carcinoma. J Pathol. 2014;235(3):456–65. doi: 10.1002/path.4460. [DOI] [PubMed] [Google Scholar]
- 28.Ishii S, Hirane M, Fukushima K, et al. Diverse effects of LPA4, LPA5 and LPA6 on the activation of tumor progression in pancreatic cancer cells. Biochem Biophys Res Commun. 2015;461(1):59–64. doi: 10.1016/j.bbrc.2015.03.169. [DOI] [PubMed] [Google Scholar]
- 29.Takahashi K, Minami K, Otagaki S, et al. Lysophosphatidic acid receptor-2 (LPA 2) and LPA 5 regulate cellular functions during tumor progression in fibrosarcoma HT1080 cells. Biochem Biophys Res Commun. 2018;503(4):2698–703. doi: 10.1016/j.bbrc.2018.08.026. [DOI] [PubMed] [Google Scholar]
- 30.Fukushima K, Takahashi K, Kurokawa A, et al. Involvement of LPA receptor-5 in the enhancement of cell motile activity by phorbol ester and anticancer drug treatments in melanoma A375 cells. Biochem Biophys Res Commun. 2018;496(1):225–30. doi: 10.1016/j.bbrc.2018.01.030. [DOI] [PubMed] [Google Scholar]
- 31.Williams JR, Khandoga AL, Goyal P, et al. Unique ligand selectivity of the GPR92/LPA5 lysophosphatidate receptor indicates role in human platelet activation. J Biol Chem. 2009;284(25):17304–19. doi: 10.1074/jbc.M109.003194. [DOI] [PMC free article] [PubMed] [Google Scholar]


