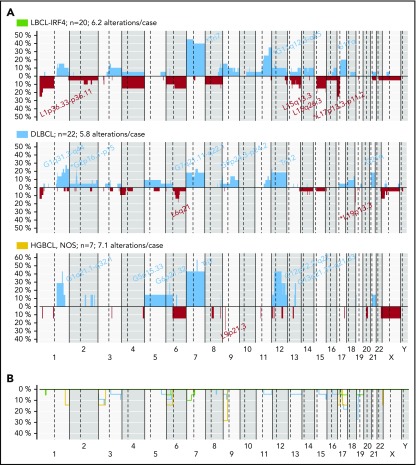
Figure 5.
CN profile of pediatric and young adult LBCL cases. (A) Global CN profiles of 20 LBCL-IRF4 cases; 22 DLBCL, NOS cases; and 7 HGBCL, NOS cases. x-axis indicates chromosomes from 1 to Y and p to q. The vertical axis indicates frequency of each genomic aberration among the analyzed cases. Gains are depicted in blue and losses in red. Most frequently recurrent regions are indicated for LBCL-IRF4; DLBCL, NOS (>20%); and HGBCL, NOS (≥2 cases). Asterisks indicate significant differences between LBCL-IRF4 and DLBCL (Fisher’s test, P < .05). (B) Comparative plot of CNN-LOH among the 3 morphological groups described above. Green identifies LBCL-IRF4; blue DLBCL, NOS; and yellow HGBCL, NOS.

