

Abstract
Background
Chromosomal microarray analysis (CMA) is nowadays widely used in the diagnostic path of patients with clinical phenotypes. However, there is no ascertained evidence to date on how to assemble single/combined clinical categories of developmental phenotypic findings to improve the array‐based detection rate.
Methods
The Italian Society of Human Genetics coordinated a retrospective study which included CMA results of 5,110 Italian patients referred to 17 genetics laboratories for variable combined clinical phenotypes.
Results
Non‐polymorphic copy number variants (CNVs) were identified in 1512 patients (30%) and 615 (32%) present in 552 patients (11%) were classified as pathogenic. CNVs were analysed according to type, size, inheritance pattern, distribution among chromosomes, and association to known syndromes. In addition, the evaluation of the detection rate of clinical subgroups of patients allowed to associate dysmorphisms and/or congenital malformations combined with any other single clinical sign to an increased detection rate, whereas non‐syndromic neurodevelopmental signs and non‐syndromic congenital malformations to a decreased detection rate.
Conclusions
Our retrospective study resulted in confirming the high detection rate of CMA and indicated new clinical markers useful to optimize their inclusion in the diagnostic and rehabilitative path of patients with developmental phenotypes.
Keywords: Chromosomal microarray analysis (CMA), clinical marker identification, detection rate, pathogenic CNV
This study provides a retrospective study coordinated by the Italian Society of Human Genetics (SIGU) of 5,110 patients referred to CMA for variable combined clinical phenotypes, collected by 17 Italian laboratories. The data extrapolated by the present cohort are compared to those of previously reported studies. In addition, the detection rate of single/combined clinical categories of patients sorted out from the overall cohort is evaluated to correctly assess the inclusion of the CMA in the diagnostic path of patients with the developmental clinical phenotypes.
1. INTRODUCTION
Over the last decade, chromosomal microarray analysis (CMA) has been adopted as a first‐tier test for the evaluation of patients referred for intellectual disability/developmental delay (ID/DD) and/or autism spectrum disorder(s) (ASDs) and/or multiple congenital anomalies (Miller et al., 2010). CMA encompasses different types of array‐based genomic analyses, including the comparative genomic hybridization array (CGH‐array) and the single‐nucleotide polymorphism hybridization array (SNP‐array).
These techniques allow to identify genomic copy number variant(s) (CNVs) that are defined as the gain or loss of genomic material larger than 1 kb in size and include, by population criteria, common, and rare CNVs: the latter being identified as one of the most prominent causes of disease.
The employment of CMA in the diagnostics pathway of patients with ID/DD and multiple congenital anomalies increases the Detection Rate (DR) of 15%–20% compared to the standard karyotype (3%–5%) (Miller et al., 2010).
Published studies on several cohorts of patients referred to CMA have unanimously confirmed that CMA remarkably enhances the identification of causative CNVs in an affected population (Ahn et al., 2013; Bartnik et al., 2014, 2012; Battaglia et al., 2013; Cappuccio et al., 2016; Carreira et al., 2015; Coppola et al., 2019; D'Arrigo et al., 2016; Di Gregorio et al., 2017; Fry et al., 2016; Kaminsky et al., 2011; Lintas et al., 2017; Maini et al., 2018; Mc Cormack et al., 2016; Napoli et al., 2018; Quintela et al., 2017; Vianna, Medeiros, Alves, Silva, & Jehee, 2016; Wincent et al., 2015).
The high number of patients referred to this analysis and the conspicuous demand of resources needed to perform the test, require a further definition of which clinical phenotypes are associated to an increased/decreased detection rate of the CMA and could be considered positive/negative clinical markers. In accordance to this demand, several laboratories have recently focused their attention on the analysis of clinically selected subgroups of patients referred for ID/DD, ID/DD, and congenital malformation(s) (CMs) and/or dysmorphisms (D), ASDs and epilepsy (E) (Bartnik et al., 2014, 2012; Battaglia et al., 2013; Cappuccio et al., 2016; Coppola et al., 2019; D'Arrigo et al., 2016; Di Gregorio et al., 2017; Fry et al., 2016; Lintas et al., 2017; Maini et al., 2018; Napoli et al., 2018; Quintela et al., 2017; Vianna et al., 2016; Wincent et al., 2015). However, most of the above‐mentioned cohorts include both non‐syndromic and syndromic patients and no study had compared the DR of each subset with that of the unselected cohorts. Consequently to date, there are no ascertained evidences on new clinical markers for CMA. This lack underlines the requirement of additional studies.
Here, we present a retrospective study on CMA results of an unselected cohort of 5,110 Italian patients with variably combined clinical phenotypes, to date, the largest Italian study of its kind. The data extrapolated by the present cohort and the review of those previously reported merge in highlighting the high DR and pCNV DR of CMA. In addition, the analysis of single/combined clinical categories of patients sorted out from the overall cohort suggests considering new clinical markers that could be useful for clinicians to more correctly include CMA in the diagnostic routine.
2. SUBJECTS AND METHODS
The Cytogenetics/genomics working group of the Italian Society of Human Genetics (SIGU) coordinated a retrospective study on 5,110 patients referred to CMA in 17 Genetics Laboratories in Italy.
The analyses were performed by each laboratory over a variable time period (from 6 to 54 months) using different array platforms and resolutions (Agilent Technology Inc., Santa Clara CA USA; Illumina Inc., San Diego CA USA; Perkin Elmer Inc., Spokane WA USA; Techno Genetics srl, Italy; Bluegnome Ltd., Cambridge UK). Patients were selected from a heterogeneous population and ranged from childhood to adulthood. The collection has been performed regardless of specific preselections. Clinical data from the referring laboratories were obtained through the completion of questionnaires by all enrolled participant laboratories. Questionnaires included items regarding technical information and clinical descriptions. An item regarding the list of CNVs identified for each patient was also added to the questionnaire. Most of the analyses have been performed after conventional cytogenetics analysis. Standard karyotype results were not available since the multicentric and retrospective features of this data collection made it difficult to retrieve this information for all the patients for which the analysis was performed. However, all these patients were referred to CMA after a Clinician's counselling since a diagnosis was not achieved, or definitely achieved, through conventional karyotyping. All the experiments employed peripheral blood samples and the practical procedures were carried out based on manufacturer's instructions.
The significance of each CNV has been evaluated considering: type (deletion or duplication/amplification), size, location, gene content, inheritance pattern, and patient's clinical phenotype, and by performing an accurate review of both the literature and CNV databases for healthy or affected populations: PubMed (https://www.ncbi.nlm.nih.gov/pubmed/), Database of Genomic Variants (DGV) (http://dgv.tcag.ca/dgv/app/home), UCSC Genome Browser (https://genome.ucsc.edu), Decipher v9.28 (https://decipher.sanger.ac.uk/), and OMIM (https://www.omim.org/).
For CNV classification, we followed the ACMG (American College of Medical Genetics) and European guidelines (Richards et al., 2015; Silva et al., 2019), taking in account a five‐tier terminology system that comprises all CNV types: pathogenic (pCNV), likely pathogenic (LP), of uncertain significance (US), likely benign (LB), and benign CNVs. Each CNV was classified in accordance to the criteria described in 2011 by the ACMG (Kearney et al., 2011). For CNV analysis, pCNVs, LP, US, and LB CNVs were all considered non‐benign CNVs, whereas LP, US, and LB CNVs were generally considered as variants of uncertain significance (VOUS).
In order to correctly evaluate CNV distribution, the number of CNVs for each chromosome has been normalized to chromosome size (number of CNVs per megabase). The size of each chromosome was extrapolated from the UCSC Genome Browser (https://genome.ucsc.edu).
Results of CMA have been considered as dichotomous variables (positive or negative). A positive result for DR calculation was the presence of an abnormal molecular karyotype, while for pCNV DR calculation was the finding of an abnormal molecular karyotype characterized by at least one pCNV. For each single/combined clinical category, both the DR and the pCNV DR have been calculated considering the ratio between the number of patients with a positive result and the total number of patients of the cohort/clinical category.
To identify clinical markers, each single/combined clinical category has been statistically compared to the remaining part of the cohort. The group of patients with ≤2 clinical signs has been compared to that of patients with ≥3 clinical signs. A 2x2 contingency table has been used, considering for each of the two compared subgroups the number of patients with a positive/negative CMA result. Statistical analysis has been performed by Pearson's chi‐squared (χ2) test using the R.3.1.0 software. A value of p <.05 assigned a statistically significant test. Data used for statistical analyses are reported in Table 4.
Table 4.
Results of the statistical analysis performed on single/combined clinical categories extrapolated from the cohort. Clinical categories with a significantly different DR/pCNV DR are shown
| Single/combined clinical category | Number of patients | Number of patients with an abnormal molecular karyotype | DR of the clinical category | DR of the remaining cohort | p‐value | Significance level | Number of patients with at least a pCNV | pCNV DR of the clinical category | pCNV DR of the remaining cohort | p‐value | Significance level |
|---|---|---|---|---|---|---|---|---|---|---|---|
| ID/DD | 1,510 | 411 | 27,2 | 30,6 | 1,78E−02 | a | 128 | 8,5 | 11,8 | 6,28E−04 | c |
| ASD | 608 | 131 | 21,5 | 30,7 | 4,61E−06 | c | 11 | 1,8 | 12 | 4,65E−14 | c |
| ID/DD + D | 443 | 153 | 34,5 | 29,1 | 1,96E−02 | a | 72 | 16,3 | 10,3 | 1,52E−04 | c |
| CM | 396 | 96 | 24,2 | 30 | 1,78E−02 | a | 28 | 7,1 | 11,1 | 1,61E−02 | a |
| MD | 346 | 124 | 35,8 | 29,1 | 9,98E−03 | b | 75 | 21,7 | 10 | 2,76E−11 | c |
| ID/DD + E | 281 | 78 | 27,8 | 29,7 | 5,32E−01 | 23 | 8,2 | 11 | 1,75E−01 | ||
| ID/DD + ASD | 267 | 47 | 17,6 | 30,2 | 1,43E−05 | c | 23 | 8,6 | 10,9 | 2,79E−01 | |
| ID/DD + CM | 172 | 67 | 39 | 29,3 | 8,00E−03 | b | 35 | 20,3 | 10,5 | 6,95E−05 | c |
| D | 165 | 56 | 33,9 | 29,4 | 2,47E−01 | 22 | 13,3 | 10,7 | 3,49E−01 | ||
| E | 125 | 34 | 27,2 | 29,6 | 6,22E−01 | 7 | 5,6 | 10,9 | 7,99E−02 | ||
| LD | 97 | 26 | 26,8 | 29,6 | 6,21E−01 | 4 | 4,1 | 10,9 | 4,83E−02 | a | |
| ID/DD + D+E | 87 | 39 | 44,8 | 29,3 | 2,51E−03 | b | 16 | 18,4 | 10,7 | 3,35E−02 | a |
| D + CM | 79 | 22 | 27,8 | 29,6 | 8,28E−01 | 10 | 12,7 | 10,8 | 7,24E−01 | ||
| SKR | 74 | 58 | 78,4 | 28,9 | 6,59E−20 | c | 51 | 68,9 | 9,9 | 7,28E−58 | c |
| ID/DD + D + E + CM | 67 | 14 | 20,9 | 29,7 | 1,51E−01 | 7 | 10,4 | 10,8 | 1,00E + 00 | ||
| GD | 67 | 16 | 23,9 | 29,7 | 3,70E−01 | 6 | 9 | 10,8 | 7,70E−01 | ||
| ID/DD + D + CM | 54 | 36 | 66,7 | 29,2 | 4,88E−09 | c | 21 | 38,9 | 10,5 | 1,02E−10 | c |
| ASD + D | 45 | 21 | 46,7 | 29,4 | 1,84E−02 | a | 1 | 2,2 | 10,9 | 1,05E−01 | |
| ID/DD + GD | 36 | 14 | 38,9 | 29,5 | 2,97E−01 | 7 | 19,4 | 10,7 | 1,59E−01 | ||
| ASD + E | 29 | 5 | 17,2 | 29,7 | 2,09E−01 | 3 | 10,3 | 10,8 | 1,00E + 00 | ||
| D + E | 27 | 7 | 25,9 | 29,6 | 8,36E−01 | 1 | 3,7 | 10,8 | 3,79E−01 | ||
| ID/DD + ASD + D | 28 | 25 | 89,3 | 29,3 | 5,18E−02 | c | 7 | 25 | 10,7 | 3,39E−02 | a |
| E + CM | 23 | 8 | 34,8 | 29,6 | 7,50E−01 | 4 | 17,4 | 10,8 | 4,94E−01 | ||
| ID/DD + D + GD | 21 | 6 | 28,6 | 29,6 | 1,00E + 00 | 1 | 4,8 | 10,8 | 5,88E−01 | ||
| GD + D | 21 | 7 | 33,3 | 29,6 | 8,91E−01 | 4 | 19 | 10,8 | 3,86E−01 | ||
| GD + CM | 18 | 3 | 16,7 | 29,6 | 3,45E−01 | 1 | 5,6 | 10,8 | 7,35E−01 | ||
| ASD + CM | 12 | 3 | 25 | 29,6 | 9,74E−01 | 1 | 8,3 | 10,8 | 1,00E + 00 | ||
| ID/DD + E + CM | 12 | 5 | 41,7 | 29,6 | 5,48E−01 | 0 | 0 | 10,8 | 4,58E−01 | ||
| ID/DD+ | 1,199 | — | — | — | — | 143 | 11,9 | 10,5 | 1,67E−01 | ||
| ASD+ | 353 | — | — | — | — | 11 | 3,1 | 11,4 | 2,21E−06 | c | |
| CM+ | 304 | — | — | — | — | 51 | 16,8 | 10,4 | 7,66E−04 | c | |
| D+ | 615 | — | — | — | — | 88 | 14,3 | 10,3 | 3,53E−03 | b | |
| E+ | 360 | — | — | — | — | 31 | 8,6 | 11 | 1,93E−01 | ||
| ≤2 versus ≥3 clinical signs (!) | 4,421 (≤2)/ 615 (≥3) | — | — | — | — | 128 (≤2)/ 374 (≥3) | 8,4 (≤2) | 20,8 (≥3) | 1,91E−21 | c |
ASD, autism spectrum disorder; CM, congenital malformations; D, dysmorphisms; E, epilepsy; GD, growth delay; ID/DD, intellectual disability/developmental delay; LD, learning disabilities; MD, complex clinical phenotypes suggestive of a microdeletion/duplication syndrome; SKR, standard karyotype rearrangement.
(+) plus another single clinical sign
(!) the pCNV DR of the clinical category represents the group with ≤2 clinical signs, while the pCNV DR of the remaining cohort represents the group with ≥3 clinical signs
.01 < p <.05
.001 < p <.01
p < 0.001
This work was approved by the Ethical Committee of the Istituto Auxologico Italiano on March 25, 2017 (RC‐08C723).
3. RESULTS
We report the results of CMAs on a cohort of 5,110 patients collected by 17 Genetics Laboratories in Italy. Fourteen laboratories carried out the analyses using a CGH‐array platform, two by using the CGH + SNP‐array and one by employing the SNP‐array; in addition, 10 laboratories performed the analyses at a resolution of < 50 kb (high resolution), 5 in the 50–200 kb interval (medium resolution), and 2 at > 200 kb resolution (low resolution).
The clinical data included 28 different clinical categories (Table 1).
Table 1.
List of the 28 single/combined clinical categories identified in the present cohort
| Clinical Category | Number of patients (%) |
|---|---|
| ID/DD | 1,510 (29,5) |
| ASD | 608 (11,5) |
| ID/DD + D | 443 (8,7) |
| CM | 396 (7,7) |
| MD | 346 (6,8) |
| ID/DD + E | 281 (5,5) |
| ID/DD + ASD | 267 (5,2) |
| ID/DD + CM | 172 (3,4) |
| D | 165 (3,2) |
| E | 125 (2,4) |
| LD | 97 (1,9) |
| ID/DD + D + E | 87 (1,7) |
| D + CM | 79 (1,5) |
| SKR | 74 (1,4) |
| ID/DD + D + E + CM | 67 (1,3) |
| GD | 67 (1,3) |
| ID/DD + D + CM | 54 (1,1) |
| ASD + D | 45 (0,9) |
| ID/DD + GD | 36 (0,7) |
| ASD + E | 29 (0,6) |
| ID/DD + ASD + D | 28 (0,5) |
| D + E | 27 (0,5) |
| E + CM | 23 (0,5) |
| ID/DD + D + GD | 21 (0,4) |
| GD + D | 21 (0,4) |
| GD + CM | 18 (0,4) |
| ASD + CM | 12 (0,2) |
| ID/DD + E + CM | 12 (0,2) |
ASD, autism spectrum disorder; CM, congenital malformations; D, dysmorphisms; E, epilepsy/seizure; GD, growth delay; ID/DD, intellectual disability/developmental delay; LD, learning disabilities; MD, complex clinical phenotypes suggestive of a microdeletion/duplication syndrome; SKR, standard karyotype rearrangement.
3.1. CNV results
Out of the 5,110 patients, 1512 showed an abnormal molecular karyotype, defining a DR of 30%.
A total of 1,890 CNVs have been identified (list available at request) with an average number of 1,3 non‐benign CNVs per patient. In particular, 1 CNV has been detected in 1,192 patients (79%), while 2 or more CNVs were observed in the remaining 21%.
Eighteen CNVs (~ 1%), corresponding to 18 patients, correlated to aneuploidy of a whole chromosome. For six of these patients, the chromosomal aneuploidy had already been detected by conventional cytogenetic analysis and CMA was requested because the aneuploidy was not fully consistent with the clinical phenotype; for seven patients, the chromosomal aneuploidy emerged as a new result. For the remaining five patients, the previous information was not available. Twenty CNVs (~ 1%) identified in 20 different patients showed an atypical profile, suggesting a mosaic condition. For 2 out of these 20 CNVs, the analysis confirmed mosaic aneuploidy.
In total, we identified 895 (47%) deletions and 995 (53%) duplications (Table 2).
Table 2.
Total number of all CNVs, pCNVs, and VOUS (LP + US + LB CNVs) and their distribution, according to type (deletions and duplications/amplifications), inheritance, and average size. The same data are also shown separately for LP, US, and LB CNVs
| All CNVs (%) | pCNVs (%) | VOUS (%) | LP CNVs (%) | US CNVs (%) | LB CNVs (%) | |
|---|---|---|---|---|---|---|
| Number of CNVs | 1,890 (100%) | 614 (32%) | 1,276 (68%) | 150 (8%) | 894 (47%) | 232 (12%) |
| Deletions | 895 (47%) | 387 (63%) | 508 (40%) | 83 (55%) | 328 (37%) | 98 (42%) |
| Duplications/amplifications | 995 (53%) | 227 (37%) | 768 (60%) | 67 (45%) | 566 (63%) | 134 (58%) |
| Number of CNVs with established inheritance pattern | 1,041 (55%) | 242 (39%) | 799 (63%) | 68 (45%) | 573 (64%) | 158 (68%) |
| Inherited | 773 (74%) | 67 (28%) | 706 (88%) | 48 (71%) | 509 (89%) | 149 (94%) |
| de novo | 268 (26%) | 175 (72%) | 93 (12%) | 20 (13%) | 64 (11%) | 9 (6%) |
| Average size | 2,49 Mb | 6,48 Mb | 626 kb | 1,48 Mb | 552 kb | 358 kb |
| Deletions average size | 2,57 Mb | 5,13 Mb | 631 kb | 1,59 Mb | 477 kb | 332 kb |
| Duplications average size | 2,42 Mb | 8,93 Mb | 623 kb | 1,35 Mb | 594 kb | 377 kb |
Out of the 1,041 CNVs (55%), whose inheritance pattern could be tested, 773 (74%) were inherited (419 maternally and 354 paternally), and 268 (26%) were de novo (Table 2). In total, 614 (32%) CNVs were classified as pathogenic in 552 patients, and accounted for an overall pCNV DR of 11%.
Among all 614 pCNVs, 387 (63%) were deletions and 227 (37%) duplications (Table 2). The inheritance has been tracked for 242 CNVs (39%) of which, 175 (72%) were de novo, while 67 (28%) were inherited (Table 2) with maternal inheritance being as common as paternal inheritance.
As to the remaining 1,276 nonpathogenic CNVs (68%), 150 were classified as LP (8%), 894 as US (47%), and 232 as LB (12%); in addition, out of all these 1,276 VOUS, 508 (40%) were deletions and 768 (60%) duplications (Table 2). Out of the 799 VOUS whose inheritance pattern could be tested (63%), 385 (48%) were maternally inherited, 321 (40%) paternally inherited and 93 (12%) were de novo (Table 2).
The average size and the distribution across different size categories of all CNVs, including pCNVs and VOUS are reported in Table 2 and Figure 1, respectively. Overall 7% of all CNVs were > 10 Mb in size, whereas 65% were < 1Mb.
Figure 1.
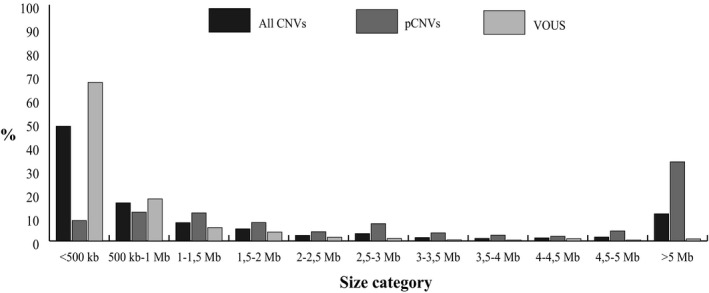
Distribution (percentage) of all identified CNVs, pCNVs, and VOUS across different size categories. The VOUS group includes LP, US, and LB CNVs
All data concerning LP, US, and LB CNVs are reported separately in Table 2.
The total number of CNVs and the number of pCNVs and VOUS per chromosome is depicted in Figure 2. Chromosomes carrying pCNVs were, in decreasing order: chromosomes 22, 16, 17, and 15. Of note is the major involvement of chromosome X in VOUS.
Figure 2.
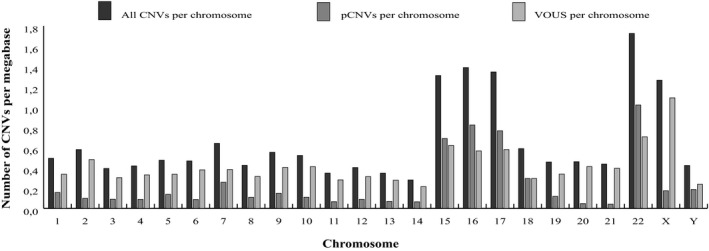
Number of all CNVs, pCNVs, and VOUS per megabase length of each chromosome. The VOUS group includes LP, US, and LB CNVs
Out of all the 1,890 CNVs, 20% (387/1890 CNVs) were associated to known genomic disorders reported in OMIM and/or in the “CNV syndromes” section of Decipher v9.28. Table 3 reports the list of the recurrent deletions and duplications identified in our cohort. The most common microdeletion syndromes were the 22q11.2 deletion and the 16p11.2 deletion syndrome, while the most common microduplication syndromes were those involving 15q11.2, 16p13.11, and 16p11.2.
Table 3.
List of the main regions associated to known OMIM and/or Decipher syndrome caused CNVs. The most represented regions are bolded
| Region/Syndrome | #OMIM | Number of deletions | Number of duplications/ amplifications | Total number of CNVs |
|---|---|---|---|---|
| 1p35 deletion | #617930 | 1 | 1 | |
| 1p36 deletion | #607872 | 9 | 9 | |
| Proximal 1q21.1 (TAR) | #274000 | 5 | 5 | |
| 1q21.1 deletion/duplication | #612474/#612475 | 6 | 9 | 15 |
| 2p25.3 deletion/duplication | #612521 | 2 | 2 | |
| 2p16.3 deletion | #614332 | 5 | 5 | |
| 2p12‐p11.2 deletion | #613564 | 1 | 1 | |
| 2q23.1 deletion | #156200 | 4 | 4 | |
| 2q31.1 deletion/duplication | #612345/#613681 | 1 | 1 | |
| 2q37 deletion | #600430 | 5 | 5 | |
| 3pter‐p25 deletion | #613792 | 1 | 1 | |
| 3q29 deletion/duplication | #609425/#611936 | 5 | 3 | 8 |
| 4p deletion (Wolf–Hirschhorn syndrome) | #194190 | 4 | 4 | |
| 4q21 deletion | #613509 | 1 | 1 | |
| 5p deletion (Cri‐du‐chat syndrome) | #123450 | 11 | 11 | |
| 5q35 deletion (Sotos syndrome) | #117550 | 1 | 1 | |
| 6pter‐p24deletion | #612582 | 3 | 3 | |
| 6q11‐q14 deletion | #613544 | 2 | 2 | |
| 6q24‐q25 deletion | #612863 | 1 | 1 | |
| 7q11.23 deletion (William–Beuren syndrome)/duplication | #194050/#609757 | 16 | 8 | 24 |
| Recombinant 8p23 | #179613 | 3 | 4 | 7 |
| 9p deletion | #158170 | 8 | 8 | |
| 9q34 deletion (Kleefstra syndrome) | #610253 | 3 | 3 | |
| 10q26 deletion | #609625 | 5 | 5 | |
| 11p15.5 deletion/duplication (Silver–Russel/Becwith–Wiedeman syndromes) | #130650/#180860 | 1 | 1 | 2 |
| 11p13 deletion | #616902 | 1 | 1 | |
| 13q14 deletion | #613884 | 3 | 3 | |
| 14q22 deletion (Frias syndrome) | #609640 | 1 | 1 | |
| 15q11.2 deletion/duplication (BP1‐BP2) | #615656/#608636 | 15 | 5 | 20 |
| 15q11.2 (BP1/2‐BP3) | #176270/#105830 | 18 | 15 | 33 |
| 15q13.3 deletion | #612001 | 11 | 11 | |
| 15q26‐qter deletion | #612626 | 3 | 3 | |
| 16p13.11 | — | 9 | 14 | 23 |
| 16p11.2 | #611913/#614671 | 24 | 12 | 36 |
| 17p13.3 deletion (Miller–Dieker lissencephaly syndrome)/duplication | #247200/#612576 | 4 | 7 | 11 |
| 17p12 deletion (HNPP)/ duplication (CMT1) | #118220/ #162500 | 5 | 4 | 9 |
| 17p11.2 deletion (Smith–Magenis syndrome)/duplication (Potocki–Lupski syndrome) | # 182290/ #610883 | 5 | 5 | 10 |
| 17q11.2 deletion | #613675 | 4 | 4 | |
| 17q12 deletion/duplication | #614527/#614526 | 4 | 9 | 13 |
| 17q21.31 deletion/duplication | #610443/ #613533 | 9 | 1 | 10 |
| 18p deletion | #146390 | 5 | 5 | |
| 18q deletion | #601808 | 5 | 5 | |
| 22q11.2 duplication (Cat‐eye syndrome) | #115470 | 2 | 2 | |
| 22q11.2 deletion (DiGeorge/VCFS syndrome) | #192430/#188400/#608363 | 28 | 8 | 36 |
| Distal 22q11.2 deletion/duplication | #611867 | 1 | 2 | 3 |
| 22q13.33 deletion (Phelan‐McDermid syndrome)/22q13 duplication | #606232/ #615538 | 6 | 1 | 7 |
| Xp22.31 deletion/duplication | #308100 | 3 | 1 | 4 |
| Xp11.22‐p11.23 duplication | #300801 | 2 | 2 | |
| Xq25 duplication | #300979 | 1 | 1 | |
| Xq28 deletion (Rett syndrome)/duplication | #300815/#312750/#300260 | 5 | 5 | |
| Total number of deletions (%) | 263 (68%) | |||
| Total number of duplications/amplifications (%) | 124 (32%) | |||
| Total number of CNVs | 387 (20%a) | |||
CNV percentages are calculated on the total number of 1,890 CNVs
3.2. Detection rate
In order to determine which clinical signs significantly increased or decreased the DR and the pCNV DR of the CMA, we evaluated the DR and the pCNV DR for each of the 28 defined clinical categories (Figure 3 and Figure 4a).
Figure 3.
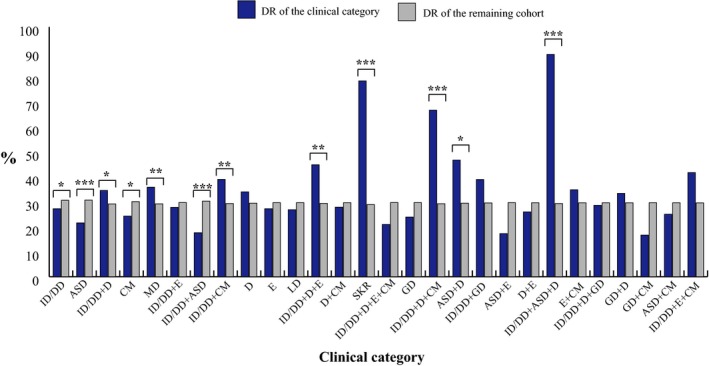
DR of each of the 28 single/combined clinical categories represented in the cohort analysed. Clinical categories with a significantly different DR are shown. * .01< p‐value <.05; ** .001< p‐value <.01; *** p‐value <.001
Figure 4.
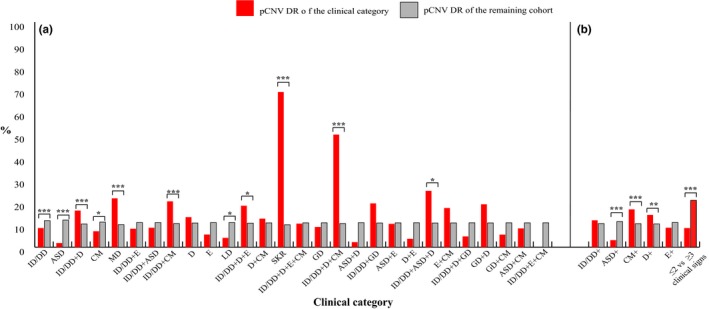
(a) pCNV DR of each of the 28 single/combined clinical categories represented in the cohort analysed. (b) pCNV DR of clinical categories of patients referred for ID/DD, ASD, CM and D plus any other single clinical sign, for ≤ 2 clinical signs and for ≥ 3 clinical signs. Clinical categories with a significantly different pCNV DR are shown. * .01< p‐value <.05; ** .001< p‐value <.01; *** p‐value <.001
Among these clinical categories, the DR value ranged from 18% to 89%. It was significantly higher in patients referred for ID/DD + ASD + D (89%), SKR (78%), ID/DD + D + CM (67%), ASD + D (47%), ID/DD + D + E (45%), ID/DD + CM (39%), MD (36%), and ID/DD + D (35%), and lower for those with ID/DD (27%), CM (24%), ASD (22%), and ID/DD + ASD (18%) (Figure 3 and Table 4). The pCNV DR ranges from < 1% to 69%, being significantly higher for patients referred for SKR (69%), ID/DD + D + CM (39%), ID/DD + ASD + D (25%), MD (22%), ID/DD + CM (20%), ID/DD + D + E (18%), and ID/DD + D (16%) and significantly lower for those with ID/DD (8%), CM (7%), LD (4%), and ASD (2%) (Figure 4a and Table 4).
In the effort of highlighting new clinical markers, we analysed the pCNV DR of different subgroups of patients sorted out from the above‐cited categories. In particular, we focused our attention on the subgroups of patients referred for ID/DD, CM, D, ASD, and E, all of which were manifested as the only clinical finding (non‐syndromic presentation) or combined with any other single clinical sign (Figure 4b and Table 4).
In order to evaluate whether a higher complexity of the clinical phenotype predicts a higher pCNV DR, we compared the subgroup of patients with ≤2 clinical signs with that of patients with ≥3 clinical signs (Figure 4b and Table 4).
4. DISCUSSION
To date, several cohorts of patients referred to CMA for single and variably combined phenotypes have been reported in the literature, highlighting the importance of CMA in the diagnostic routine (Ahn et al., 2013; Bartnik et al., 2014; Battaglia et al., 2013; Cappuccio et al., 2016; Carreira et al., 2015; D'Arrigo et al., 2016; Kaminsky et al., 2011; Mc Cormack et al., 2016; Quintela et al., 2017). Most of the analyzed cohorts are limited in size; in particular, only five took in account > 1,000 patients (Ahn et al., 2013; Carreira et al., 2015; Di Gregorio et al., 2017; Kaminsky et al., 2011; Mc Cormack et al., 2016). Here we presented a retrospective study of 5,110 CMA which represents the largest Italian cohort investigated so far.
As is known CMA encompasses different types of array‐based genomic analyses, including CGH‐ and SNP‐arrays. The SNP‐array technology increases the DR of CMA providing the possibility to detect uniparental disomies (UPDs) or loss of heterozygosity (LOH) regions which might unmask recessive mutations (Cirello et al., 2018; D'Amours et al., 2014; de Leeuw et al., 2011). However, most laboratories are still reticent to use SNP‐arrays in the clinical setting; this includes the laboratories participating in our study, as inferred by their small number (3 laboratories over 17 used CGH + SNP‐/SNP‐arrays).
Despite most of the laboratories performed the CGH‐array analysis at high resolution, the average number of CNVs per patient with an abnormal molecular karyotype is 1,3, and 79% of cases show only one non‐benign CNV, including 27% of cases with a pCNV, 7% a LP, 37% a US, and 8% a LB CNV. In addition, most CNVs are < 1 Mb in size, as also is shown by Battaglia et al. (2013), but while most of the VOUS are < 500 kb, the most frequent category size for pCNVs is > 5Mb (Battaglia et al., 2013).
Since 2010, a consensus statement recommended CMA as a first‐tier test in patients with ID/DD and/or ASDs and/or CM, except for patients with obvious chromosomal syndromes or a family history of chromosomal rearrangement/multiple miscarriages (Miller et al., 2010). In accordance with this recommendation, most of the patients of the present cohort have been referred to CMA for isolated or variably combined ID/DD, ASDs, and CM (Table 1). In addition to these clinical phenotypes, currently D and E are two other clinical entities frequently investigated (Table 1). This evidence is attested by recent reports which show the relative high amount of patient cohorts exclusively referred to CMA for non‐syndromic or syndromic E (Bartnik et al., 2012; Coppola et al., 2019; Fry et al., 2016; Wincent et al., 2015).
Obviously, CMA can detect chromosomal aneuploidies like standard karyotyping. In 2013 Ahn et al. reported a percentage of chromosomal aneuploidies of 4% (Ahn et al., 2013; this percentage is lower (~1%) in our cohort, likely because CMA has not always been performed as a first‐level analysis.
Interestingly, ~ 1% of the CNVs show a mosaic profile, similarly to what observed in 2013 in the cohort of Ahn et al., providing evidence for a phenomenon which is certainly underestimated. This effect is possibly caused on one side by the technical limits of CMA itself and on the other by the probable escape from referral of low‐rate mosaic cases due to their attenuated clinical phenotypes (Ahn et al., 2013; Recalcati et al., 2018).
In order to evaluate the yield of CMA in the diagnostic routine, the DR and the pCNV DR represent important parameters. The first highlights the ability to detect in the genome rare CNVs that could be potentially disease‐causing; the second measures the ability to identify those CNVs considered pathogenic by the literature.
The comparison between the DR of the present cohort (30%) and those previously reported confirms a high DR for CMA, although with a variability that ranges from 22% to 61%, dependent on the study (Ahn et al., 2013; Bartnik et al., 2014, 2012; Battaglia et al., 2013; Cappuccio et al., 2016; Carreira et al., 2015; D'Arrigo et al., 2016; Fry et al., 2016; Kaminsky et al., 2011; Mc Cormack et al., 2016; Quintela et al., 2017; Vianna et al., 2016; Wincent et al., 2015). Such variability is linked to several parameters: the cohort's size, the resolution of the platforms used, the bias due to an a priori selection of patients, and the laboratory‐specific application of CNV classification criteria. For what concerns specifically the influence of the cohort size, DR variability is more limited, ranging from 25% to 30% in the large cohorts (Ahn et al., 2013; Carreira et al., 2015; Kaminsky et al., 2011; Mc Cormack et al., 2016).
Differently from the DR, the literature shows a fairly high consensus for what concerns the pCNV DR. This finding probably reflects the larger amount of data that enhance the identification of pCNVs. Such solid agreement for pCNV frequency correlates also to a more precise and internationally defined criteria for pCNV classification. The pCNV DR indicated by our study is 11%, in line with the lower limit of the interval extrapolated from different studies in the literature (10%–16%) (Ahn et al., 2013; Bartnik et al., 2014, 2012; Battaglia et al., 2013; Cappuccio et al., 2016; Carreira et al., 2015; D'Arrigo et al., 2016; Fry et al., 2016; Kaminsky et al., 2011; Mc Cormack et al., 2016; Quintela et al., 2017; Vianna et al., 2016; Wincent et al., 2015).
The comparison among pCNVs and VOUS points out that pCNVs are mainly de novo and are deletions, whereas VOUS are mainly inherited and are duplications; in addition, the average size of pCNVs is much higher than that of VOUS, while the average size of pathogenic deletions is lower than that of pathogenic duplications (Table 2). This result is linked to the specific way in which a rare CNV is considered responsible for a clinical phenotype which results from several factors, including the type of imbalance (deletion or duplication/amplification), the size, and the inheritance pattern. In general, there is a higher propensity to consider as pathogenic, deletions and de novo or large CNVs, while mainly as VOUS duplications and inherited or small CNVs.
Although several data in the literature support these strict associations, CNV classification remains a complex and highly error‐prone process. The remarkable difficulty in CNV classification pinpoints the importance of deep‐phenotyping patients in order to allow a correct genotype‐to‐phenotype correlation and CNV interpretation.
In the processed cohort, we found that 20% of CNVs were associated to a known syndrome, a value lower than the one obtained for the CNVs identified by CMA studies (Ahn et al., 2013; Castronovo et al., 2015; Kaminsky et al., 2011; Mc Cormack et al., 2016). In compliance with the literature, the most common microdeletion syndromes are the 22q11.2 and the 16p11.2 microdeletion, while the most common microduplication syndromes are the 15q11.2, the 16p13.11, and the 16p11.2 microduplications (Ahn et al., 2013; Kaminsky et al., 2011).
Consistent with the genome architecture, in our study, the predominant chromosomes carrying CNVs and pCNVs are chromosomes 15, 16, 17, and 22, which are more predisposed to genomic imbalances due to their enrichment in segmental duplications (SDs) (Bailey et al., 2002). On the contrary, the poorest are chromosomes 14 and 20 which belong to the group of chromosomes with a low SD content (Bailey et al., 2002). The predominant chromosomes we highlighted are in accordance with other literature studies (Ahn et al., 2013; Kaminsky et al., 2011; Maini et al., 2018; Mc Cormack et al., 2016) which, however, reported also chromosomes 1 and 7. This difference is easily explained by the fact that we introduced a normalization for chromosome length which had filtered out chromosomes 1 and 7 because of their size.
Although nowadays there is a high consensus concerning the reasons for referral to CMA, to date there is no evidence on the contribution of each single clinical sign to the diagnostic yield of CMA. Nonetheless the high number of patients referred to CMA and the resources invested underline the relevance of investigating this aspect. In the last years, several studies focused their attention on clinically filtered subgroups of patients (Bartnik et al., 2014, 2012; Battaglia et al., 2013; Cappuccio et al., 2016; Coppola et al., 2019; D'Arrigo et al., 2016; Di Gregorio et al., 2017; Fry et al., 2016; Lintas et al., 2017; Maini et al., 2018; Napoli et al., 2018; Quintela et al., 2017; Vianna et al., 2016; Wincent et al., 2015), however to date no ascertained clinical marker has been indicated.
Aiming at identifying which clinical signs associated with a higher or lower CMA detection yield might be considered positive/negative clinical markers, we analyzed different subgroups of patients sorted out from the whole cohort.
Out of all the single/combined clinical categories considered, concomitance of CM or D with any other single clinical sign emerged as the highest positive marker for CMA. This result was also supported by the significant higher pCNV DR here reported for the clinical categories of patients referred for ID/DD combined with D and/or CM and for ID/DD combined with ASD and D. In line with our result, in 2013 Battaglia et al. suggested a higher detection yield for a cohort of patients referred for variably combined ID/DD/ASD/D, whereas in 2018 Maini et al. reported D as a positive predictive factor for pCNV (Battaglia et al., 2013; Maini et al., 2018). This result confirms that CMA is highly recommendable to patients with a syndromic developmental phenotype that comprises at least D and/or CM.
For the first time, in our cohort non‐syndromic CM emerged as a negative marker, hence suggesting that a phenotype characterized only by CM is not significantly associated to a genomic imbalance. None of the previously reported cohorts included a group of patients exclusively referred for CM. In addition to non‐syndromic CM, also non‐syndromic neurodevelopmental disorders were considered as negative markers, as also confirmed in the subgroups of patients exclusively referred for non‐syndromic ID/DD, ASD, or LD. The literature reports other cohorts of patients referred for ID/DD, but such cohorts included both non‐syndromic and syndromic ID/DD making a comparison with our study not appropriate (Bartnik et al., 2014; D'Arrigo et al., 2016; Di Gregorio et al., 2017; Quintela et al., 2017). ID/DD combined to any other single clinical sign and non‐syndromic D emerged neither as a negative nor as a positive clinical marker.
Further dissection of clinical categories indicated that in our study ASD represents a negative marker even when combined to any other clinical sign. These data support the strong evidence of a polygenic model for neuropsychiatric disorders (Sullivan & Geschwind, 2019). The higher percentage of pCNVs reported in other ASD cohorts is influenced by the specific preselection criteria used, such as a positive family history or the coexistence of other clinical signs (Lintas et al., 2017; Napoli et al., 2018).
Finally, in our study, E emerged neither as a negative nor as a positive clinical marker, as also indicated by previous reports (Bartnik et al., 2012; Coppola et al., 2019; Fry et al., 2016; Wincent et al., 2015) concerning patients exclusively referred for E, where the pCNV DR was lower than the average detection yield reported for CMA in the unselected cohorts.
According to Maini et al. (2018), as well as in our study, the higher the complexity of the clinical phenotype the higher the pCNV DR: indeed the pCNV DR is significantly lower in the subgroups of patients with ≤2 clinical signs with respect to those with ≥3 clinical signs.
In summary, we report CMA results on a cohort of 5,110 patients referred for variably combined phenotypes which represents the largest cohort of Italian patients ever analyzed. The results we obtained confirm the high DR and the pCNV DR of CMA, which we show to be suitable to identify the genetic cause of a clinical phenotype in about 1 to 10 patients.
The large size of our cohort allowed us to identify new clinical markers for CMA, such as D and/or CM which combined with any other single clinical sign positively associate to CMA. On the contrary, non‐syndromic neurodevelopmental disorders and non‐syndromic CM emerged as negative markers. Moreover, there was no increase in the DR of CMA in syndromic/non‐syndromic E, in ID/DD combined with any other clinical sign and in non‐syndromic D patients.
Further studies are needed to better characterize the new clinical markers we have appointed. In this respect, much effort should be given to collecting patients’ clinical information using standardized and structured tools (Human Phenotype Ontology (HPO) https://hpo.jax.org/app/ and Face2Gene https://www.face2gene.com/) in order to facilitate CNV classification and to allow a correct genotype‐to‐phenotype correlation for the diagnostic assessment and consequent rehabilitation of patients. For this purpose, inserting the newly identified CNVs and the associated clinical phenotype(s) in national and international databases is strongly recommended in order to benefit from an increasingly refined CNV classification.
CONFLICT OF INTEREST
The authors declare no conflict of interest.
AUTHORS CONTRIBUTION STATEMENT
DG made substantial contribution to conception and design of the study. DG, MPR, and IC coordinated data collection. All the authors performed and provided CMA results. IC and MPR organized the data. IB performed statistical analysis of the data. IC elaborated the data and drafted the manuscript. DG and LL revised the manuscript and approved its final version.
ACKNOWLEDGMENTS
The authors thank the patients and their families and Dr Nicola Manfrini for language editing of the manuscript. This work was partially supported by the Italian Ministry of Health funding to Istituto Auxologico Italiano (RC 08C723_2017‐2019 and RC 08C922_2019).
Catusi I, Recalcati MP, Bestetti I, et al. Testing single/combined clinical categories on 5110 Italian patients with developmental phenotypes to improve array‐based detection rate. Mol Genet Genomic Med. 2020;8:e1056 10.1002/mgg3.1056
Funding information
This work was partially supported by the Italian Ministry of Health funding to Istituto Auxologico Italiano (RC 08C723_2017‐2019 and RC 08C922_2019).
REFERENCES
- Ahn, J. W. , Bint, S. , Bergbaum, A. , Mann, K. , Hall, R. P. , & Ogilvie, C. M. (2013). Array CGH as a first line diagnostic test in place of karyotyping for postnatal referrals ‐ results from four years' clinical application for over 8,700 patients. Molecular Cytogenetics, 6(1), 16 10.1186/1755-8166-6-16 [DOI] [PMC free article] [PubMed] [Google Scholar]
- Bailey, J. A. , Gu, Z. , Clark, R. A. , Reinert, K. , Samonte, R. V. , Schwartz, S. , … Eichler, E. E. (2002). Recent segmental duplications in the human genome. Science, 297(5583), 1003–1007. 10.1126/science.1072047 [DOI] [PubMed] [Google Scholar]
- Bartnik, M. , Nowakowska, B. , Derwińska, K. , Wiśniowiecka‐Kowalnik, B. , Kędzior, M. , Bernaciak, J. , … Stankiewicz, P. (2014). Application of array comparative genomic hybridization in 256 patients with developmental delay or intellectual disability. Journal of Applied Genetics, 55(1), 125–144. 10.1007/s13353-013-0181-x [DOI] [PMC free article] [PubMed] [Google Scholar]
- Bartnik, M. , Szczepanik, E. , Derwińska, K. , Wiśniowiecka‐Kowalnik, B. , Gambin, T. , Sykulski, M. , … Stankiewicz, P. (2012). Application of array comparative genomic hybridization in 102 patients with epilepsy and additional neurodevelopmental disorders. American Journal of Medical Genetics Part B: Neuropsychiatric Genetics, 159B(7), 760–771. 10.1002/ajmg.b.32081 [DOI] [PubMed] [Google Scholar]
- Battaglia, A. , Doccini, V. , Bernardini, L. , Novelli, A. , Loddo, S. , Capalbo, A. , … Carey, J. C. (2013). Confirmation of chromosomal microarray as a first‐tier clinical diagnostic test for individuals with developmental delay, intellectual disability, autism spectrum disorders and dysmorphic features. European Journal of Paediatric Neurology, 17(6), 589–599. 10.1016/j.ejpn.2013.04.010 [DOI] [PubMed] [Google Scholar]
- Cappuccio, G. , Vitiello, F. , Casertano, A. , Fontana, P. , Genesio, R. , Bruzzese, D. , … Melis, D. (2016). New insights in the interpretation of array‐CGH: Autism spectrum disorder and positive family history for intellectual disability predict the detection of pathogenic variants. Italian Journal of Pediatrics, 42, 39 10.1186/s13052-016-0246-7 [DOI] [PMC free article] [PubMed] [Google Scholar]
- Carreira, I. M. , Ferreira, S. I. , Matoso, E. , Pires, L. M. , Ferrão, J. , Jardim, A. , … de Melo, J. B. (2015). Copy number variants prioritization after array‐CGH analysis ‐ a cohort of 1000 patients. Molecular Cytogenetics, 8, 103 10.1186/s13039-015-0202-z [DOI] [PMC free article] [PubMed] [Google Scholar]
- Castronovo, C. , Crippa, M. , Bestetti, I. , Rusconi, D. , Russo, S. , Larizza, L. , … Finelli, P. (2015). Complex de novo chromosomal rearrangement at 15q11‐q13 involving an intrachromosomal triplication in a patient with a severe neuropsychological phenotype: Clinical report and review of the literature. American Journal of Medical Genetics. Part A, 167A(1), 221–230. 10.1002/ajmg.a.36815 [DOI] [PubMed] [Google Scholar]
- Cirello, V. , Giorgini, V. , Castronovo, C. , Marelli, S. , Mainini, E. , Sironi, A. , … Fugazzola, L. (2018). Segmental maternal UPD of chromosome 7q in a patient with pendred and Silver Russell syndromes‐like features. Frontiers in Genetics, 9, 600 10.3389/fgene.2018.00600 [DOI] [PMC free article] [PubMed] [Google Scholar]
- Coppola, A. , Cellini, E. , Stamberger, H. , Saarentaus, E. , Cetica, V. , Lal, D. , … Zuffardi, O. (2019). Diagnostic implications of genetic copy number variation in epilepsy plus. Epilepsia, 60(4), 689–706. 10.1111/epi.14683 [DOI] [PMC free article] [PubMed] [Google Scholar]
- D’Amours, G. , Langlois, M. , Mathonnet, G. , Fetni, R. , Nizard, S. , Srour, M. , … Lemyre, E. (2014). SNP arrays: Comparing diagnostic yields for four platforms in children with developmental delay. BMC Medical Genomics, 7, 70 10.1186/s12920-014-0070-0 [DOI] [PMC free article] [PubMed] [Google Scholar]
- D’Arrigo, S. , Gavazzi, F. , Alfei, E. , Zuffardi, O. , Montomoli, C. , Corso, B. , … Pantaleoni, C. (2016). The diagnostic yield of array comparative genomic hybridization is high regardless of severity of intellectual disability/developmental delay in children. Journal of Child Neurology, 31(6), 691–699. 10.1177/0883073815613562 [DOI] [PubMed] [Google Scholar]
- de Leeuw, N. , Hehir‐Kwa, J. Y. , Simons, A. , Geurts van Kessel, A. , Smeets, D. F. , Faas, B. H. , & Pfundt, R. (2011). SNP array analysis in constitutional and cancer genome diagnostics–copy number variants, genotyping and quality control. Cytogenetic and Genome Research, 135(3–4), 212–221. 10.1159/000331273 [DOI] [PubMed] [Google Scholar]
- Di Gregorio, E. , Riberi, E. , Belligni, E. F. , Biamino, E. , Spielmann, M. , Ala, U. , … Ferrero, G. B. (2017). Copy number variants analysis in a cohort of isolated and syndromic developmental delay/intellectual disability reveals novel genomic disorders, position effects and candidate disease genes. Clinical Genetics, 92(4), 415–422. 10.1111/cge.13009 [DOI] [PubMed] [Google Scholar]
- Fry, A. E. , Rees, E. , Thompson, R. , Mantripragada, K. , Blake, P. , Jones, G. , … Kerr, M. P. (2016). Pathogenic copy number variants and SCN1A mutations in patients with intellectual disability and childhood‐onset epilepsy. BMC Medical Genetics, 17(1), 34 10.1186/s12881-016-0294-2 [DOI] [PMC free article] [PubMed] [Google Scholar]
- Kaminsky, E. B. , Kaul, V. , Paschall, J. , Church, D. M. , Bunke, B. , Kunig, D. , … Martin, C. L. (2011). An evidence‐based approach to establish the functional and clinical significance of copy number variants in intellectual and developmental disabilities. Genetics in Medicine, 13(9), 777–784. 10.1097/GIM.0b013e31822c79f9 [DOI] [PMC free article] [PubMed] [Google Scholar]
- Kearney, H. M. , Thorland, E. C. , Brown, K. K. , Quintero‐Rivera, F. , & South, S. T. ; Working Group of the American College of Medical Genetics Laboratory Quality Assurance, Committee (2011). American College of Medical Genetics standards and guidelines for interpretation and reporting of postnatal constitutional copy number variants. Genetics in Medicine, 13(7), 680–685. 10.1097/GIM.0b013e3182217a3a [DOI] [PubMed] [Google Scholar]
- Lintas, C. , Picinelli, C. , Piras, I. S. , Sacco, R. , Brogna, C. , & Persico, A. M. (2017). Copy number variation in 19 Italian multiplex families with autism spectrum disorder: Importance of synaptic and neurite elongation genes. American Journal of Medical Genetics Part B: Neuropsychiatric Genetics, 174(5), 547–556. 10.1002/ajmg.b.32537 [DOI] [PubMed] [Google Scholar]
- Maini, I. , Ivanovski, I. , Djuric, O. , Caraffi, S. G. , Errichiello, E. , Marinelli, M. , … Garavelli, L. (2018). Prematurity, ventricular septal defect and dysmorphisms are independent predictors of pathogenic copy number variants: A retrospective study on array‐CGH results and phenotypical features of 293 children with neurodevelopmental disorders and/or multiple congenital anomalies. Italian Journal of Pediatrics, 44(1), 34 10.1186/s13052-018-0467-z [DOI] [PMC free article] [PubMed] [Google Scholar]
- Mc Cormack, A. , Claxton, K. , Ashton, F. , Asquith, P. , Atack, E. , Mazzaschi, R. , … George, A. M. (2016). Microarray testing in clinical diagnosis: An analysis of 5,300 New Zealand patients. Molecular Cytogenetics, 9, 29 10.1186/s13039-016-0237-9 [DOI] [PMC free article] [PubMed] [Google Scholar]
- Miller, D. T. , Adam, M. P. , Aradhya, S. , Biesecker, L. G. , Brothman, A. R. , Carter, N. P. , … Ledbetter, D. H. (2010). Consensus statement: Chromosomal microarray is a first‐tier clinical diagnostic test for individuals with developmental disabilities or congenital anomalies. The American Journal of Human Genetics, 86(5), 749–764. 10.1016/j.ajhg.2010.04.006 [DOI] [PMC free article] [PubMed] [Google Scholar]
- Napoli, E. , Russo, S. , Casula, L. , Alesi, V. , Amendola, F. A. , Angioni, A. , … Vicari, S. (2018). Array‐CGH Analysis in a Cohort of Phenotypically Well‐Characterized Individuals with "Essential" Autism Spectrum Disorders. Journal of Autism and Developmental Disorders, 48(2), 442–449. 10.1007/s10803-017-3329-4 [DOI] [PubMed] [Google Scholar]
- Quintela, I. , Eirís, J. , Gómez‐Lado, C. , Pérez‐Gay, L. , Dacruz, D. , Cruz, R. , … Barros, F. (2017). Copy number variation analysis of patients with intellectual disability from North‐West Spain. Gene, 626, 189–199. 10.1016/j.gene.2017.05.032 [DOI] [PubMed] [Google Scholar]
- Recalcati, M. P. , Bonati, M. T. , Beltrami, N. , Cardarelli, L. , Catusi, I. , Costa, A. , … Giardino, D. (2018). Molecular cytogenetics characterization of seven small supernumerary marker chromosomes derived from chromosome 19: Genotype‐phenotype correlation and review of the literature. European Journal of Medical Genetics, 61(3), 173–180. 10.1016/j.ejmg.2017.11.007 [DOI] [PubMed] [Google Scholar]
- Richards, S. , Aziz, N. , Bale, S. , Bick, D. , Das, S. , Gastier‐Foster, J. , … Rehm, H. L. (2015). Standards and guidelines for the interpretation of sequence variants: A joint consensus recommendation of the American college of medical genetics and genomics and the association for molecular pathology. Genetics in Medicine, 17(5), 405–424. 10.1038/gim.2015.30 [DOI] [PMC free article] [PubMed] [Google Scholar]
- Silva, M. , de Leeuw, N. , Mann, K. , Schuring‐Blom, H. , Morgan, S. , Giardino, D. , … Hastings, R. (2019). European guidelines for constitutional cytogenomic analysis. European Journal of Human Genetics, 27(1), 1–16. 10.1038/s41431-018-0244-x [DOI] [PMC free article] [PubMed] [Google Scholar]
- Sullivan, P. F. , & Geschwind, D. H. (2019). Defining the genetic, genomic, cellular, and diagnostic architectures of psychiatric disorders. Cell, 177(1), 162–183. 10.1016/j.cell.2019.01.015 [DOI] [PMC free article] [PubMed] [Google Scholar]
- Vianna, G. S. , Medeiros, P. F. , Alves, A. F. , Silva, T. O. , & Jehee, F. S. (2016). Array‐CGH analysis in patients with intellectual disability and/or congenital malformations in Brazil. Genetics and Molecular Research, 15(1), 10.4238/gmr.15017769 [DOI] [PubMed] [Google Scholar]
- Wincent, J. , Kolbjer, S. , Martin, D. , Luthman, A. , Amark, P. , Dahlin, M. , & Anderlid, B. M. (2015). Copy number variations in children with brain malformations and refractory epilepsy. American Journal of Medical Genetics. Part A, 167A(3), 512–523. 10.1002/ajmg.a.36886 [DOI] [PubMed] [Google Scholar]