

Abstract
Aims
Functional brain abnormalities, including altered cerebral perfusion and functional connectivities, have been illustrated in adults with attention‐deficit/hyperactivity disorder (aADHD). The present study attempted to explore the alterations of cerebral blood flow (CBF) and resting‐state functional connectivity (RSFC) simultaneously to understand the neural mechanisms for adults with ADHD comprehensively.
Methods
Resting‐state arterial spin labeling (ASL) and blood oxygenation level‐dependent (BOLD) magnetic resonance imaging (MRI) data were acquired for 69 male aADHD and 69 matched healthy controls (HCs). The altered CBFs associated with aADHD were explored based on both categorical (aADHD vs HCs) and dimensional (correlation with aADHD core symptoms) perspectives. Then, the seed‐based RSFC analyses were developed for the regions showing significant alterations of CBF.
Results
Significantly decreased CBF in the large‐scale resting‐state networks regions (eg, ventral attentional network, somatomotor network, limbic network) and subcortical regions was indicated in aADHD compared with HCs. The correlation analyses indicated that the hypoperfusion in left putamen/global pallidum and left amygdala/hippocampus was correlated with ADHD inattentive and total symptoms, respectively. Further, weaker negative functional connectivity between left amygdala and bilateral supplementary motor area, bilateral superior frontal gyrus, and left medial frontal gyrus was found in adults with ADHD.
Conclusion
The present findings suggested alterations of both cerebral perfusion and functional connectivity for the left amygdala in aADHD. The combination of CBF and RSFCs may help to interpret the neuropathogenesis of ADHD more comprehensively.
Keywords: ADHD, cerebral blood flow, functional connectivity, resting‐state fMRI
1. INTRODUCTION
Attention‐deficit/hyperactivity disorder (ADHD) is described by developmentally inappropriate symptoms of inattention, hyperactivity, and impulsivity,1 which is childhood‐onset neurodevelopment disorders. The estimated worldwide prevalence of adult ADHD (aADHD) is 2.5%.2 Emotional dysregulation and substance abuse are important associated features and comorbidities in aADHD, leading to significant personal and societal costs.3, 4
However, the neurobiology mechanism of ADHD has been unclear till now. Accumulating evidences suggested brain structural and functional brain abnormality in both children and adults with ADHD. Abnormalities of the regions and networks have been found in ADHD using both structural and functional measures by multiple modalities, including structural magnetic resonance imaging (MRI),5 diffusion tensor imaging (DTI),6 and functional MRI (fMRI).7, 8 For fMRI, resting‐state functional connectivity (RSFC) has been widely used as an important feature reflecting brain function and suggested multiple networks possibly involved in the neural mechanism of ADHD, such as default mode network, frontoparietal network, ventral attention network, dorsal attention network, and so on.7 Besides, cerebral blood flow (CBF), as a physiology parameter closely related to cerebral metabolism,9 has received much attention in recent years. CBF is defined as the blood volume that delivers to per unit mass per unit time in brain tissue.10 CBF is of vital importance for brain function. It ensures the proper and enough delivery of oxygen and energy substance for brain and transports the metabolic waste away.11
In previous studies, positron emission tomography (PET) and single photon emission computerized tomography (SPECT) have been widely used to identify CBF abnormalities in brain regions in ADHD. Hypoperfusion in the striatum has been consistently demonstrated in previous studies.12, 13 In addition, abnormal perfusion in frontal, temporal, and cerebellar regions12, 13, 14, 15 was often reported in spite of conflicts. However, as invasive procedures, PET and SPECT still take a long time before acquisition with low spatial resolution.16 In the past decade, the arterial spin labeling (ASL) MRI is extensively used to rapidly quantify CBF as a noninvasive technique by an endogenous contrast.17, 18, 19 The CBF measured by ASL‐MRI was considered to be closely coupled with glucose metabolism measured by PET.20 O'Gorman et al21 found increased regional cerebral perfusion in adults with ADHD in the left caudate nucleus, frontal and parietal regions by using continuous arterial spin labeling (CASL) technique, which could be normalized by stimulant treatment. A recent pharmacological magnetic resonance imaging (phMRI) study supported the above finding in some extent, demonstrating decreased CBF in extent cortical areas for adults with ADHD after an acute challenge with methylphenidate (0.5 mg/kg).22
As a physiological parameter of brain metabolism, CBF is also closely related to neuronal activity.23 According to the neurovascular coupling hypothesis, increased CBF may be coupled with higher degree of functional brain connectivity.10 The BOLD signal is considered to measure the changes in neuronal activity‐related blood oxygenation and reflects the intrinsic functional activation of the brain.24 The seed‐based functional connectivity detected by BOLD fMRI measures the temporal correlations of low‐frequency fluctuations. It is widely used because of its inherent simplicity, sensitivity, and ease of interpretation.24 Different aspects of resting‐state neuronal activity may be captured by CBF and BOLD signal. Investigating the collaboration of ASL and BOLD could provide a more comprehensive picture on the physiological and pathophysiological mechanisms of the brain.23 Recently, Liang et al25 investigated the relationship between CBF and RSFC of the whole brain in healthy adults and reported a tight relationship between CBF and the functional connectivity of the brain in the DMN and executive control network. In addition, altered coupling between CBF and functional connectivity has been illustrated for several neuropsychiatric disorders, such as schizophrenia,10 mild cognitive impairment,26 and mood disorders.27 However, further research was still needed to investigate the correlation between CBF and functional connectivity in patients with ADHD.
In the current study, we attempted to investigate the alterations in CBF as well as seed‐based functional connectivity in male adults with ADHD by using ASL and BOLD fMRI. Firstly, we investigated the brain regions with altered cerebral perfusion in male aADHD based on both categorical (male aADHD vs male age‐matched healthy controls) and dimensional (correlation with ADHD core symptoms) perspectives. Following the identification of ADHD‐related alteration of CBF, the potential functional connectivity disruptions for these CBF‐altered regions were further evaluated by seed‐based FC analysis based on resting‐state BOLD fMRI. To exclude the potential confounding influence of gender28 on the results, our current study only included male subjects to reduce the sample heterogeneity.
2. MATERIALS AND METHODS
2.1. Participants
A total of 138 male adults were recruited for the present study, including 69 patients with ADHD recruited from clinics of Peking University Sixth Hospital and 69 healthy controls matched for age and intelligence quotient (IQ). The recruitment procedure was shown in a flowchart in detail (see Figure S1). All the participants signed the informed consent, and the current study was approved by the Research Ethics Review Board of Peking University Sixth Hospital.
All the participants were interviewed and underwent diagnosis by a qualified psychiatrist, screening for any potential comorbidities according to exclusion criteria using the Structured Clinical Interview for DSM‐IV Axis I Disorders (SCID‐I).29 To confirm the diagnosis of ADHD, Conner's Adult ADHD Diagnostic Interview for DSM‐IV30 was also interviewed. Full‐scale IQ measurements were made using the Wechsler Adult Intelligence Scale‐Third Edition. Furthermore, to the evaluation of the severity of ADHD symptoms, the ADHD Rating Scale‐IV (ADHD RS‐IV)31was completed by the participants.
The inclusion criteria were as follows: (a) aged above 18 years; (b) right hand dominant; (c) no history of severe physical disease; (d) no current diagnosis of schizophrenia, severe major depression, clinically significant panic disorder, bipolar disorder, or mental retardation; (e) a full‐scale IQ above 90; and (f) psychoactive medicine naïve. A previous history or current diagnosis of psychiatric disorders, as evidenced in the SCID‐I assessment, or neurological disorders resulted in exclusion from the HC groups. Eight ADHD patients had the history of major depressive disorder, while three patients suffered the general anxiety disorder. In addition, if the head movements are more than 3 mm translation or three degrees of rotation in any direction, the subjects will be excluded. In current study, no subject was excluded based on the head movements. The demographic and clinical data for participants are given in Table 1 in detail.
Table 1.
Demographic and clinical information
| Variables | ADHD (n = 69) (mean ± SD) | HC (n = 69) (mean ± SD) | T‐value | P‐value |
|---|---|---|---|---|
| Age (y) | 26.5 ± 3.9 | 26.3 ± 3.9 | 0.24 | 0.810 |
| Full‐scale IQ scores | 120.72 ± 7.49 | 121.72 ± 7.92 | −0.76 | 0.447 |
| ADHD subtypes (inattentive/combined) | 54/15 | – | – | – |
| ADHD core symptoms | ||||
| Total | 46.49 ± 7.60 | 25.60 ± 5.84 | 15.57 | <0.0001* |
| Inattention | 27.16 ± 4.27 | 13.40 ± 3.29 | 17.62 | <0.0001* |
| Hyperactivity/impulsivity | 19.46 ± 5.26 | 12.19 ± 3.11 | 8.53 | <0.0001* |
| Mean FD (mm) | 0.100 ± 0.05 | 0.108 ± 0.07 | −0.73 | 0.466 |
Abbreviations: ADHD, attention‐deficit/hyperactivity disorder; FD, framewise displacement; HC, healthy control.
The P‐value was obtained by the two‐sample two‐tailed t test.
2.2. Image acquisition
All MRI images were acquired using a 3.0‐Tesla MR system (General Electric; Discovery MR750) in the Center for Neuroimaging in Peking University Sixth Hospital. High‐resolution 3D T1‐weighted anatomical images were acquired using a three‐dimensional fast spoiled gradient‐recalled (3D‐FSPGR) sequence with the following parameters: repetition time (TR) = 6.66 ms; echo time (TE) = 2.93 ms; inversion time (TI) = 450 ms; flip angle (FA) = 8°; field of view (FOV) = 256 × 256 mm; matrix = 256 × 256; slice thickness = 1.0 mm with no gap, 180 sagittal slices. The resting‐state perfusion imaging was performed using a pseudo‐continuous ASL (pcASL) sequence with a 3D fast spin‐echo acquisition and background suppression: TR/TE = 4781/11.12 ms; postlabel delays = 1525 ms; spiral in readout of 12 arms with 512 sample points; FOV = 220 × 220 mm; matrix = 128 × 128; FA = 111°; slice thickness = 3 mm, no gap; 45 axial slices; and number of excitation = 3. Resting‐state BOLD images were acquired using a gradient‐echo single‐shot echo planar imaging (GRE‐SS‐EPI) sequence with the following parameters: TR/TE = 2000/30 ms; FA = 90°, slice thickness = 3.2 mm with no gap; matrix = 64 × 64; FOV = 220 × 220 mm; 43 axial slices and 240 volumes. During the scans, participants were instructed to relax with their eyes closed, stay still, and think of nothing in particular without falling asleep.
2.3. fMRI data preprocessing
Functional MRI data were preprocessed using the Data Processing & Analysis for (Resting‐State) Brain Imaging (DPABI).32 Firstly, the first 10 volumes of each participant were discarded. Next, we performed slice timing correction to correct the remaining volumes for the acquisition time delay and realignment for correcting head motion across volumes. The realigned functional data were spatially normalized by a nonlinear registration to the EPI template in MNI standard space33 and resampled to 3 mm isotropic voxels. The functional data were spatially smoothed with a 6 mm full‐width at half maximum (FWHM) Gaussian kernel. Linear detrending of the time series was conducted. Subsequently, we performed nuisance signal regression (including Friston's 24 head motion parameters, global mean signal, white matter, and cerebrospinal fluid signals) to reduce the confounding artifacts of head motion and physiological noises (ie, cardiac and respiratory fluctuations) during the resting state. Temporal bandpass filtering (0.01‐0.1 Hz) was conducted. Furthermore, data were preprocessed with scrubbing for validation (See Validation Analysis2.2), and the results are shown in the Supplementary Materials.
2.4. CBF quantification and statistical analysis
Generally, ASL imaging data consist of a control image and a label image. The quantitative CBF images were calculated by using a single‐compartment kinetic model10 by using ASLtbx.34 Then, SPM12 software (http://www.fil.ion.ucl.ac.uk/spm) was used to further process the CBF data. First, for each subject the T1 image was coregistered to the perfusion image, which was aligned with the corresponding CBF image. Next, the coregistered T1 image was segmented into gray matter, white matter, and cerebrospinal fluid. The CBF map was normalized into the MNI space based on the transform parameters that were estimated during the segmentation of the T1 image and further resampled to 3 × 3 × 3 mm3. Finally, the normalized CBF images were smoothed with 6 mm FWHM. CBF analysis was conducted within the gray matter mask without the cerebellum (N voxel = 45 381). For each participant, the spatially normalized CBF images were transformed to z‐score by subtracting the mean and then being divided by standard deviation across all voxels in the gray matter mask for further statistical analysis. To identify ADHD‐related alterations of CBF, we conducted categorical and dimensional analyses sequentially. Firstly, between‐group comparisons were assessed by using an independent two‐sample t test with age as covariates between the ADHD and HC groups. The significance of the statistical maps was corrected for multiple comparisons to a significant level of P < 0.05 through a permutation test (parameters: 10 000 permutations, individual voxel P < 0.01, cluster size >509). The statistical nonparametric mapping (SNPM) toolbox provides an extensible framework for voxel level nonparametric permutation tests of functional neuroimaging experiments with independent observation. It is a commonly used approach of an initial cluster‐forming thresholding, with generally better sensitivity.35, 36
Secondly, the association between the altered CBFs and the severity of ADHD symptoms was investigated. Correlation analyses were performed between CBF z‐value of brain regions showing significant between‐group differences and ADHD rating scale scores (inattention, hyperactivity/impulsivity, and total scores) in the ADHD group. We performed the voxel‐wise correlation within the brain regions showing significant intergroup differences. The statistical level of significance was corrected for multiple comparisons to a significant level of P < 0.05 through a nonparametric permutation test (parameters: 10 000 permutations, individual voxel P < 0.01, cluster size >28) using the SNPM toolbox.
2.5. Resting‐state functional connectivity analysis and statistical analysis
In order to evaluate the potential functional connectivity disruptions in the ADHD‐related CBF‐altered regions based on both categorical and dimensional perspectives, the seed‐based functional connectivity analysis was conducted. The seed regions of interest (ROIs) were defined as the spatial overlapping areas between the clusters showing significant CBF alterations and the Anatomical Automatic Labeling (AAL) template.37 For each ROI, the functional connectivity maps were calculated by Pearson's correlation coefficients between the mean time series of this ROI and the time series of each voxel in the gray matter for each participant.38 The Fisher's z‐transformation was conducted to each functional connectivity map.
Within each group of adults with ADHD or the HC, a one‐sample t test was performed to individual z‐score maps for each ROI, with age and mean framewise displacement (mFD) as covariates. The statistical level of significance was corrected for multiple comparisons to a significant level of P < 0.05 through a nonparametric permutation test (parameters: 10 000 permutations, individual voxel P < 0.01, cluster size >349) using SNPM toolbox.
The between‐group comparisons (ADHD vs HC) were assessed by using an independent two‐sample t test with age and mFD as covariates. For each seed ROI, functional connectivity comparison was conducted within the brain mask showing significant correlations with the seed in either group. The statistical level of significance was corrected for multiple comparisons to a significant level of P < 0.05 through a permutation test (parameters: 10 000 permutations, individual voxel P < 0.01, cluster size >231) using SNPM toolbox. The association between the abnormal functional connectivity and the severity of ADHD symptoms was further investigated. We extracted the amygdala‐based rsFC of the brain regions with abnormal functional connectivity. Correlation analyses were performed between amygdala‐based rsFC z‐value of brain regions with abnormal functional connectivity and ADHD rating scale scores (inattention, hyperactivity/impulsivity, and total scores) in the ADHD group. The statistical level of significance was a significant level of P < 0.05.
2.6. Validation analysis
The scrubbing procedure was further conducted during the fMRI data preprocessing to reduce the potential confounding influence of head motion on results. During the scrubbing process, volume with a FD > 0.5 mm would be scrubbed. And then, its prior one and next two volumes would be removed from this participant. In addition, 11 patients with comorbidities (eight patients with the previous history of major depressive disorder and three patients with current diagnosis of general anxiety disorder) were further excluded to verify the main results.
3. RESULTS
The main results were reported using the fMRI data without scrubbing in all 138 participants. The main findings remained almost unchanged when performing data scrubbing or excluding comorbidities (Figures S2‐S7).
3.1. Spatial distribution of CBF
Attention‐deficit/hyperactivity disorder patients and HCs showed similar spatial patterns in CBF (Figure 1). At the group level, brain regions with higher CBF were mainly located in the bilateral posterior cingulate cortex/precuneus, medial prefrontal cortex (PFC), anterior cingulate cortex, lateral temporal, and parietal cortices, regardless of the group considered. Most of the regions comprise the default mode network regions (DMN). In addition, regions located in the insula, lateral PFC, sensorimotor also showed high CBF in the both groups.
Figure 1.
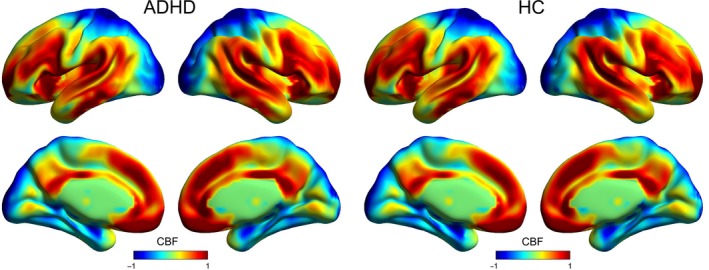
Spatial distribution maps of CBF at the group level. For each group (ie, ADHD or HC), the individual CBF maps were normalized to z‐scores and then averaged across subjects to generate a group‐level map. ADHD, attention‐deficit/hyperactivity disorder; CBF, cerebral blood flow; HC, healthy controls
3.2. CBF changes in ADHD
Between‐group comparison revealed significantly lower CBF in the ADHD group, primarily in the left hemisphere. The regions included insula, orbital frontal cortex, putamen, pallidum, amygdala, supramarginal gyrus, rolandic operculum, temporal gyrus, hippocampus, parahippocampal gyrus, and olfactory gyrus (family‐wise error, FWE corrected P < 0.05; Figure 2). These hypoperfusion regions mainly located in the somatomotor network, ventral attention network, limbic network, and subcortical regions (Table S1). No significantly increased CBF was found in ADHD group.
Figure 2.
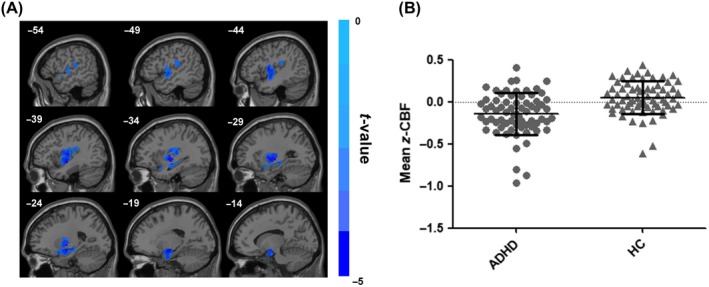
Group differences in CBF between ADHD patients and healthy controls. The independent two‐sample t test was conducted between the ADHD group and the healthy control group. All results were corrected for multiple comparisons to a significant level of P < 0.05 through a nonparametric permutation test (10 000 permutations, individual voxel P < 0.01) using SNPM toolbox. The cold colors denote significantly decreased CBF in the ADHD patients. ADHD, attention‐deficit/hyperactivity disorder; CBF, cerebral blood flow; HC, healthy controls
3.3. Correlation between CBF and ADHD core symptoms
For the brain regions showing group‐difference CBFs, we further calculated the correlation between the altered CBF and the severity of ADHD core symptoms. In adults with ADHD, a significant negative correlation existed between the CBF in the left putamen/global pallidum and the inattention score (r = −0.335, FWE corrected P < 0.05; Figure 3A,B). In addition, we found a significant negative correlation between the CBF in the left amygdala/hippocampus and total score (r = −0.386, FWE corrected P < 0.05) (Figure 3C,D). We did not find any significant correlation for the hyperactivity/impulsivity score.
Figure 3.
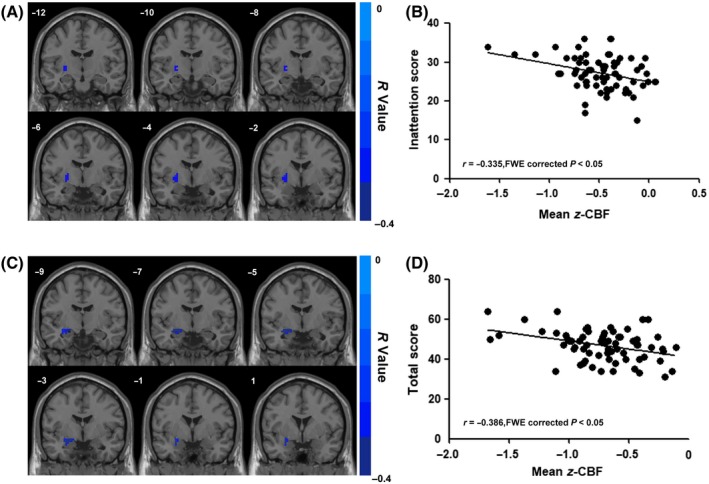
Correlation between CBF of regions showing between‐group differences (ADHD vs HC) and ADHD core symptoms. The correlation analysis was performed within ADHD patients with inattention, hyperactivity/impulsivity, and total symptom scores measured by ADHD RS‐IV. All results were corrected for multiple comparisons to a significant level of P < 0.05 through a nonparametric permutation test (10 000 permutations, individual voxel P < 0.01). A, The correlation between the left putamen/global pallidum z‐CBF and inattention scores in male aADHD. B, Scatter plot of correlation between the mean z‐CBF of left putamen/global pallidum and inattention scores in male aADHD. C, The correlation between the left amygdala/hippocampus z‐CBF and inattention scores in male aADHD. D, Scatter plot of correlation between the mean z‐CBF of left amygdala/hippocampus and total scores in male aADHD. ADHD, attention‐deficit/hyperactivity disorder; CBF, cerebral blood flow; HC, healthy controls
3.4. Resting‐state functional connectivity changes in ADHD
In our current study, ADHD‐related hypoperfusion regions were defined based on both categorical and dimensional perspectives which might help us to illustrate the cautious ADHD‐related abnormalities. Eventually, four brain regions, including putamen, pallidum, amygdala, and hippocampus, were used for seed‐based functional connectivity analysis (Table 2). The functional connectivity maps of these four ROIs were estimated by using BOLD fMRI, separately. Adults with ADHD exhibited the similar functional connectivity patterns with those of the HCs. For instance, a significantly positive functional connectivity with the left amygdala was shown in the partial cortex, temporal lobe, and limbic lobes, while a significant negative functional connectivity with the left amygdala was located in the occipital gyrus, temporal lobe, and PFC (Figure S2). Furthermore, the regions with significant positive or negative correlations with each ROI in two groups were combined to generate as masks for between‐group analysis, separately.
Table 2.
Four brain regions used for seed‐based functional connectivity analyses
| Area | L/R | Cluster size (number of voxels) |
|---|---|---|
| Amygdala | L | 28 |
| Hippocampus | L | 12 |
| Putamen | L | 26 |
| Pallidum | L | 7 |
The clusters with significant CBF alterations from both categorical and dimensional analyses were defined as the regions of interest (ROIs) which were extracted by overlapping the AAL template.
Two‐sample t tests were performed to investigate the differences in functional connectivity of the ROIs between adults with ADHD and HCs. For the left amygdala ROI, significant decrease functional connectivity was observed in ADHD group primarily involving the bilateral supplementary motor area, bilateral superior frontal gyrus, and left medial frontal gyrus (FWE corrected P < 0.05) within the negative functional connectivity mask (Figure 4). No significantly different regions were found within the positive connectivity mask as well as connectivity masks of the other three ROIs. Correlation analyses between altered functional connectivity and ADHD core symptoms did not indicate any significant results (Table S2).
Figure 4.
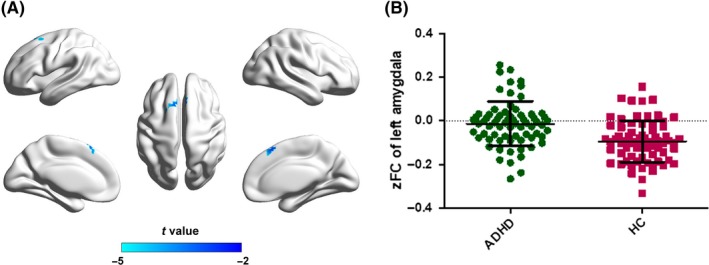
Between‐group comparisons for the seed‐based functional connectivity with the seeds of left amygdala. The independent two‐sample t test was conducted between the ADHD group and the healthy control group. All results were corrected for multiple comparisons to a significant level of P < 0.05 through a nonparametric permutation test (10 000 permutations, individual voxel P < 0.01, cluster size >231) using the SNPM toolbox. zFC, z‐value of functional connectivity. ADHD, attention‐deficit/hyperactivity disorder; CBF, cerebral blood flow; HC, healthy controls
4. DISCUSSION
In this study, we investigated the CBF changes in the gray matter and the potential functional connectivity disruptions for the CBF‐altered regions in male adults with ADHD by combining pcASL and BOLD fMRI techniques. Firstly, compared with healthy controls, adults with ADHD showed significantly reduced perfusion in the regions involving in somatomotor network, ventral attention network, limbic network, and subcortical regions. Further analyses from dimensional perspective indicated significant negative correlation between the CBF in left amygdala/hippocampus and total symptoms, the left putamen/global pallidum, and inattention score, respectively. When further evaluating the potential changes in seed‐based functional connectivity for these hypoperfusion regions, weaker negative connectivities were found between left amygdala and the supplementary motor area, superior frontal gyrus, and left medial frontal gyrus.
4.1. Hypoperfusion of CBF in ADHD
Significantly reduced perfusion has been consistently reported in patients with ADHD in the somatomotor network, ventral attentional network, and limbic network in early PET and SPECT studies.13, 14, 15, 39 The hypoperfused regions in the frontoparietal network (eg, inferior frontal cortex and insula) observed in our study also showed abnormalities in structural and functional aspects by other MRI studies.5, 40, 41 Using CASL data, O'Gorman et al21 found that regional CBF increased in the adults with ADHD in the regions of left caudate nucleus, frontal and parietal cortices, indicating the abnormality of frontoparietal network involved in the neurobiological mechanism of ADHD. Although taking consideration of the same regions, the direction of the perfusion among the nonmedicated aADHD in our study differs to that in the O'Gorman's study. The sample size and heterogeneity might have a potential impact on the divergent results, since only nine male ADHD patients and 11 healthy male volunteers were recruited in the O'Gorman's study.
In our study, the hypoperfusion areas in aADHD are primarily in the left hemisphere. Atypical lateralization has always been indicated in neuroimaging studies for ADHD.42, 43, 44 In line with our asymmetry results, previous studies found that altered CBF and functional connectivity existed in the left hemisphere among ADHD.45, 46 However, specific alterations in right hemisphere have also been reported in other studies.47, 48 In the future, more specialized and detailed exploration will help us to elucidate the defined pattern of lateralization in ADHD and promote our in‐depth understanding of its neuropathogenesis.
There is considerable evidence that ADHD involves dysfunctional modulation by the brain neurotransmitters dopamine (DA) and noradrenaline (NA) in frontal‐striatal network, which is part of frontoparietal network.49 CBF is modulated by the changes in neurotransmitters (eg, dopamine)12, 50 and nonspecific agents (eg, nitric oxide),51, 52 since these chemicals play a role in adjusting vascular response. One possible explanation for the hypoperfusion is that the abnormal dopamine system or nitric oxide system in ADHD may reduce the cerebral blood flow in certain brain regions. Abnormal dopamine system or nitric oxide system in ADHD may also contribute to abnormalities of vascular response.50, 51, 52 In the future, combination analyses with neurobiological (eg, NO/nNOS level) and genetic features (eg, NOS1‐ex1fVNTR) may help us to interpret the CBF abnormality in adults with ADHD more comprehensively.
4.2. Relationship between hypoperfusion and symptoms severity in adults with ADHD
We found a significant negative correlation between the CBF in the left amygdala/hippocampus and the total score. That means the more the CBF reduced, the higher the ADHD core symptoms indicated. In addition, a significant negative correlation existed between the CBF in the left putamen/global pallidum and the inattention score.
Correlation between CBF and the severity of ADHD core symptom has been barely reported in previous studies, most of which were obtained from functional connectivity‐based analyses. A previous study has demonstrated that inattention and hyperactivity/impulsivity symptom scores were positively correlated with functional connectivity in the networks of posterior putamen and ventral caudate.53 Another studies have shown that functional connectivity of the DMN and frontoparietal networks was modulated by the levels of inattention symptoms.54 Per Luca Cocchi et al55 found that the connectivity between the left amygdala and the right precentral gyrus in the ADHD group was negatively associated with the severity of past symptoms of inattention. The findings in current study were in consistent with previous studies that similar regions were indicated. Hippocampus, an important part of DMN for encoding the spatial and temporal relationships between sensory experiences and storage in long‐term memory, was crucial to the pathogenesis of ADHD. Based on these findings, it is reasonable to conjecture that hypoperfusion in the amygdala, hippocampus, and putamen may harm the region's capability to be recruited when responding to task demands. As a result, it might contribute to the impaired cognitive performance and ADHD symptoms. The spatial overlap of the ADHD‐related brain regions showing functional alterations between our current CBF‐based and previous FC‐based findings supported the neurovascular coupling in some extent. This also propelled us to further explore whether those brain regions with altered CBFs also indicated abnormality of functional connectivity.
4.3. Functional connectivity disruptions in the regions with hypoperfusion
Seed‐based functional connectivity analysis revealed that, compared to the healthy controls, left amygdala showed significantly decreased connectivity with PFC including superior frontal gyrus and left medial frontal gyrus, and supplementary motor area in adults with ADHD.
The amygdala plays an important role in emotional and social behavior, in charge of emotional processing.56 PFC is of vital importance for the emotional processing in “top‐down” regulation, while amygdala is involved in “bottom‐up” emotional processing.57, 58 Abnormal connectivities of amygdala with other regions spread across the lateral PFC, medial frontal region, rostral ACC, and right precentral gyrus, caudate nucleus, as well as the left orbitofrontal cortex in ADHD patients have been reported in the existing literature.55, 59, 60, 61 Emotional dysregulation is a commonly described feature of ADHD, even it has been suggested to be included in the diagnostic criteria as core components, especially for adults with ADHD.62 Our current finding might provide imaging evidence supporting the consideration of emotional symptoms in ADHD evaluation and diagnosis in the future. Considering the pathophysiological mechanisms of emotion‐related disorders were closely related to amygdala, we excluded all the ADHD patients with emotion‐related disorders for validation analysis. However, the results did not change substantially (Figures S4‐S7). The supplementary motor area is thought to be an important part of the core response inhibition system.63 In a meta‐analysis, superior/middle frontal gyrus and supplementary motor area are decreased brain activation in previous study.64 The findings in current study indicated the abnormalities in similar regions, which are overlapping with previous study.
The results in our study indicated that the regions with hypoperfusion in adults with ADHD showed potential functional connectivity alterations. Since BOLD signal is considered to measure the concentration of oxygen from hemoglobin in the brain, the hypoperfusion would change the local deoxyhemoglobin concentration in the brain, which might result in the changes of BOLD signal intensity and the functional connectivity of the whole brain.65 Meanwhile, the association between neuronal activity and blood perfusion might be bidirectional. The stronger functional connectivity tends to need greater metabolic demand, resulting in increased perfusion.52 The regulation of CBF in brain activity process involves the interaction of neurons, glia, and vascular cells.66 When the functional dysconnectivity exists, the neurons and glia could not generate the signals regulating the vascular changes. Thus, it might lead to hypoperfusion in ADHD. To establish the direct links between micro‐circulation and brain activity, we also have tried to perform correlation analyses between the CBF and rsFC for the ADHD‐related brain regions; however, no significant results were yielded (Table S3). In addition, we also did not find the correlation between abnormal functional connectivity and ADHD core symptoms. Similar phenomenon has also been indicated in other studies,10, 67 which might be due to the potential sequential relationship between CBF and FC or the more complexity of brain activities which may be resulted from other neurobiological changes in addition to the blood perfusion. In other opinion, in spite of negative findings for direct links, there might be some potential indirect links existed. For example, nNOS‐derived NO has been indicated to influence both the cerebral blood perfusion and monoaminergic transmitter systems68 that it might drive the indirect links between CBF and FC very likely. As we mentioned above, future combination analyses with neurobiological (eg, NO/nNOS level) and genetic features (eg, NOS1‐ex1fVNTR) may help us to verify this intriguing hypothesis. From another aspect, it might be suggested that CBF should be more sensitive as a more meaningful biomarker for the neuropsychiatric disorders.67
4.4. Limitations
There are several issues that should be further considered. Firstly, our current study only recruited male subjects to reduce the potential confounding effect of sample heterogeneity; however, this may also limit the generalizability of current findings to females. Secondly, the participants in current study are without the ADHD‐HI subtype. Finally, the IQs of both groups were high, although no significant differences were found in aADHD and healthy controls. Therefore, the findings in the study should be explained more cautiously and the further replications in samples with females, all subtypes, and general IQs are needed.
5. CONCLUSIONS
By combination of CBF and RSFCs, we found the alternations of cerebral perfusion and functional abnormality of the left amygdala associated with adults with ADHD. The combination of multimodal fMRI, such as ASL and BOLD, may provide complementary information and comprehensive insights to the pathophysiological mechanisms of ADHD from the perspective of combination of neuron and vessels.
CONFLICT OF INTEREST
The authors declare no conflict of interest.
Supporting information
ACKNOWLEDGMENTS
We would like to thank the participants who participate in this research.
Tan Y‐W, Liu L, Wang Y‐F, et al. Alterations of cerebral perfusion and functional brain connectivity in medication‐naïve male adults with attention‐deficit/hyperactivity disorder. CNS Neurosci Ther. 2020;26:197–206. 10.1111/cns.13185
Tan and Liu are contributed equally to this work.
Funding information
This work was supported by the National Science Foundation of China (81571340), the National Key Basic Research Program of China (973 program 2015CB856405), the Capital Foundation of Medical Developments (CFMD:2016‐2‐4113), the National Natural Science Foundation of China (81873802, 81761148026), Beijing Natural Science Foundation (7172245), and Beijing Municipal Science & Technology Commission (No. Z161100000516032).
REFERENCES
- 1. APA . Diagnostic and Statistical Manual of Mental Disorders: Text Revision, 4th edn Washington, DC: American Psychiatric Association; 2000. [Google Scholar]
- 2. Asherson P, Buitelaar J, Faraone SV, Rohde LA. Adult attention‐deficit hyperactivity disorder: key conceptual issues. Lancet Psychiatry. 2016;3(6):568‐578. [DOI] [PubMed] [Google Scholar]
- 3. Uchida M, Spencer TJ, Faraone SV, Biederman J. Adult outcome of ADHD: an overview of results from the MGH longitudinal family studies of pediatrically and psychiatrically referred youth with and without ADHD of both sexes. J Atten Disord. 2018;22(6):523‐534. [DOI] [PubMed] [Google Scholar]
- 4. Moffitt TE, Houts R, Asherson P, et al. Is adult ADHD a childhood‐onset neurodevelopmental disorder? Evidence from a four‐decade longitudinal cohort study. Am J Psychiatry. 2015;172(10):967‐977. [DOI] [PMC free article] [PubMed] [Google Scholar]
- 5. Schneider M, Retz W, Coogan A, Thome J, Rosler M. Anatomical and functional brain imaging in adult attention‐deficit/hyperactivity disorder (ADHD)–a neurological view. Eur Arch Psychiatry Clin Neurosci. 2006;256(Suppl 1):i32‐i41. [DOI] [PubMed] [Google Scholar]
- 6. Rubia K, Alegria A, Brinson H. Imaging the ADHD brain: disorder‐specificity, medication effects and clinical translation. Expert Rev Neurother. 2014;14(5):519‐538. [DOI] [PubMed] [Google Scholar]
- 7. Castellanos FX, Proal E. Large‐scale brain systems in ADHD: beyond the prefrontal‐striatal model. Trends Cogn Sci. 2012;16(1):17‐26. [DOI] [PMC free article] [PubMed] [Google Scholar]
- 8. Mostert JC, Shumskaya E, Mennes M, et al. Characterising resting‐state functional connectivity in a large sample of adults with ADHD. Prog Neuropsychopharmacol Biol Psychiatry. 2016;67:82‐91. [DOI] [PMC free article] [PubMed] [Google Scholar]
- 9. Vaishnavi SN, Vlassenko AG, Rundle MM, Snyder AZ, Mintun MA, Raichle ME. Regional aerobic glycolysis in the human brain. Proc Natl Acad Sci U S A. 2010;107(41):17757‐17762. [DOI] [PMC free article] [PubMed] [Google Scholar]
- 10. Zhu J, Zhuo C, Xu L, Liu F, Qin W, Yu C. Altered coupling between resting‐state cerebral blood flow and functional connectivity in schizophrenia. Schizophr Bull. 2017;43(6):1363‐1374. [DOI] [PMC free article] [PubMed] [Google Scholar]
- 11. Fantini S, Sassaroli A, Tgavalekos KT, Kornbluth J. Cerebral blood flow and autoregulation: current measurement techniques and prospects for noninvasive optical methods. Neurophotonics. 2016;3(3):031411. [DOI] [PMC free article] [PubMed] [Google Scholar]
- 12. da Silva N, Szobot CM, Anselmi CE, et al. Attention deficit/hyperactivity disorder: is there a correlation between dopamine transporter density and cerebral blood flow? Clin Nucl Med. 2011;36(8):656‐660. [DOI] [PubMed] [Google Scholar]
- 13. Kim BN, Kim JW, Kang H, et al. Regional differences in cerebral perfusion associated with the alpha‐2A‐adrenergic receptor genotypes in attention deficit hyperactivity disorder. J Psychiatry Neurosci. 2010;35(5):330‐336. [DOI] [PMC free article] [PubMed] [Google Scholar]
- 14. Schweitzer JB, Faber TL, Grafton ST, Tune LE, Hoffman JM, Kilts CD. Alterations in the functional anatomy of working memory in adult attention deficit hyperactivity disorder. Am J Psychiatry. 2000;157(2):278‐280. [DOI] [PubMed] [Google Scholar]
- 15. Kim BN, Lee JS, Shin MS, Cho SC, Lee DS. Regional cerebral perfusion abnormalities in attention deficit/hyperactivity disorder. Statistical parametric mapping analysis. Eur Arch Psychiatry Clin Neurosci. 2002;252(5):219‐225. [DOI] [PubMed] [Google Scholar]
- 16. Moses WW. Fundamental limits of spatial resolution in PET. Nucl Instrum Methods Phys Res A. 2011;648(Supplement 1):S236‐S240. [DOI] [PMC free article] [PubMed] [Google Scholar]
- 17. Golay X, Hendrikse J, Lim TC. Perfusion imaging using arterial spin labeling. Top Magn Reson Imaging. 2004;15(1):10‐27. [DOI] [PubMed] [Google Scholar]
- 18. Williams DS, Detre JA, Leigh JS, Koretsky AP. Magnetic resonance imaging of perfusion using spin inversion of arterial water. Proc Natl Acad Sci U S A. 1992;89(1):212‐216. [DOI] [PMC free article] [PubMed] [Google Scholar]
- 19. Borogovac A, Asllani I. Arterial spin labeling (ASL) fMRI: advantages, theoretical constrains, and experimental challenges in neurosciences. Int J Biomed Imaging. 2012;2012:818456. [DOI] [PMC free article] [PubMed] [Google Scholar]
- 20. Jueptner M, Weiller C. Review: does measurement of regional cerebral blood flow reflect synaptic activity? Implications for PET and fMRI. Neuroimage. 1995;2(2):148‐156. [DOI] [PubMed] [Google Scholar]
- 21. O'Gorman RL, Mehta MA, Asherson P, et al. Increased cerebral perfusion in adult attention deficit hyperactivity disorder is normalised by stimulant treatment: a non‐invasive MRI pilot study. NeuroImage. 2008;42(1):36‐41. [DOI] [PubMed] [Google Scholar]
- 22. Schrantee A, Mutsaerts H, Bouziane C, Tamminga H, Bottelier MA, Reneman L. The age‐dependent effects of a single‐dose methylphenidate challenge on cerebral perfusion in patients with attention‐deficit/hyperactivity disorder. Neuroimage Clin. 2017;13:123‐129. [DOI] [PMC free article] [PubMed] [Google Scholar]
- 23. Zou Q, Yuan B‐K, Gu H, et al. Detecting static and dynamic differences between eyes‐closed and eyes‐open resting states using ASL and BOLD fMRI. PLoS One. 2015;10(3):e0121757. [DOI] [PMC free article] [PubMed] [Google Scholar]
- 24. Fox MD, Raichle ME. Spontaneous fluctuations in brain activity observed with functional magnetic resonance imaging. Nat Rev Neurosci. 2007;8(9):700‐711. [DOI] [PubMed] [Google Scholar]
- 25. Liang X, Zou Q, He Y, Yang Y. Coupling of functional connectivity and regional cerebral blood flow reveals a physiological basis for network hubs of the human brain. Proc Natl Acad Sci U S A. 2013;110(5):1929‐1934. [DOI] [PMC free article] [PubMed] [Google Scholar]
- 26. Lou W, Shi L, Wong A, Chu W, Mok V, Wang D. Changes of cerebral perfusion and functional brain network organization in patients with mild cognitive impairment. J Alzheimers Dis. 2016;54(1):397‐409. [DOI] [PubMed] [Google Scholar]
- 27. He Z, Sheng W, Lu F, et al. Altered resting‐state cerebral blood flow and functional connectivity of striatum in bipolar disorder and major depressive disorder. Prog Neuropsychopharmacol Biol Psychiatry. 2019;90:177‐185. [DOI] [PubMed] [Google Scholar]
- 28. Park BY, Park H. Connectivity differences between adult male and female patients with attention deficit hyperactivity disorder according to resting‐state functional MRI. Neural Regen Res. 2016;11(1):119‐125. [DOI] [PMC free article] [PubMed] [Google Scholar]
- 29. First M, Gibbon M, Williams JB. Structured Clinical Interview for DSM‐IV® Axis I Disorders (SCID‐I), Clinical Version. Arlington, VA: American Psychiatric Publishing; 1996. [Google Scholar]
- 30. Epstein J, Conners CK. Conner’s Adult ADHD Diagnostic Interview for DSM‐IV:CAADID[EB/OL]. Toronto, ON: MHS. [Google Scholar]
- 31. DuPaul G, Reid R. ADHD Rating Scale‐IV: Checklists, Norms, and Clinical Interpretation. New York, NY: Guilford; 1998. [Google Scholar]
- 32. Yan CG, Wang XD, Zuo XN, Zang YF. DPABI: Data processing & analysis for (resting‐state) brain imaging. Neuroinformatics. 2016;14(3):339‐351. [DOI] [PubMed] [Google Scholar]
- 33. Calhoun VD, Wager TD, Krishnan A, et al. The impact of T1 versus EPI spatial normalization templates for fMRI data analyses. Hum Brain Mapp. 2017;38(11):5331‐5342. [DOI] [PMC free article] [PubMed] [Google Scholar]
- 34. Wang ZE, Aguirre GK, Rao H, et al. Empirical optimization of ASL data analysis using an ASL data processing toolbox: ASLtbx. Magn Reson Imaging. 2008;26(2):261‐269. [DOI] [PMC free article] [PubMed] [Google Scholar]
- 35. Nichols TE, Holmes AP. Nonparametric permutation tests for functional neuroimaging: a primer with examples. Hum Brain Mapp. 2002;15(1):1‐25. [DOI] [PMC free article] [PubMed] [Google Scholar]
- 36. Eklund A, Nichols TE, Knutsson H. Cluster failure: why fMRI inferences for spatial extent have inflated false‐positive rates. Proc Natl Acad Sci U S A. 2016;113(28):7900‐7905. [DOI] [PMC free article] [PubMed] [Google Scholar]
- 37. Tzourio‐Mazoyer N, Landeau B, Papathanassiou D, et al. Automated anatomical labeling of activations in SPM using a macroscopic anatomical parcellation of the MNI MRI single‐subject brain. NeuroImage. 2002;15(1):273‐289. [DOI] [PubMed] [Google Scholar]
- 38. Yu X, Liu LU, Chen W, et al. Integrity of amygdala subregion‐based functional networks and emotional lability in drug‐naïve boys with ADHD. J Atten Disord. 2016. pii: 1087054716661411. [DOI] [PubMed] [Google Scholar]
- 39. Lee JS, Kim BN, Kang E, et al. Regional cerebral blood flow in children with attention deficit hyperactivity disorder: comparison before and after methylphenidate treatment. Hum Brain Mapp. 2005;24(3):157‐164. [DOI] [PMC free article] [PubMed] [Google Scholar]
- 40. Rubia K, Alegria AA, Brinson H. Brain abnormalities in attention‐deficit hyperactivity disorder: a review. Rev Neurol. 2014;58(Suppl 1):S3‐S16. [PubMed] [Google Scholar]
- 41. Yep R, Soncin S, Brien DC, Coe BC, Marin A, Munoz DP. Using an emotional saccade task to characterize executive functioning and emotion processing in attention‐deficit hyperactivity disorder and bipolar disorder. Brain Cogn. 2018;124:1‐13. [DOI] [PubMed] [Google Scholar]
- 42. Langleben DD, Austin G, Krikorian G, Ridlehuber HW, Goris ML, Strauss HW. Interhemispheric asymmetry of regional cerebral blood flow in prepubescent boys with attention deficit hyperactivity disorder. Nucl Med Commun. 2001;22(12):1333‐1340. [DOI] [PubMed] [Google Scholar]
- 43. Rubia K, Smith AB, Brammer MJ, Toone B, Taylor E. Abnormal brain activation during inhibition and error detection in medication‐naive adolescents with ADHD. Am J Psychiatry. 2005;162(6):1067‐1075. [DOI] [PubMed] [Google Scholar]
- 44. Rubia K, Overmeyer S, Taylor E, et al. Functional frontalisation with age: mapping neurodevelopmental trajectories with fMRI. Neurosci Biobehav Rev. 2000;24(1):13‐19. [DOI] [PubMed] [Google Scholar]
- 45. Hasler R, Preti MG, Meskaldji DE, et al. Inter‐hemispherical asymmetry in default‐mode functional connectivity and BAIAP2 gene are associated with anger expression in ADHD adults. Psychiatry Res Neuroimaging. 2017;269:54‐61. [DOI] [PubMed] [Google Scholar]
- 46. Li D, Li T, Niu Y, et al. Reduced hemispheric asymmetry of brain anatomical networks in attention deficit hyperactivity disorder. Brain Imaging Behav. 2019;13(3):669‐684. [DOI] [PubMed] [Google Scholar]
- 47. Silk TJ, Vilgis V, Adamson C, et al. Abnormal asymmetry in frontostriatal white matter in children with attention deficit hyperactivity disorder. Brain Imaging Behav. 2016;10(4):1080‐1089. [DOI] [PubMed] [Google Scholar]
- 48. Oner O, Oner P, Aysev A, Kucuk O, Ibis E. Regional cerebral blood flow in children with ADHD: changes with age. Brain Dev. 2005;27(4):279‐285. [DOI] [PubMed] [Google Scholar]
- 49. Dalley JW, Mar AC, Economidou D, Robbins TW. Neurobehavioral mechanisms of impulsivity: fronto‐striatal systems and functional neurochemistry. Pharmacol Biochem Behav. 2008;90(2):250‐260. [DOI] [PubMed] [Google Scholar]
- 50. Sander CY, Hooker JM, Catana C, Rosen BR, Mandeville JB. Imaging agonist‐induced D2/D3 receptor desensitization and internalization in vivo with PET/fMRI. Neuropsychopharmacology. 2016;41(5):1427‐1436. [DOI] [PMC free article] [PubMed] [Google Scholar]
- 51. Aamand R, Dalsgaard T, Ho Y‐CL, Møller A, Roepstorff A, Lund TE. A NO way to BOLD?: Dietary nitrate alters the hemodynamic response to visual stimulation. NeuroImage. 2013;83:397‐407. [DOI] [PubMed] [Google Scholar]
- 52. Venkat P, Chopp M, Chen J. New insights into coupling and uncoupling of cerebral blood flow and metabolism in the brain. Croat Med J. 2016;57(3):223‐228. [DOI] [PMC free article] [PubMed] [Google Scholar]
- 53. Oldehinkel M, Beckmann CF, Pruim RHR, et al. Attention‐deficit/hyperactivity disorder symptoms coincide with altered striatal connectivity. Biol Psychiatry Cogn Neurosci Neuroimaging. 2016;1(4):353‐363. [DOI] [PMC free article] [PubMed] [Google Scholar]
- 54. Oldehinkel M, Beckmann CF, Franke B, et al. Functional connectivity in cortico‐subcortical brain networks underlying reward processing in attention‐deficit/hyperactivity disorder. Neuroimage Clin. 2016;12:796‐805. [DOI] [PMC free article] [PubMed] [Google Scholar]
- 55. Cocchi L, Bramati IE, Zalesky A, et al. Altered functional brain connectivity in a non‐clinical sample of young adults with attention‐deficit/hyperactivity disorder. J Neurosci. 2012;32(49):17753‐17761. [DOI] [PMC free article] [PubMed] [Google Scholar]
- 56. Perlov E, Philipsen A, Tebartz van Elst L, et al. Hippocampus and amygdala morphology in adults with attention‐deficit hyperactivity disorder. J Psychiatry Neurosci. 2008;33(6):509‐515. [PMC free article] [PubMed] [Google Scholar]
- 57. Shaw P, Stringaris A, Nigg J, Leibenluft E. Emotion dysregulation in attention deficit hyperactivity disorder. Am J Psychiatry. 2014;171(3):276‐293. [DOI] [PMC free article] [PubMed] [Google Scholar]
- 58. Wessa M, Linke J. Emotional processing in bipolar disorder: behavioural and neuroimaging findings. Int Rev Psychiatry. 2009;21(4):357‐367. [DOI] [PubMed] [Google Scholar]
- 59. Marsh AA, Finger EC, Mitchell DGV, et al. Reduced amygdala response to fearful expressions in children and adolescents with callous‐unemotional traits and disruptive behavior disorders. Am J Psychiatry. 2008;165(6):712‐720. [DOI] [PubMed] [Google Scholar]
- 60. Castellanos FX, Aoki Y. Intrinsic functional connectivity in attention‐deficit/hyperactivity disorder: a science in development. Biol Psychiatry Cogn Neurosci Neuroimaging. 2016;1(3):253‐261. [DOI] [PMC free article] [PubMed] [Google Scholar]
- 61. Plichta MM, Vasic N, Wolf RC, et al. Neural hyporesponsiveness and hyperresponsiveness during immediate and delayed reward processing in adult attention‐deficit/hyperactivity disorder. Biol Psychiatry. 2009;65(1):7‐14. [DOI] [PubMed] [Google Scholar]
- 62. Faraone SV, Rostain AL, Blader J, et al. Practitioner review: emotional dysregulation in attention‐deficit/hyperactivity disorder ‐ implications for clinical recognition and intervention. J Child Psychol Psychiatry. 2019;60(2):133‐150. [DOI] [PubMed] [Google Scholar]
- 63. Dosenbach NUF, Visscher KM, Palmer ED, et al. A core system for the implementation of task sets. Neuron. 2006;50(5):799‐812. [DOI] [PMC free article] [PubMed] [Google Scholar]
- 64. Lei DU, Du M, Wu M, et al. Functional MRI reveals different response inhibition between adults and children with ADHD. Neuropsychology. 2015;29(6):874‐881. [DOI] [PubMed] [Google Scholar]
- 65. Montagne A, Nation DA, Pa J, Sweeney MD, Toga AW, Zlokovic BV. Brain imaging of neurovascular dysfunction in Alzheimer's disease. Acta Neuropathol. 2016;131(5):687‐707. [DOI] [PMC free article] [PubMed] [Google Scholar]
- 66. Iadecola C. The neurovascular unit coming of age: a journey through neurovascular coupling in health and disease. Neuron. 2017;96(1):17‐42. [DOI] [PMC free article] [PubMed] [Google Scholar]
- 67. Sheng J, Shen Y, Qin Y, et al. Spatiotemporal, metabolic, and therapeutic characterization of altered functional connectivity in major depressive disorder. Hum Brain Mapp. 2018;39(5):1957‐1971. [DOI] [PMC free article] [PubMed] [Google Scholar]
- 68. Gao Y, Heldt SA. Lack of neuronal nitric oxide synthase results in attention deficit hyperactivity disorder‐like behaviors in mice. Behav Neurosci. 2015;129(1):50‐61. [DOI] [PMC free article] [PubMed] [Google Scholar]
Associated Data
This section collects any data citations, data availability statements, or supplementary materials included in this article.
Supplementary Materials