

Abstract
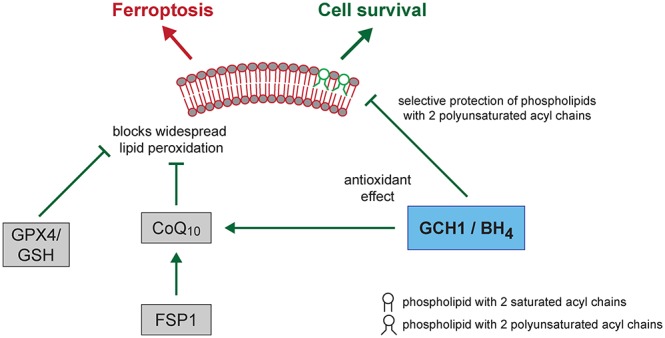
Ferroptosis is an iron-dependent form of regulated cell death linking iron, lipid, and glutathione levels to degenerative processes and tumor suppression. By performing a genome-wide activation screen, we identified a cohort of genes antagonizing ferroptotic cell death, including GTP cyclohydrolase-1 (GCH1) and its metabolic derivatives tetrahydrobiopterin/dihydrobiopterin (BH4/BH2). Synthesis of BH4/BH2 by GCH1-expressing cells caused lipid remodeling, suppressing ferroptosis by selectively preventing depletion of phospholipids with two polyunsaturated fatty acyl tails. GCH1 expression level in cancer cell lines stratified susceptibility to ferroptosis, in accordance with its expression in human tumor samples. The GCH1-BH4-phospholipid axis acts as a master regulator of ferroptosis resistance, controlling endogenous production of the antioxidant BH4, abundance of CoQ10, and peroxidation of unusual phospholipids with two polyunsaturated fatty acyl tails. This demonstrates a unique mechanism of ferroptosis protection that is independent of the GPX4/glutathione system.
Short abstract
A CRISPR activation screen identified GTP cyclohydrolase 1 and its metabolic derivative tetrahydrobiopterin as potent endogenous ferroptosis suppressors, which act independently from GPX4/glutathione.
Introduction
Ferroptosis is a form of regulated cell death that results from alterations in iron and glutathione homeostasis, leading to lethal lipid peroxidation.1−3 Loss of capacity to repair lipid peroxides can result in cellular demise.4−6 To date, four classes of ferroptosis inducers have been described (i.e., erastin, RSL3, FIN56, and FINO2) that ultimately cause loss of cellular GPX4 activity and accumulation of phospholipid hydroperoxides, which drive cell death.3,7−9 Conversely, phospholipid hydroperoxide removal, catalyzed by GPX4, supports cellular homeostasis and viability against otherwise lethal stresses.10 A reduced threshold of peroxidation-susceptible phospholipid substrates, iron depletion, lipophilic antioxidants, or treatment with the radical trapping antioxidants ferrostatin-1 or liproxstatin-1 suppresses ferroptotic cell death.1,11,12 Ferroptosis has been implicated in degenerative pathologies, including neurodegenerative disorders, ischemic injuries, and heat stress in plants, among other processes.2
Mammalian cells have evolved distinct mechanisms to cope with increased levels of oxidative damage.13−15 One metabolic pathway frequently implicated in production of reactive oxygen species includes GCH1/tetrahydrobiopterin, where GCH1 (GTPCH) is the rate-limiting enzyme for 6(R)-l-erythro-5,6,7,8-tetrahydrobiopterin (BH4) synthesis.16,17 BH4, in the presence of iron in enzyme catalytic sites, is a requisite cofactor for production of aromatic amino acids, neurotransmitters, and nitric oxide. Withdrawal of BH4 can lead to uncoupling of nitric oxide synthases (NOSs) and superoxide generation.18 Notably, GCH1 activity is negatively regulated by a feedback loop triggered by increased BH4 via GCHFR, the GTP cyclohydrolase I feedback regulator.19
In humans, GCH1 is a polymorphic locus important for pain sensitivity, cardiovascular risk, and DOPA-responsive dystonia, among other afflictions.16,20−25 Furthermore, GCH1 alternations are manifested in chronic diseases, including hypertension, diabetes, and arthrosclerosis,20,21 and are implicated in Parkinson’s disease.22,26 Several studies also point toward a role for GCH1 in some cancers.27−29
To identify additional pathways controlling ferroptosis susceptibility, we performed a CRISPR/dCas9 overexpression screen using a genome-wide activation library. Elevated gene expression, as opposed to gene knockout, is less impacted by functional redundancy and can uncover mechanisms governing cell survival. Using this method, we identified a set of protective genes that suppress ferroptosis, most prominently GCH1. Metabolic analysis of GCH1-overexpressing cells revealed BH4/BH2 as the source of the potent antiferroptotic effect of GCH1 overexpression. Supplementation with either substance rescued cell viability. Moreover, GCH1 modulation by overexpression or knockdown rendered cancer cells correspondingly resistant or sensitive to ferroptotic cell death in cultured cells. Strikingly, lipidomics analysis showed GCH1-overexpressing cells have protected phosphatidylcholine phospholipids with two polyunsaturated fatty acyl (PUFA) chains and enrich amounts of reduced CoQ10 levels after ferroptosis induction, for example, upon IKE treatment. These results illuminate a potent new axis of resistance for countering ferroptosis by an endogenously produced antioxidant and introduce a new lethal lipid oxidation product as a driver of ferroptosis in these contexts.
Results
A Whole-Genome Activation Screen Identifies GCH1 as a Potent Antagonist of Ferroptosis
To identify genes protecting against ferroptosis, we chose three established ferroptosis inducers: (1S, 3R)-RSL3 (henceforth RSL3), imidazole ketone erastin (IKE), and genetic ablation of Gpx4. For the latter, we took advantage of a tamoxifen-inducible Gpx4 knockout system in immortalized murine fibroblast (MF) cells.30 We employed a genome-wide dCas9-based activation screen (CRISPRa) via lentiviral infection31 of MF-dCas9-MS2 cells and selected surviving cells after ferroptosis induction with RSL3, IKE, or tamoxifen in pools (see Supporting Methods).
Following expansion of surviving populations, we performed deep sequencing of guide RNAs and deconvolution using ENCoRE software32 to generate a statistical index of enriched guides. The comparison of the corresponding highest-scoring candidate genes from all three conditions yielded a single gene, Gch1 (Figure 1A, Table S1), with statistical confidence (RSL3, p = 1.45 × 10⁻⁴; IKE, p = 7.20 × 10⁻⁶; Gpx4–/–, p = 0.0112). As expected, we also observed substantial overlap between RSL3 (which inhibits GPX4 activity) and genetic deletion of Gpx4, identifying five additional shared ferroptotic protective genes among these conditions (Ms4a15, Rpp25, BC048562, Tjp3, Egfl7). IKE treatment (targeting system xc–) and Gpx4–/– cells showed three enriched genes in common (Fmnl1, Zfp933, Olfr147); the IKE and RSL3 screens shared the target mitochondrial DNA topoisomerase I, Top1mt. As expected, Gpx4 overexpression protected against RSL3 and IKE, but not against its own genetic deletion. We examined gene ontology (GO) term associations (Figure S1A) and performed ingenuity pathway analysis (Figure S1B) to explore functional commonalities. Both analyses confirmed the association of several pathways with ferroptosis. Among these, iron coordination and leukotriene biosynthesis are consistent with the current model of ferroptosis.
Figure 1.

A CRISPR activation screen identifies Gch1 as ferroptosis antagonist. (A) Venn diagram of overlapping top 30 genes found in each overexpression screen against ferroptosis inducers 0.3 μM RSL3, 2 μM IKE, and Gpx4–/– by 1 μM tamoxifen. (B) Relative Gch1 mRNA expression levels and dose response curves against RSL3 treatment in Gch1-overexpressing MF-dCas9-Gch1 (Gch1 OE) cells and empty vector control (control) immortalized mouse fibroblasts. Addition of 10 μM α-tocopherol (αToc) serves as rescue control for ferroptosis. (C) Relative GCH1 mRNA expression levels and dose response curve against RSL3 treatment in HT-1080 cells overexpressing GCH1-IRES-Puro construct (GCH1 OE) and parental HT-1080 cells (parental) ± 2 μM ferrostatin-1 (Fer-1) rescue. Viability data are plotted as mean ± SEM of n = 3 (B) or n = 2 (C) technical replicates of at least three repetitions of the experiment with similar outcomes. Relative mRNA expression is shown as mean ± SD of n = 3 technical replicates of three independent repetitions of the experiment with similar results.
Next, we tested whether these candidate genes were robust regulators of ferroptosis. We generated 21 individual overexpressing MF cell pools and validated them in a viability assay against ferroptosis inducers. Doxorubicin, a DNA-intercalating agent that induces apoptosis, was included as a control for nonferroptotic cell death. Overexpression of several genes (Gch1, Ms4a15, Rpp25, Olf r367-ps, L2hgdh, Slco1a6, Olfr39) yielded almost complete protection against ferroptosis, comparable to α-tocopherol (Figure S1C, top). Others, including Egfl7, Gpx4, and 251009E07Rik, were protective, albeit at modest levels under certain conditions (Figure S1C). Resistance correlated strongly among ferroptosis inducers but was largely absent for doxorubicin, supporting selectivity toward ferroptosis. Lipid peroxidation is a hallmark of ferroptosis; therefore, we assessed the extent of lipid peroxidation and cytosolic ROS using BODIPY 581/591 C11 (BODIPY-C11) and 2′,7′-dichlorodihydrofluorescein diacetate (DCF) as convenient proxies, followed later by lipidomic analysis (see below). Resistance to ferroptosis correlated with suppression of BODIPY-C11 oxidation. Gch1, Ms4a15, and Olfr367 ps overexpression virtually abolished oxidation of both the BODIPY-C11 and DCF sensors (Figure S1C, bottom). Thus, these genes function as novel and robust regulators of ferroptosis.
GCH1 Expression and Its Downstream Metabolites Determine Ferroptosis Resistance
Due to its shared presence under three screening conditions and robust protection, we focused our investigation on the role of Gch1 in ferroptosis. Pooled Gch1-overexpressing MF cells (Gch1 OE) show a 6-fold increase in mRNA levels and were assayed in concentration-dependent survival against RSL3 challenge (Figure 1B). In agreement with the screening data, elevated Gch1 expression rescued cells from up to 2 μM RSL3 treatment. We observed a comparable result in the ferroptosis-sensitive human fibrosarcoma cell line HT-1080 overexpressing a GCH1-IRES-Puro construct (GCH1 OE), resulting in protection from RSL3 lethality (Figure 1C). Increased sensitivity to ferroptotic challenge was correspondingly observed upon stable CRISPRi-mediated33Gch1 knockdown (Gch1 KD) in MF cells (Figure S1D).
To ascertain whether Gch1 is selectively relevant for ferroptosis or generally protective against cell death modalities, we assayed lethal agents that work through diverse mechanisms. MF Gch1 OE cells were challenged with inducers of ferroptosis (IKE, Gpx4 deletion), extrinsic apoptosis (TNFα), intrinsic apoptosis (doxorubicin), or necroptosis (lipopolysaccharide + zVAD). Gpx4 ablation and IKE treatment resulted in complete viability loss in control cells, while Gch1 OE rescued Gpx4 ablation-induced death to >90%. Upregulation of Gch1 was incapable of protecting cells against inducers of apoptosis and only marginally effective against necroptosis, whereas zVAD and necrostatin-1 (Nec-1), respectively, potently inhibited these forms of cell death (Figure 2A, left panel). In line with this, human GCH1 OE HT-1080 cells were resistant to IKE-induced ferroptosis, but not the apoptosis-inducers etoposide and colchicine (Figure 2A, right panel). We therefore infer that Gch1 overexpression selectively counters ferroptotic cell death.
Figure 2.

Gch1 overexpression and its downstream metabolites BH4/BH2 rescue from ferroptosis. (A) Survival of MF-dCas9-Gch1 (Gch1 OE) compared to empty vector MF control (control) cells and GCH1-IRES-Puro (GCH1 OE) cells compared to parental HT-1080 cells (parental), respectively, against inducers of cell death: Ferroptosis induced with 2 μM IKE and Gpx4–/– by using 1 μM tamoxifen with 10 μM α-tocopherol (αToc) rescue. Extrinsic apoptosis induced by 20 ng/mL tumor necrosis factor α (TNFα) with 10 μM z-VAD-FMK (zVAD) rescue. Intrinsic apoptosis induced by 20 μM doxorubicin (Doxo), 25 μM etoposide (Etop), and 12.5 μM colchicine (Colch). Necroptosis induced by 1 μg/mL lipopolysaccharide (LPS) cotreatment with 10 μM zVAD with 10 μM necrostatin-1 (Nec-1) rescue. (B) Dose response curves of BH2 and BH4 starting at 200 μM rescuing from ferroptosis in MF control and parental HT-1080 cells induced by 1 μM RSL3, 2 μM IKE, and Gpx4–/– by 1 μM tamoxifen. (C) Effect of BH2 and BH4 on lipid peroxidation induced by 0.3 μM RSL3 induction in MF control and parental HT-1080 cells measured by BODIPY 581/591 C11 stain (BODIPY-C11). A typical FACS histogram of n = 4 technical replicates of three independent repetitions is depicted. (D) Dose-dependent effect of BH4, BH2, and ascorbic acid (asc. acid) addition on BODIPY-C11 oxidation by 2,2′-azobis(2-methylpropionamidine) dihydrochloride (AAPH) in a cell-free system compared to DMSO control. (E) Antioxidative capacity of ferroptosis-relevant substances at equimolar concentration quantified by cell-free 2,2-diphenyl-1-picrylhydrazyl (DPPH) assay. Viability is plotted as mean ± SEM with at least duplicate (A) or n = 4 (B) technical replicates; three independent experiments were performed with similar results. Cell-free assays (D, E) are reported as mean ± SD of n = 3 technical replicates of three independent experiments with similar outcomes.
As GCH1 executes the rate-limiting biosynthesis step of pterins, including BH4, Gch1 upregulation is expected to increase BH4 concentrations. BH4 is a critical cofactor for nitric oxide synthases (NOS enzymes). NOS uncoupling, primarily in vascular endothelium, is a state lacking BH4 that generates superoxide instead of NO and therefore influences cellular redox status.24 We first investigated whether NOS uncoupling affected ferroptotic cell death in MF cells. However, quantitative PCR of Nos1–3 and RNA sequencing revealed practically undetectable levels of enzyme transcripts independent of RSL3 treatment (Figure S2A,B). We confirmed these data by treating MF cells undergoing ferroptosis with diphenyleneiodonium (DPI), an inhibitor of NOS enzymes, and did not observe any protection in either MF control or Gch1 OE cells (Figure S2C). Thus, these results suggest that the role of BH4 as an enzymatic cofactor of NOS enzymes does not affect ferroptosis resistance.
Some antioxidants, such as liproxstatin-1, ferrostatin-1, and vitamin E, can protect against lipid peroxidation. We analyzed whether BH4 could act as a membrane-permeant antioxidant to influence ferroptosis sensitivity. To this end, we tested whether augmenting BH4 levels was sufficient to protect against ferroptosis induced by chemical induction (RSL3 and IKE) or Gpx4 ablation. BH4 supplementation in the culture medium prevented ferroptosis in a dose-dependent manner in MF cells induced by either stimulus (Figure 2B, top left). EC50 values of BH4 were 18 μM for RSL3, 26 μM for IKE, and 43 μM for Gpx4–/– MF cells. A similar protective effect was seen in HT-1080 cells with an EC50 of 21 μM for RSL3 and 69 μM for IKE (Figure 2B, bottom left). Independent treatment with BH2 (7,8-dihydro-l-biopterin), a partially oxidized derivative of BH4, augmented survival in a comparable fashion in both cell lines (Figure 2B, right panels). BH2 EC50 values were 9 μM for RSL3, 16 μM for IKE, and 10 μM for Gpx4–/– in MF cells, and 59 μM for RSL3 and 15 μM for IKE in HT-1080 cells. Both compounds are reported to be plasma-membrane-permeable.34 Peroxidized membrane phospholipids, consisting predominantly of 20 carbon ω-6 fatty acids, are substrates that drive cells toward ferroptosis. Using BODIPY-C11, we found that BH4/BH2 supplementation at 50 μM eliminated lipid peroxidation in RSL3-induced MF as well as HT-1080 cells (Figure 2C). We investigated the antioxidant characteristics of BH4/BH2 directly on cell-free oxidizable BODIPY-C11 treated with free-radical-producing 2,2′-azobis(2-methyl-propanimidamide) dihydrochloride (AAPH) and observed a dose-dependent decrease in oxidative fluorescence (Figure 2D) for BH4, BH2, and ascorbic acid. BH4 has been reported to have antioxidant scavenging activity. We therefore examined its reducing potential via cell-free 2,2-diphenyl-1-picrylhydrazyl (DPPH) assay. At equimolar concentrations, BH4 has, together with ascorbic acid and α-tocopherol, the highest hydrogen-donating capacity compared to other ferroptosis inhibitors (Figure 2E). In total, these results show that the BH4/BH2 metabolites are potent antioxidants that strongly protect against ferroptotic cell death.
GCH1 Overexpression Does Not Affect Known Ferroptosis Regulators or the Glutathione System
We interrogated MF Gch1 OE cell lysates by protein mass spectrometry to determine if GCH1 overexpression would alter levels of known ferroptosis-related proteins (ferroptosis KEGG pathway).2 Only one protein, the iron-carrier ceruloplasmin (CP), was counter-regulated with GCH1 and showed reduced levels in overexpressing cells, while 32 further ferroptosis-related proteins were not substantially altered in Gch1 OE cells (Figure 3A and Figure S3A).
Figure 3.

Gch1 overexpression enhances folate pathway derivatives but does not affect known ferroptosis regulators. (A) Protein levels by heat map of known ferroptosis regulators upon 0.3 μM RSL3 treatment for 3 h in Gch1-overexpressing MF cells (Gch1 OE) compared to control cells (control). Data were average of n = 4 or 5 independent biological replicates per condition. (B) Partial least-squares discriminant analysis of Gch1 OE cells compared to control and volcano plot of whole-cell-shotgun metabolomics analysis. (C) Upregulated metabolic precursors of BH4 and BH2 in KEGG pathway of GCH1 in Gch1 OE cells compared to control (n = 5 independent biological replicates).
Additionally, we analyzed glutathione, which is consumed during detoxification of lipid peroxides by the enzyme GPX4. To explore whether GCH1/BH4/BH2 has an effect on glutathione levels, we used the indicator dibromobimane, an indicator of free thiols (Figure S3B). Upon Gch1 overexpression, only a slight increase in free thiols/glutathione levels could be detected after l-buthionine-(S,R)-sulfoximine (BSO) treatment, while all other conditions including BH4 supplementation were unchanged. This is in accordance with screening data following Gpx4 ablation, where glutathione is likely not consumed resolving lipid peroxides, and Gch1 OE still was able to fully protect from ferroptosis (Figure 1 and Figure S1). Hence, these data rule out a protective effect of GCH1 via the glutathione system.
Together, these data suggest an independent mechanism of ferroptosis protection by GCH1 relative to the known ferroptosis pathway proteins or the glutathione system.
GCH1 Overexpression Enhances the BH4/BH2 Folate Biosynthesis Pathway
We next investigated the consequences of Gch1 overexpression to the global cellular pool of metabolites by untargeted direct injection ESI-FT/ICR-MS metabolomics, a highly sensitive ultra-high-resolution semiquantitative method that allows rapid and global profiling of metabolites, with the limitations that isobaric compounds cannot be discriminated. The whole-cell shotgun metabolite analysis delivered 1196 metabolites (Table S2), for which a global analysis using unsupervised techniques like hierarchical clustering and principal component analysis delivered very comparable metabolome profiles. We also applied supervised learning (partial least-squares discriminative analysis) and identified a distinct separation of control and Gch1-overexpressing cells within the first component (Figure 3B, left) caused by a robust increase in GCH1-derived pteridines from the folate biosynthesis pathway, most predominantly BH2 (Figure 3B, right, and Figure 3C). 6-Hydroxymethyl-7,8-dihydropterin and 6-pyruvoyltetrahydropterin/sepiapterin with identical mass were also found to be increased (Figure 3C). We validated the effect of electrospray ionization and of cell lysis to the redox hemostasis of BH4 and BH2. We observed the formation of BH2, the oxidation product of BH4, over time (Figure S4A,B,D). After global screening, we developed a targeted UPLC-ToF-MS method for validation of the presence and identification of BH4 and BH2, separately (Figure S4C). Protein mass spectrometry in addition revealed a 5-fold increase in GCH1 protein in MF Gch1 OE cells (Figure 3A and Figure S3A), demonstrating a stoichiometric relationship of metabolites to the rate-limiting enzyme GCH1.
Together, these data demonstrate that, as a consequence of increased cellular GCH1 levels, downstream products in the folate network, primarily the metabolites BH4/BH2, are selectively and strongly elevated, and they can act to suppress lipid peroxidation and ferroptotic cell death.
Untargeted Lipidomics Study Reveals that GCH1 Overexpression Selectively Protects Some PUFA-Phospholipids from Degradation
To investigate how GCH1 overexpression affects lipid composition and metabolism, we performed an untargeted mass-spectrometry-based lipidomics analysis on GCH1-overexpressing (GCH1 OE) and parental HT-1080 cells treated with either 10 μM IKE or DMSO for 24 h. Unsupervised principal component analysis (PCA score plot) of extracted lipid features showed clear separation and tight clustering among the groups in both positive and negative electrospray ionization modes (Figure S5A,B).
The relative abundances of several lipid species were altered significantly (one-way ANOVA; FDR-corrected p-value <0.05) in response to IKE treatment in both groups, as expected (Table S3). We identified significant increases in the level of lysophosphatidylcholines (LysoPCs) and lysophosphatidylethanolamines (LysoPEs) and depletion of phospholipids mainly containing polyunsaturated fatty acyl (PUFA) chains, upon IKE treatment in both the parental and GCH1 OE cells (Figure 4A). The accumulation of lysophospholipids, which are generated via a degradation reaction by enzymatic cleavage of the oxidized PUFA tail, has been reported upon treatment with ferroptosis inducers.35 Degradation of phospholipids containing arachidonic acid (e.g., PE 18:0_20:4), adrenic acid (e.g., PE 18:0_22:4), and docosahexaenoic acid (e.g., PC 18:0_22:6) was reported as a result of ferroptotic cell death.3,35−37
Figure 4.

Untargeted lipidomics reveals GCH1 overexpression cells protect from ferroptotic degradation of specific lipids. Heat map (one-way ANOVA; FDR-corrected p-value <0.05) showing changes in phospholipid profile (A), and glycerolipid, sphingolipid, and free fatty acid profiles (B) of DMSO or 10 μM IKE treated GCH1-overexpressing (GCH1 OE) and parental HT-1080 cells. Each row represents Z-scored-normalized intensities of the differentiated lipid species. Each column represents the mean of n = 2 technical replicates of n = 5 independent biological replicates. The relative abundance of lipid is color-coded from red indicating high signal intensity to dark blue indicating low intensity and clustered using Pearson correlations. Abbreviations: PC, phosphatidylcholine; PE, phosphatidyl-ethanolamine; PI, phosphatidylinositol; PG, phosphatidylglycerol; LPC, lysoPC; LPE, LysoPE; PE P-, plasmalogen PE; PC/PE -O, ether-linked PE/PC; TAG, triacylglycerol; DAG, diacylglycerol; FA, fatty acid; CE, cholesterylester; CoQ10, coenzyme Q10; Cer, ceramide; HexCer, monohexosyl-Cer. (C) Line structure of representative phospholipids PC 18:0_20:4 with one saturated acyl chain and one polyunsaturated fatty acyl (PUFA) chain, as well as PC 20:4_20:4 with two PUFA chains. (D) Treatment of parental and GCH1 OE HT-1080 cells with 4-nitrobenzoate in the absence of CoQ10 with ferroptosis induction by 8 μM IKE. Viability is plotted as biological replicates ± SEM n = 3. (E) Treatment of parental and GCH1 OE HT-1080 cells with exogenous PC 20:4_20:4, 18:0_20:4, 18:0_22:6, and PG 22:6_22:6 (concentrations 0–50 μM). Viability is plotted as mean ± SEM of n = 4 replicates.
Triacylglycerols (TAGs) and diacylglycerols (DAGs), mostly found in lipid droplets, were also depleted upon IKE treatment in both the parental and GCH1 OE cells (Figure 4B). Consistent with previous studies in cancer cell models, the TAGs that were depleted upon ferroptosis induction mostly contained PUFA tails.37,38 These changes in the lipid profile in both the parental and GCH1 OE cell lines surprisingly indicated sensitivity to ferroptotic degradation of lipids, even in GCH1 OE cells that are protected from dying. Thus, these results suggest that GCH1 overexpression, unlike GPX4, does not protect all PUFA–PLs from oxidative degradation but instead selectively prevents the oxidative degradation of specific PUFA–PLs that drive the execution of cell death during ferroptosis. This provided us with a unique opportunity to analyze the specific lipid peroxides that drive ferroptosis.
Intriguingly, we found that GCH1 OE cells selectively protected only an unusual and little-studied class of phosphatidylcholines with two PUFA chains, including PC 20:4_20:4, PC 20:4_20:5, and PC 20:4_22:6 from degradation upon IKE treatment (Figure 4A,C,E, and Figure S5D). Validating this result, we found that exogenous PC 20:4_20:4 or PG 22:6_22:6 treatment in the parental HT-1080 cells resulted in a greater sensitivity to IKE compared to the GCH1 OE cells (Figure 4C,E).
In contrast, depletion of the more common PCs with one PUFA tail and one saturated/monounsaturated fatty acyl chain after IKE treatment was observed even in the protected GCH1 OE cells, suggesting that degradation of these PC lipids does not specifically drive cell death (Figure 4A and Figure S5C). We also observed that single PUFA-containing phospholipids resulted in toxicity to the parental cells in a dose-dependent manner (Figure 4E). The greater the number of bis-allylic sites, the more toxic the phospholipids were, likely due to their increased susceptibility to peroxidation. The GCH1 OE cells were able to selectively protect the cells from phospholipids that had two PUFA tails. One-tail-PUFA containing lipids were less toxic to parental as well as GCH1 OE cells (Figure 4E).
In addition, the lipid profile of the GCH1 OE cells also showed a significant enrichment in reduced coenzyme Q10 (CoQ10) levels after IKE treatment (Figure 4B and Figure S5E). This elevation of CoQ10 levels could be the result of the increased BH4 in the cells, converting phenylalanine into tyrosine which can be further converted to 4-OH-benzoate, a precursor to CoQ10. Under the oxidative stress induced by IKE treatment, the GCH1 OE cells could be driving reduced CoQ10 biosynthesis, possibly also contributing to the protection of these from ferroptotic death. We observed that, when treated with 4-nitrobenzoate, an inhibitor of CoQ10 biosynthesis, in CoQ10-depleted medium, GCH1 OE cells were sensitized to IKE treatment, indicating that CoQ10 can also play a role in the protection of these cells from ferroptosis (Figure 4D and Figure S5C).
GCH1 Expression Level Determines Cancer Cell Resistance to Ferroptosis
Elevated GCH1 has been associated with increased tumorigenesis28 and reduced survival in breast cancer patients.39 In light of BH4/BH2-dependent protection, we examined if GCH1 determines ferroptosis sensitivity in cancer cell lines. We profiled 38 etiologically diverse cancer cell lines for RSL3 resistance, thereby benchmarking ferroptotic cell death IC50 for this substance in a dynamic concentration range still rescued by ferrostatin-1. Next, we classified these lines into categories “sensitive” or “resistant” by evaluating their specific lethality (IC50) in RSL3-mediated ferroptosis: sensitive lines were lethal at doses <2 μM, while resistant lines remained vital at doses ≥2 μM (Figure 5A and Figure S6A). Further categorization by tissue of origin revealed a striking sensitivity of blood-derived tumors and widespread insensitivity in breast and colon tumors (Figure 5B and Figure S6A).
Figure 5.

GCH1 expression level determines cancer cell resistance to ferroptosis. (A) Color scaled profiling of 38 cancer cell lines according to RSL3 sensitivity based on their respective IC50. (B) IC50 values of 38 cancer cell lines against RSL3, grouped by tissue of origin. (C) GCH1 mRNA levels of seven representative cancer cell lines upon RSL3 treatment compared to DMSO. (D) Synthetic lethality induced by 1 mM DAHP and 0.3 μM RSL3 treatment in PC-3, SH-SY5Y, 293T, and HCT 116 cells with 10 μM αToc rescue. Protein levels of GCHFR compared to β-actin in these cell lines shown by Western blot. (E) GCH1 mRNA levels and viability upon ferroptosis induction in HT-1080, 293T, and SH-SY5Y CRISPRi knockdown (GCH1 KD) in two clonal cell lines each compared to respective empty vector control line (ctrl) with 10 μM αToc rescue. (F) GCH1 mRNA levels and viability upon RSL3 treatment in 786-O and Caki-1 GCH1 siRNA knockdown cells (siGCH1) compared to control siRNA (siCtrl) with 2 μM ferrostatin-1 (Fer-1) rescue. Viability is reported as mean ± SEM of n = 3 (D, E) or n = 2 (F) technical replicates. Relative mRNA expression is shown as mean ± SD of n = 3 technical replicates.
GCH1 expression is directly correlated to BH4 levels.40 Examination of GCH1 mRNA levels after RSL3 induction from lines across the ferroptosis sensitivity range showed a linear relationship to ferroptosis resistance (Figure 5A,C). We additionally observed that GCH1 transcripts were downregulated following RSL3 stimulation in more sensitive cell lines (Figure 5C). In contrast, resistant cell lines did not substantially change GCH1 mRNA levels over 6 h of treatment (Figure 5C); this suggests that GCH1 mRNA can serve as a ferroptosis pharmacodynamic marker in ferroptosis-sensitive cells.
Next, to determine if cancer line resistance to ferroptosis could be attenuated via GCH1 activity modulation, we tested 2,4-diamino-6-hydroxypyrimidine (DAHP) in combination with RSL3. DAHP activates GCHFR, which then binds and inhibits GCH1. We tested cell lines with high (SH-SY5Y), low (PC-3 and 293T), and undetectable (HCT 116) levels of GCHFR (Figure 5D). Synthetic lethality was observed in cases where GCHFR was present (SH-SY5Y, PC-3, and 293T cells) but was absent in HCT 116 cells lacking GCHFR (Figure 5D). The level of lethality induced by RSL3/DAHP correlated to the level of the DAHP target, i.e., GCHFR. Consistent with this observation, CRISPRi-mediated knockdown of GCH1 (GCH1 KD) in the cell lines HT-1080, 293T, and SH-SY5Y significantly increased susceptibility of these lines to inducers of ferroptotic cell death (Figure 5E and Figure S6B). Supplementation of either 100 μM BH4 or BH2 was sufficient to rescue GCH1 KD viability completely (Figure S6B). Also, already sensitive renal cell lines 786-O and Caki-1 could be further sensitized to ferroptosis upon siRNA-mediated GCH1 knockdown (siGCH1) (Figure 5F).
We further hypothesized that increased GCH1 enzymatic activity might have paracrine effects in cellular communities, as sensitivity to ferroptosis has been shown to have non-cell-autonomous aspects in previous studies.22,34,41 Thus, we grew SH-SY5Y control donor cells with very high GCH1 expression as well as GCH1 knockdown (GCH1 KD) donor SH-SY5Y cells (Figure 5D,E) at different densities and transferred their supernatants to recipient HT-1080 cells simultaneously challenged with IKE. Conditioned medium from high-GCH1-expressing SH-SY5Y control cells showed higher levels of BH4 (Figure S7B) and was able to dose-dependently protect from ferroptosis, pointing to the potential of membrane-permeable BH4 to protect neighboring cells in the microenvironment (Figure S7A).
Together, these data point to GCH1 expression and activity as a critical determinant of sensitivity to ferroptosis and that inhibition of GCH1 activity can sensitize resistant cancer cells to ferroptosis induction.
Higher GCH1 Levels Correlate to Ferroptosis Resistance in 3D Cultures
A direct correlation between GCH1 and cancer progression has been described.27−29 We evaluated whether the GCH1/BH4/BH2 axis impacts ferroptosis sensitivity in a relevant oncogenic model. For this, we used the human HT-1080-GCH1-IRES-Puro (GCH1 OE) line overexpressing GCH1, shown to be resistant to 1 μM IKE compared to parental HT-1080 cells (Figures 2B and 6A). Metabolomic evaluation of these cells by LC-MS/MS measurements confirmed a robust increase in BH4/BH2 pools (Figure 6B). We then used three-dimensional spheroid culture conditions. Notably, spheroids from GCH1 OE HT-1080 were smaller in size but more compact, illuminated by stronger Hoechst staining. This indicates that GCH1 overexpression leads to formation of denser three-dimensional structures. This finding indicates a likely more ferroptosis-protective environment in GCH1 OE-derived spheroids due to their compact nature. Indeed, analysis of replicate experiments reproducibly showed complete loss of viability upon IKE treatment in parental HT-1080 spheroids, while substantial protection was observed in HT-1080 GCH1 OE-derived spheroids (Figure 6C). This demonstrates that higher GCH1 expression protects from ferroptosis also in a 3D spheroid environment.
Figure 6.

GCH1 expression increases resistance to ferroptosis in 3D spheroids, and human patient transcriptomics and pathology reveal coordinated GCH1 levels and ferroptosis sensitivity. (A) Data from Figure 2A showing survival of HT-1080 GCH1-overexpressing (GCH1 OE) cells against IKE-induced ferroptosis compared to parental cells (parental) with 10 μM αToc rescue. (B) BH4 and BH2 levels in HT-1080 GCH1 OE cells compared to parental cells of n = 6 biological replicates each. (C) Three-dimensional spheroid culture of GCH1 OE cells compared to parental cells and treatment with IKE. Three spheroids per condition were investigated. Scale bar = 100 μM. (D) GCH1 mRNA expression in tumor samples compared to healthy para-tumor tissue in breast and kidney cancers. BRCA, p = 2.39 × 10⁻¹⁷; KICH, p = 0.02; KIRC, p = 7.54 × 10⁻²⁷; p = KIRP, 10.7 × 10⁻²⁵. (E) GCH1 protein expression in breast and renal cancer tissue (Human Protein Atlas). (F) GCH1 mRNA and viability upon RSL3 treatment in kidney and breast cancer cell lines compared to HT-1080 cells. Viability is shown as mean ± SEM of n = 2 replicates of three independent repetitions of the experiment with similar outcomes. # means non detectable.
Human Patient Transcriptomics and Pathology Reveal Coordinated GCH1 Levels and Ferroptosis Sensitivity
To explore the relevance of GCH1-mediated ferroptosis resistance in clinical oncology we profiled RNaseq data from 6187 primary tumor biopsies from The Cancer Genome Atlas.42 Patient samples from lung (LUAD), liver (LIHC), cervical (CESC), and colon (COAD) cancers showed particularly elevated GCH1 levels (Figure S8), consistent with current and previously published data that breast, lung, and colon cancers are more resistant to ferroptosis9 (Figure 5A,B). A mean difference in expression of ∼16-fold was observed among all cancer types, substantially more than the 6-fold greater Gch1 expression imparting complete protection in MF cells (Figures 1B and 2A).
Particularly striking are tumors of glioblastoma origin. Low-grade glioma (LGG) and glioblastoma multiforme (GBM) display dramatically reduced levels, approximately 8-fold less than colon tumors, and were the lowest of all cancer samples tested. This is consistent with pronounced sensitivity of the glioblastoma cell line U-138 MG to ferroptotic induction (Figure 5A).
Interestingly, tumors from breast cancer (BRCA) display significantly higher GCH1 RNA expression compared to adjacent untransformed tissue (Figure 6D). In contrast, kidney cancers express significantly less GCH1 than normal kidney tissue. These results demonstrate significant alterations in GCH1 RNA expression between the tumor and the corresponding normal tissue. We also analyzed pathology samples from the Human Protein Atlas43 for breast and kidney tumors and witnessed a marked difference between tissues with high GCH1 protein expression in breast cancer and almost no GCH1 protein in kidney sections (Figure 6E). Moreover, several breast cancer tumors appear to have condensed regions of high expression, which suggests consequences for a tumor microenvironment as observed in conditioned medium transfer experiments from SH-SY5Y to HT-1080 cells (Figure S7). In light of distinct expression differences in breast and kidney cells, we interrogated additional kidney (786-O, A-498, Caki-1) and breast-cancer-derived cell lines (AU565, DU4475, MCF-7). Strikingly, we observed tissue-dependent susceptibility to RSL3 treatment that correlated to the GCH1 RNA expression level of each cell line (Figure 6F).
Together, the data show a correlation of tissue of origin GCH1 levels with ferroptosis susceptibility, thereby introducing GCH1/BH4/BH2 as potential biomarkers for patient stratification in ferroptotic cancer treatment of distinct cancer types.
Discussion
In this study, we found for the first time that the potent, endogenously produced antioxidants BH4/BH2 generated by the enzyme GCH1 can protect against ferroptosis in a GPX4-independent manner. Gch1 was identified in a screen alongside several other genes (Ms4a15, Rpp25, Olfr367 ps, L2hgdh, Slco1a6, Olfr39) that protect robustly against the three ferroptosis inducers RSL3, IKE, and Gpx4 deletion in individual overexpressing lines. During validation studies, other identified genes either showed lesser ferroptotic protection or protected only against individual stimuli. Reasons for these disparities may include gene silencing over time, selection against high expression, and mechanistic differences in protection. Accordingly, validation by clonal selection, as opposed to pooled lines used in this study, may yield singular, robustly protective lines. Strikingly, GCH1 overexpression during screening and validation phases was highly consistent and demonstrates the power of CRISPRa to discover potent novel regulators of ferroptosis. It is nevertheless noteworthy that other protein components of the folate biosynthesis pathway were not identified in the screen, as they do not influence the rate-limiting step of BH4 synthesis.
The breadth of factors identified in the whole genome screen is testament to the power of unbiased, genome-wide CRISPR activation. Two new reports published in parallel to this study revealed only a single ferroptosis-protective gene, AIFM2/FSP1, resulting from synthetic lethal and cDNA overexpression screens.44,45 Notably, there are technical differences between the screens that account for the distinct outcomes. Sensitization knockout screens are likely to lack the dynamics of CRISPR overexpression screens, while cDNA libraries are rarely exhaustive; therefore, fewer genes were found in both recently published reports. On the other hand, AIFM2/FSP1 was not identified in our screen. Reasons for this may be (i) that the guides for AIFM2/FSP1 within the pooled library were insufficient for robust activation, (ii) that it may be mutated or silenced in the cells we studied, or (iii) that its guides may be underrepresented in the library, possibly because (iv) AIFM2/FSP1 is toxic or unfavorable for cells to express highly/constitutively.
Reactive oxygen species (ROS) are known to play an integral role in the development and pathological progression of cancer. Aberrant cellular division coupled with metabolic alterations shift the balance toward an increasingly ROS-driven environment.13 Therefore, cells have established antioxidant mechanisms to counter ROS levels.46 In this report, we have shown that GCH1 expression elicits production of the potent antioxidants BH4/BH2, which when administered or produced endogenously can block lipid peroxidation and ferroptotic cell death. With an antioxidant capacity comparable to or stronger than liproxstatin-1, ferrostatin-1, and vitamin E, these potent metabolites can likely diffuse through membranes to neutralize reactive oxidative centers. Others have observed that radiation-induced skin damage generates free radicals, which are compensated by GCH1, NRF2, and BH4.47 Oxidative balance in macrophages is determined by GCH1,48 and cardiac fibrosis and atrophy are reduced by supplemented BH4.24 Together, this suggests that GCH1/BH4/BH2 can act as a counterbalance to ROS load in cancer cells. Indeed, potent antioxidants decrease survival in mouse models and human cancer.49
GCH1 dictates levels of BH4, and the presence of BH4 leverages sensitivity to ferroptosis, emphasizing a direct correlation between the GCH1/BH4 axis and ferroptosis inhibition. Proteins previously described to regulate ferroptotic signals as well as glutathione levels were not affected by GCH1 overexpression (Figure 3A and Figure S3) implying that the antiferroptotic effect by GCH1/BH4 is distinct from the previously described ferroptosis regulation pathways. Moreover, involvement of the glutathione antioxidant system is not necessary for survival. This is underscored by striking protection by Gch1 overexpression in Gpx4 knockout cells. Hence, GCH1 protects from ferroptotic cell death primarily through the antioxidant effect of BH4/BH2 and is entirely independent from GPX4-mediated ferroptosis protection.
Besides its robust antioxidant effect, the role of BH4 as an enzymatic cofactor cannot definitively be ruled out by these studies. BH4 interacts with iron in the catalytic core of several enzymes and binds directly to facilitate intermediate formation.16 Of these, the most likely candidates to influence ferroptosis are the NOS enzymes, which were not substantially expressed or altered by NOS inhibitor addition (Figure S2). A possible role for lipid modulation exists via the BH4-dependent enzyme AGMO; whether this occurs in human patients is unclear.50 Protecting mitochondrial damage by antioxidants has been shown to increase mitochondrial metabolism, which may consume ferroptosis-sensitive fatty acids.51
An untargeted mass-spectrometry-based lipidomics analysis revealed that GCH1 overexpression resulted in significant alterations in the lipid profiles upon IKE treatment. Interestingly, GCH1 overexpression selectively protected PCs with two PUFA tails, which was confirmed through the addition of exogenous PCs to cells treated with IKE, resulting in increased sensitivity only in parental HT-1080 cells. GCH1-overexpressing HT-1080 cells (GCH1 OE) along with a parental line showed ferroptotic lipid signatures upon treatment of cells with IKE.36−38 This suggests that GCH1 overexpression and the presence of high BH4 may not be enough to counter the oxidative degradation of several classes of lipids, including PUFA-containing TAGs and PLs. However, a small class of phospholipids are protected from oxidative damage in the GCH1 OE HT-1080 cells, indicating that the fate of these phospholipids is predictive of the survival of the cell. GCH1 OE HT-1080 cells were able to protect from basal toxicity resulting from lipid peroxation of PUFA more in the two-tailed PUFA PCs compared to the toxicity induced from the single-tailed PUFAs (Figure 4E). This suggests that the protection of these phospholipids from oxidative degradation is selective and can protect the cells from ferroptosis. We also observed a significant increase in reduced CoQ10 (an antioxidant) in GCH1 OE cells after IKE treatment, which could be the result of a high production of the CoQ10 biosynthetic precursor 4-OH-benzoate. 4-OH-benzoate production is dependent on the BH4-mediated conversion of phenylalanine to tyrosine, and both metabolites are upregulated (data not shown). These results suggest that, under oxidative stress, cells that have high BH4 levels can synthesize CoQ10 to alleviate oxidative damage. CoQ10 was reported to be a critical second mechanism for ferroptosis protection.44,45 Blocking de novo CoQ10 synthesis after depleting CoQ10 from the medium leads to sensitization of the GCH1 OE HT-1080 cells to IKE treatment. This result suggests that the BH4 can be used as a direct antioxidant to protect cells from lipid peroxidation or can be used for de novo synthesis of CoQ10, which can also protect cells from ferroptosis. Apart from DAHP inhibition of enzymatic activity, this mechanism is unique in resensitizing GCH1 OE cells to IKE treatment, and thus, the ability to synthesize de novo CoQ10 may play a critical role in the protection of the cells from ferroptosis.
BH4 can be secreted from cells.34 Therefore, we compared survival of IKE-treated HT-1080 cells in conditioned medium from SH-SY5Y donor cells having high levels of GCH1 and observed a robust, donor-cell-number-dependent increase in survival of HT-1080 recipient cells (Figure S7). This implies that secreted BH4/BH2 or associated metabolites can help protecting neighboring cells from ferroptosis in a tumor microenvironment. This is of particular importance as few GCH1-overexpressing cells in a tumor may protect larger regions of the tumor from ferroptosis. In fact, sections from human breast cancer patients are suggestive of this phenomenon as not all cells within the tumor are expressing GCH1 at high levels but show individual collections of GCH1 high-expressing cells (Figure 6E). Here, the high-expressing cells may conceivably protect the whole tumor from ferroptosis.
Our analysis of mRNA expression patterns of cancer patients pinpoint glioblastoma with prominently low GCH1 expression levels, suggesting that these may be more susceptible to ferroptosis. In agreement with this, the tested cell line U-138 MG is markedly sensitive to RSL3. More profoundly, GCH1 determined glioblastoma tumor initiating capacity and patient survival in a clinically relevant study.27 This is particularly relevant in light of clinical supplementation of BH4 in patients with phenylalanine hydroxylase deficiency. Whether GCH1 contributes in oncology to a speculative intrinsic in vivo ferroptosis mechanism is likely to be a subject of future interest.
Messenger RNA levels of GCH1 correlate with the susceptibility to ferroptotic cell death (Figure 5C). Importantly, breast and kidney cells represent examples of cancers where tumor tissues differentially express GCH1 when compared to their normal tissues. More precisely, breast cancer cells show elevated GCH1 protein in tumors, while kidney cells display reduced GCH1. In agreement, they are highly resistant and sensitive to ferroptosis, respectively. GCH1 has been reported to be associated with breast cancer incidence, progression, and survival times.28 Hence, the GCH1/BH4 axis may serve as a prognosticator of ferroptosis sensitivity and stratify patients for ferroptosis treatment in susceptible cancer cells. Certainly, whether intrinsic or exogenous, such hallmark antioxidants in tumors and under pathological conditions may serve as definitive clinical features for modulating cell survival in vivo.
Acknowledgments
We thank Lewis Brown for providing access to instrumentation for lipidomics experiments. Lenti dCAS-VP64_Blast was a gift from Feng Zhang. Lenti MS2-P65-HSF1_Hygro was a gift from Feng Zhang. Mouse CRISPR 3-plasmid activation pooled library (SAM) was a gift from Feng Zhang. Lenti sgRNA(MS2)_zeo backbone was a gift from Feng Zhang. pLV hU6-sgRNA hUbC-dCas9-KRAB-T2a-Puro was a gift from Charles Gersbach. pHCMV-EcoEnv was a gift from Miguel Sena-Esteves. pRSV-Rev was a gift from Didier Trono. pMDLg/pRRE was a gift from Didier Trono. We thank Prof. Daniel Krappmann, Prof. Martin Göttlicher, Prof. Brent Cochran, and the Institute of Cancer Genetics Columbia University for gifting cell lines (for details please see Supporting Methods). The results shown in Figure 6D and Figure S8 are in whole or part based upon data generated by the TCGA Research Network: https://www.cancer.gov/tcga. This work was supported by HelmholtzZentrum Muenchen GmbH (K.H. and J.A.S.); this research was supported by grants to B.R.S. from the National Cancer Institute (R35CA209896 and P01CA087497) and National Institute for Neurological Disorders and Stroke (1R61NS109407).
Supporting Information Available
The Supporting Information is available free of charge at https://pubs.acs.org/doi/10.1021/acscentsci.9b01063.
Additional data and figures including CRISPRa screening results, nitric oxide synthase data, GCH1 overexpression data, oxidation of BH4 into BH2 and identification of enhanced presence of BH4, lipidomic analysis, extrinsic effect, and human patient GCH1 levels (PDF)
Table S1: overexpression screen results (XLS)
Table S2: ESI-FT data (XLS)
Table S3: significant lipids (XLSX)
Author Contributions
◆ V.A.N.K., C.T.B., and S.P. contributed equally to this work. Study initiation, K.H. and J.A.S.; conceptualization, B.R.S., K.H., and J.A.S.; methodology, V.A.N.K., C.T.B., S.P., L.R., C.M., F.Z., J.M.-P., X.B., N.A., J.K., S.B., J.D.D., B.R.S., K.H., and J.A.S.; investigation, V.A.N.K., C.T.B., S.P., L.R., C.M., F.Z., J.M.-P., X.B., N.A., J.K., S.B., and J.D.D.; data analysis, V.A.N.K., C.T.B., S.P., L.R., C.M., F.Z., J.M.-P., X.B., N.A., J.D.D., P.S.-K., S.M.H., B.R.S., K.H., and J.A.S.; writing, original draft, V.A.N.K., K.H., and J.A.S.; writing, review and editing, V.A.N.K., C.T.B., B.R.S., K.H., and J.A.S.; funding acquisition, B.R.S., K.H., and J.A.S.; resources: V.A.N.K., C.T.B., S.P., L.R., J.K., S.B., J.D.D., B.R.S., K.H., and J.A.S.; supervision, P.S.-K., S.M.H., B.R.S., K.H., and J.A.S.
The authors declare the following competing financial interest(s): B.R.S. holds equity in and consults with Inzen Therapeutics and is an inventor on patents and patent applications related to IKE and ferroptosis. J.A.S. holds patents related to ferroptosis. The other authors declare no competing interests.
Supplementary Material
References
- Dixon S. J.; Lemberg K. M.; Lamprecht M. R.; Skouta R.; Zaitsev E. M.; Gleason C. E.; Patel D. N.; Bauer A. J.; Cantley A. M.; Yang W. S.; et al. Ferroptosis: an iron-dependent form of nonapoptotic cell death. Cell 2012, 149 (5), 1060. 10.1016/j.cell.2012.03.042. [DOI] [PMC free article] [PubMed] [Google Scholar]
- Stockwell B. R.; Friedmann Angeli J. P.; Bayir H.; Bush A. I.; Conrad M.; Dixon S. J.; Fulda S.; Gascon S.; Hatzios S. K.; Kagan V. E.; et al. Ferroptosis: A Regulated Cell Death Nexus Linking Metabolism, Redox Biology, and Disease. Cell 2017, 171 (2), 273. 10.1016/j.cell.2017.09.021. [DOI] [PMC free article] [PubMed] [Google Scholar]
- Yang W. S.; Stockwell B. R. Ferroptosis: Death by Lipid Peroxidation. Trends Cell Biol. 2016, 26 (3), 165. 10.1016/j.tcb.2015.10.014. [DOI] [PMC free article] [PubMed] [Google Scholar]
- Conrad M.; Kagan V. E.; Bayir H.; Pagnussat G. C.; Head B.; Traber M. G.; Stockwell B. R. Regulation of lipid peroxidation and ferroptosis in diverse species. Genes Dev. 2018, 32 (9–10), 602. 10.1101/gad.314674.118. [DOI] [PMC free article] [PubMed] [Google Scholar]
- Maiorino M.; Conrad M.; Ursini F. GPx4, Lipid Peroxidation, and Cell Death: Discoveries, Rediscoveries, and Open Issues. Antioxid. Redox Signaling 2018, 29 (1), 61. 10.1089/ars.2017.7115. [DOI] [PubMed] [Google Scholar]
- Xie Y.; Hou W.; Song X.; Yu Y.; Huang J.; Sun X.; Kang R.; Tang D. Ferroptosis: process and function. Cell Death Differ. 2016, 23 (3), 369. 10.1038/cdd.2015.158. [DOI] [PMC free article] [PubMed] [Google Scholar]
- Gaschler M. M.; Andia A. A.; Liu H.; Csuka J. M.; Hurlocker B.; Vaiana C. A.; Heindel D. W.; Zuckerman D. S.; Bos P. H.; Reznik E.; et al. FINO2 initiates ferroptosis through GPX4 inactivation and iron oxidation. Nat. Chem. Biol. 2018, 14 (5), 507. 10.1038/s41589-018-0031-6. [DOI] [PMC free article] [PubMed] [Google Scholar]
- Shimada K.; Skouta R.; Kaplan A.; Yang W. S.; Hayano M.; Dixon S. J.; Brown L. M.; Valenzuela C. A.; Wolpaw A. J.; Stockwell B. R. Global survey of cell death mechanisms reveals metabolic regulation of ferroptosis. Nat. Chem. Biol. 2016, 12 (7), 497. 10.1038/nchembio.2079. [DOI] [PMC free article] [PubMed] [Google Scholar]
- Yang W. S.; SriRamaratnam R.; Welsch M. E.; Shimada K.; Skouta R.; Viswanathan V. S.; Cheah J. H.; Clemons P. A.; Shamji A. F.; Clish C. B.; et al. Regulation of ferroptotic cancer cell death by GPX4. Cell 2014, 156 (1–2), 317. 10.1016/j.cell.2013.12.010. [DOI] [PMC free article] [PubMed] [Google Scholar]
- Conrad M.; Friedmann Angeli J. P. Glutathione peroxidase 4 (Gpx4) and ferroptosis: what’s so special about it?. Mol. Cell Oncol 2015, 2 (3), e995047 10.4161/23723556.2014.995047. [DOI] [PMC free article] [PubMed] [Google Scholar]
- Friedmann Angeli J. P.; Schneider M.; Proneth B.; Tyurina Y. Y.; Tyurin V. A.; Hammond V. J.; Herbach N.; Aichler M.; Walch A.; Eggenhofer E.; et al. Inactivation of the ferroptosis regulator Gpx4 triggers acute renal failure in mice. Nat. Cell Biol. 2014, 16 (12), 1180. 10.1038/ncb3064. [DOI] [PMC free article] [PubMed] [Google Scholar]
- Zilka O.; Shah R.; Li B.; Friedmann Angeli J. P.; Griesser M.; Conrad M.; Pratt D. A. On the Mechanism of Cytoprotection by Ferrostatin-1 and Liproxstatin-1 and the Role of Lipid Peroxidation in Ferroptotic Cell Death. ACS Cent. Sci. 2017, 3 (3), 232. 10.1021/acscentsci.7b00028. [DOI] [PMC free article] [PubMed] [Google Scholar]
- Birben E.; Sahiner U. M.; Sackesen C.; Erzurum S.; Kalayci O. Oxidative Stress and Antioxidant Defense. World Allergy Organ. J. 2012, 5 (1), 9. 10.1097/WOX.0b013e3182439613. [DOI] [PMC free article] [PubMed] [Google Scholar]
- Sullivan L. B.; Chandel N. S. Mitochondrial reactive oxygen species and cancer. Cancer Metab 2014, 2, 17. 10.1186/2049-3002-2-17. [DOI] [PMC free article] [PubMed] [Google Scholar]
- Gorrini C.; Harris I. S.; Mak T. W. Modulation of oxidative stress as an anticancer strategy. Nat. Rev. Drug Discovery 2013, 12 (12), 931. 10.1038/nrd4002. [DOI] [PubMed] [Google Scholar]
- Werner E. R.; Blau N.; Thony B. Tetrahydrobiopterin: biochemistry and pathophysiology. Biochem. J. 2011, 438 (3), 397. 10.1042/BJ20110293. [DOI] [PubMed] [Google Scholar]
- Thony B.; Auerbach G.; Blau N. Tetrahydrobiopterin biosynthesis, regeneration and functions. Biochem. J. 2000, 347, 1. 10.1042/bj3470001. [DOI] [PMC free article] [PubMed] [Google Scholar]
- Stuehr D. J.; Griffith O. W. Mammalian nitric oxide synthases. Advances in enzymology and related areas of molecular biology 2006, 65, 287. 10.1002/9780470123119.ch8. [DOI] [PubMed] [Google Scholar]
- Tatham A. L.; Crabtree M. J.; Warrick N.; Cai S.; Alp N. J.; Channon K. M. GTP cyclohydrolase I expression, protein, and activity determine intracellular tetrahydrobiopterin levels, independent of GTP cyclohydrolase feedback regulatory protein expression. J. Biol. Chem. 2009, 284 (20), 13660. 10.1074/jbc.M807959200. [DOI] [PMC free article] [PubMed] [Google Scholar]
- Alp N. J.; Mussa S.; Khoo J.; Cai S.; Guzik T.; Jefferson A.; Goh N.; Rockett K. A.; Channon K. M. Tetrahydrobiopterin-dependent preservation of nitric oxide-mediated endothelial function in diabetes by targeted transgenic GTP-cyclohydrolase I overexpression. J. Clin. Invest. 2003, 112 (5), 725. 10.1172/JCI17786. [DOI] [PMC free article] [PubMed] [Google Scholar]
- Cai S.; Khoo J.; Channon K. M. Augmented BH4 by gene transfer restores nitric oxide synthase function in hyperglycemic human endothelial cells. Cardiovasc. Res. 2005, 65 (4), 823. 10.1016/j.cardiores.2004.10.040. [DOI] [PubMed] [Google Scholar]
- Choi H. J.; Jang Y. J.; Kim H. J.; Hwang O. Tetrahydrobiopterin is released from and causes preferential death of catecholaminergic cells by oxidative stress. Mol. Pharmacol. 2000, 58 (3), 633. 10.1124/mol.58.3.633. [DOI] [PubMed] [Google Scholar]
- Latremoliere A.; Costigan M. GCH1, BH4 and Pain. Curr. Pharm. Biotechnol. 2011, 12 (10), 1728. 10.2174/138920111798357393. [DOI] [PMC free article] [PubMed] [Google Scholar]
- Takimoto E.; Champion H. C.; Li M.; Ren S.; Rodriguez E. R.; Tavazzi B.; Lazzarino G.; Paolocci N.; Gabrielson K. L.; Wang Y.; et al. Oxidant stress from nitric oxide synthase-3 uncoupling stimulates cardiac pathologic remodeling from chronic pressure load. J. Clin. Invest. 2005, 115 (5), 1221. 10.1172/JCI21968. [DOI] [PMC free article] [PubMed] [Google Scholar]
- Tegeder I.; Costigan M.; Griffin R. S.; Abele A.; Belfer I.; Schmidt H.; Ehnert C.; Nejim J.; Marian C.; Scholz J.; et al. GTP cyclohydrolase and tetrahydrobiopterin regulate pain sensitivity and persistence. Nat. Med. 2006, 12, 1269. 10.1038/nm1490. [DOI] [PubMed] [Google Scholar]
- Choi H. J.; Lee S. Y.; Cho Y.; No H.; Kim S. W.; Hwang O. Tetrahydrobiopterin causes mitochondrial dysfunction in dopaminergic cells: implications for Parkinson’s disease. Neurochem. Int. 2006, 48 (4), 255. 10.1016/j.neuint.2005.10.011. [DOI] [PubMed] [Google Scholar]
- Tran A. N.; Walker K.; Harrison D. G.; Chen W.; Mobley J.; Hocevar L.; Hackney J. R.; Sedaka R. S.; Pollock J. S.; Goldberg M. S.; et al. Reactive species balance via GTP cyclohydrolase I regulates glioblastoma growth and tumor initiating cell maintenance. Neuro-oncology 2018, 20 (8), 1055. 10.1093/neuonc/noy012. [DOI] [PMC free article] [PubMed] [Google Scholar]
- Pickert G.; Lim H. Y.; Weigert A.; Haussler A.; Myrczek T.; Waldner M.; Labocha S.; Ferreiros N.; Geisslinger G.; Lotsch J.; et al. Inhibition of GTP cyclohydrolase attenuates tumor growth by reducing angiogenesis and M2-like polarization of tumor associated macrophages. Int. J. Cancer 2013, 132 (3), 591. 10.1002/ijc.27706. [DOI] [PubMed] [Google Scholar]
- Cronin S. J. F.; Seehus C.; Weidinger A.; Talbot S.; Reissig S.; Seifert M.; Pierson Y.; McNeill E.; Longhi M. S.; Turnes B. L.; et al. The metabolite BH4 controls T cell proliferation in autoimmunity and cancer. Nature 2018, 563, 564. 10.1038/s41586-018-0701-2. [DOI] [PMC free article] [PubMed] [Google Scholar]
- Mannes A. M.; Seiler A.; Bosello V.; Maiorino M.; Conrad M. Cysteine mutant of mammalian GPx4 rescues cell death induced by disruption of the wild-type selenoenzyme. FASEB J. 2011, 25 (7), 2135. 10.1096/fj.10-177147. [DOI] [PubMed] [Google Scholar]
- Konermann S.; Brigham M. D.; Trevino A. E.; Joung J.; Abudayyeh O. O.; Barcena C.; Hsu P. D.; Habib N.; Gootenberg J. S.; Nishimasu H.; et al. Genome-scale transcriptional activation by an engineered CRISPR-Cas9 complex. Nature 2015, 517 (7536), 583. 10.1038/nature14136. [DOI] [PMC free article] [PubMed] [Google Scholar]
- Trumbach D.; Pfeiffer S.; Poppe M.; Scherb H.; Doll S.; Wurst W.; Schick J. A. ENCoRE: an efficient software for CRISPR screens identifies new players in extrinsic apoptosis. BMC Genomics 2017, 18 (1), 905. 10.1186/s12864-017-4285-2. [DOI] [PMC free article] [PubMed] [Google Scholar]
- Qi L. S.; Larson M. H.; Gilbert L. A.; Doudna J. A.; Weissman J. S.; Arkin A. P.; Lim W. A. Repurposing CRISPR as an RNA-guided platform for sequence-specific control of gene expression. Cell 2013, 152 (5), 1173. 10.1016/j.cell.2013.02.022. [DOI] [PMC free article] [PubMed] [Google Scholar]
- Walter R.; Schaffner A.; Blau N.; Kierat L.; Schoedon G. Tetrahydrobiopterin is a secretory product of murine vascular endothelial cells. Biochem. Biophys. Res. Commun. 1994, 203 (3), 1522. 10.1006/bbrc.1994.2358. [DOI] [PubMed] [Google Scholar]
- Skouta R.; Dixon S. J.; Wang J.; Dunn D. E.; Orman M.; Shimada K.; Rosenberg P. A.; Lo D. C.; Weinberg J. M.; Linkermann A.; et al. Ferrostatins inhibit oxidative lipid damage and cell death in diverse disease models. J. Am. Chem. Soc. 2014, 136 (12), 4551. 10.1021/ja411006a. [DOI] [PMC free article] [PubMed] [Google Scholar]
- Kagan V. E.; Mao G.; Qu F.; Angeli J. P.; Doll S.; Croix C. S.; Dar H. H.; Liu B.; Tyurin V. A.; Ritov V. B.; et al. Oxidized arachidonic and adrenic PEs navigate cells to ferroptosis. Nat. Chem. Biol. 2017, 13 (1), 81. 10.1038/nchembio.2238. [DOI] [PMC free article] [PubMed] [Google Scholar]
- Zhang Y.; Tan H.; Daniels J. D.; Zandkarimi F.; Liu H.; Brown L. M.; Uchida K.; O’Connor O. A.; Stockwell B. R. Imidazole Ketone Erastin Induces Ferroptosis and Slows Tumor Growth in a Mouse Lymphoma Model. Cell chemical biology 2019, 26 (5), 623. 10.1016/j.chembiol.2019.01.008. [DOI] [PMC free article] [PubMed] [Google Scholar]
- Zou Y.; Palte M. J.; Deik A. A.; Li H.; Eaton J. K.; Wang W.; Tseng Y. Y.; Deasy R.; Kost-Alimova M.; Dancik V.; et al. A GPX4-dependent cancer cell state underlies the clear-cell morphology and confers sensitivity to ferroptosis. Nat. Commun. 2019, 10 (1), 1617. 10.1038/s41467-019-09277-9. [DOI] [PMC free article] [PubMed] [Google Scholar]
- Chen L.; Zeng X.; Kleibeuker E.; Buffa F.; Barberis A.; Leek R. D.; Roxanis I.; Zhang W.; Worth A.; Beech J. S.; et al. Paracrine effect of GTP cyclohydrolase and angiopoietin-1 interaction in stromal fibroblasts on tumor Tie2 activation and breast cancer growth. Oncotarget 2016, 7 (8), 9353. 10.18632/oncotarget.6981. [DOI] [PMC free article] [PubMed] [Google Scholar]
- Harada T.; Kagamiyama H.; Hatakeyama K. Feedback regulation mechanisms for the control of GTP cyclohydrolase I activity. Science (Washington, DC, U. S.) 1993, 260 (5113), 1507. 10.1126/science.8502995. [DOI] [PubMed] [Google Scholar]
- Linkermann A.; Skouta R.; Himmerkus N.; Mulay S. R.; Dewitz C.; De Zen F.; Prokai A.; Zuchtriegel G.; Krombach F.; Welz P. S.; et al. Synchronized renal tubular cell death involves ferroptosis. Proc. Natl. Acad. Sci. U. S. A. 2014, 111 (47), 16836. 10.1073/pnas.1415518111. [DOI] [PMC free article] [PubMed] [Google Scholar]
- TCGA , TCGA Research Network. https://www.cancer.gov/tcga.
- Uhlen M.; Zhang C.; Lee S.; Sjostedt E.; Fagerberg L.; Bidkhori G.; Benfeitas R.; Arif M.; Liu Z.; Edfors F. A pathology atlas of the human cancer transcriptome. Science (Washington, DC, U. S.) 2017, 357 (6352), eaan2507. 10.1126/science.aan2507. [DOI] [PubMed] [Google Scholar]
- Bersuker K.; Hendricks J.; Li Z.; Magtanong L.; Ford B.; Tang P. H.; Roberts M. A.; Tong B.; Maimone T. J.; Zoncu R. The CoQ oxidoreductase FSP1 acts parallel to GPX4 to inhibit ferroptosis. Nature 2019, 575, 688. 10.1038/s41586-019-1705-2. [DOI] [PMC free article] [PubMed] [Google Scholar]
- Doll S.; Freitas F. P.; Shah R.; Aldrovandi M.; da Silva M. C.; Ingold I.; Grocin A. G.; Xavier da Silva T. N.; Panzilius E.; Scheel C. FSP1 is a glutathione-independent ferroptosis suppressor. Nature 2019, 575, 693. 10.1038/s41586-019-1707-0. [DOI] [PubMed] [Google Scholar]
- Kumari S.; Badana A. K.; G M. M.; G S.; Malla R. Reactive Oxygen Species: A Key Constituent in Cancer Survival. Biomarker Insights 2018, 13, 117727191875539. 10.1177/1177271918755391. [DOI] [PMC free article] [PubMed] [Google Scholar]
- Xue J.; Yu C.; Sheng W.; Zhu W.; Luo J.; Zhang Q.; Yang H.; Cao H.; Wang W.; Zhou J.; et al. The Nrf2/GCH1/BH4 Axis Ameliorates Radiation-Induced Skin Injury by Modulating the ROS Cascade. J. Invest. Dermatol. 2017, 137 (10), 2059. 10.1016/j.jid.2017.05.019. [DOI] [PubMed] [Google Scholar]
- McNeill E.; Crabtree M. J.; Sahgal N.; Patel J.; Chuaiphichai S.; Iqbal A. J.; Hale A. B.; Greaves D. R.; Channon K. M. Regulation of iNOS function and cellular redox state by macrophage Gch1 reveals specific requirements for tetrahydrobiopterin in NRF2 activation. Free Radical Biol. Med. 2015, 79, 206. 10.1016/j.freeradbiomed.2014.10.575. [DOI] [PMC free article] [PubMed] [Google Scholar]
- Sayin V. I.; Ibrahim M. X.; Larsson E.; Nilsson J. A.; Lindahl P.; Bergo M. O. Antioxidants accelerate lung cancer progression in mice. Sci. Transl. Med. 2014, 6 (221), 221ra15. 10.1126/scitranslmed.3007653. [DOI] [PubMed] [Google Scholar]
- Vilaseca M. A.; Lambruschini N.; Gomez-Lopez L.; Gutierrez A.; Moreno J.; Tondo M.; Artuch R.; Campistol J. Long-chain polyunsaturated fatty acid status in phenylketonuric patients treated with tetrahydrobiopterin. Clin. Biochem. 2010, 43 (4–5), 411. 10.1016/j.clinbiochem.2009.11.013. [DOI] [PubMed] [Google Scholar]
- Purushothaman S.; Nair R. R. Mitoprotective antioxidant EUK-134 stimulates fatty acid oxidation and prevents hypertrophy in H9C2 cells. Mol. Cell. Biochem. 2016, 420 (1–2), 185. 10.1007/s11010-016-2788-9. [DOI] [PubMed] [Google Scholar]
Associated Data
This section collects any data citations, data availability statements, or supplementary materials included in this article.