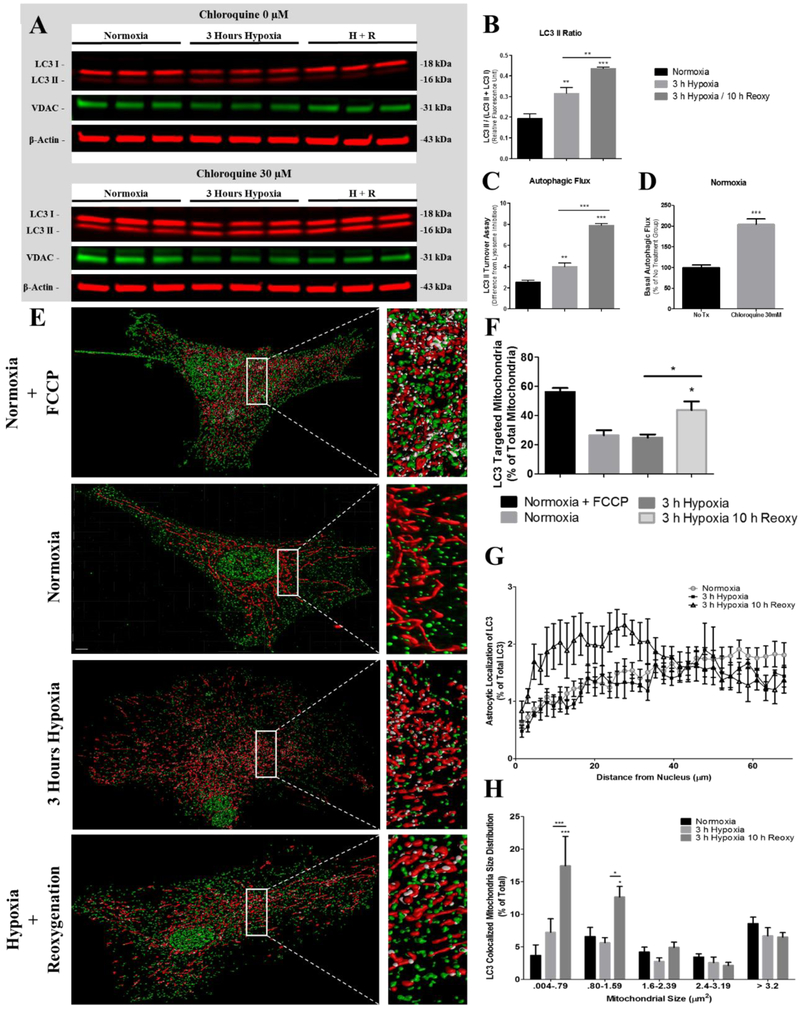
Fig. 5.
Expression and colocalization of LC3 with mitochondria in astrocytes. SDS-PAGE immunoblots indicate an increased LC3 II content after hypoxia and reoxygenation (A) Western blot analysis of whole cell lysates were used to determine the magnitude of (B) LC3 II conversion, (C) cellular VDAC content, (D) autophagic flux, and (E) basal autophagic efficiency. Western blots of lysates from normoxia (n = 5), 3-hours hypoxia (n = 5), and 3-hours hypoxia then 10-hours reoxygenation (H + R, n = 5) were labeled with anti-LC3 (red, green), VDAC (green), and β-actin (red) antibodies. (F) Representative three-dimensional reconstructions of z-stacks depicting mitochondria (red), LC3 (green), and colocalized areas (white) in astrocytes, incubated at normoxia (FCCP), normoxia, 3-hours hypoxia, and 3-hours hypoxia then 10-hours reoxygenation. Scale bar 10 μm. (G) Bar graph (mean +/− SEM) depicting the percentage of total mitochondria colocalized with LC3 in astrocytes incubated under normoxia (FCCP) (n = 7), normoxia (n = 7), 3-hours hypoxia (n = 5), and 3-hours of hypoxia then 10-hours reoxygenation (n = 6). (H) Bar graph (+/− SEM) depicting percentage of mitochondria colocalized with LC3 as a function of mitochondrial size (μm2). (I) Line graph depicting the percentage of extranuclear LC3 (+/− SEM) as a function of nuclear distance for astrocytes incubated at normoxia (circle, n = 7), 3-hours hypoxia (square, n = 5), and 3-hours hypoxia then 10-hours reoxygenation (triangle, n = 6). One-way ANOVA, Bonferroni’s multiple comparison test was used to determine the level of significance between the experimental groups (*p < 0.05; **p < 0.01; ***p < 0.0001). (For interpretation of the references to colour in this figure legend, the reader is referred to the web version of this article.)

