Abstract
We demonstrate spectroscopic photonic force optical coherence elastography (PF-OCE). Oscillations of microparticles embedded in viscoelastic hydrogels were induced by harmonically modulated optical radiation pressure and measured by phase-sensitive spectral-domain optical coherence tomography. PF-OCE can detect microparticle displacements with pico- to nano-meter sensitivity and millimeter-scale volumetric coverage. With spectroscopic PF-OCE, we quantified viscoelasticity over a broad frequency range from 1 Hz to 7 kHz, revealing rich microstructural dynamics of polymer networks across multiple microrheological regimes. Reconstructed frequency-dependent loss moduli of polyacrylamide hydrogels were observed to follow a general power scaling law G″~ω0.75, consistent with that of semiflexible polymer networks. Spectroscopic PF-OCE provides an all-optical approach to microrheological studies with high sensitivity and high spatiotemporal resolution, and could be especially beneficial for time-lapse and volumetric mechanical characterization of viscoelastic materials.
Most biological materials exhibit a certain extent of viscoelastic behaviors that usually demonstrate rich dynamics in a frequency-dependent way over a range of temporal and spatial scales. Since the frequency-dependent viscoelasticity is determined by nano-to-microscale structure and compositions, spectroscopic rheology can play a prominent role in unraveling physical processes, molecular dynamics, and quantitatively revealing diverse mechanical properties of complex materials, including cytoplasm, tissues, and extracellular matrix (ECM) [1,2]. For instance, spectroscopic rheological properties of active cytoplasm in cells can provide unique fingerprint-like information for identifying different cell viabilities, providing additional quantitative pathological characteristics [3]. Spectroscopic rheology can also be helpful in revealing dynamics of polymer networks, including DNA hydrogels [4,5].
A variety of techniques have been utilized in spectroscopic rheology. Conventional bulk oscillatory rheology is easily accessible with good precision in measured mechanical properties, but lacks localized microstructural information and can work only in a very limited range of time scales. In comparison, microrheology extends the capability of rheology into microscale dynamics by interrogating very small volumes of complex materials [6]. Atomic force microscopy (AFM) has been used widely to study viscoelasticity of cells or cell substrates. However, it is applicable only to measurements on the surfaces of materials. Most microrheology with volumetric approaches, including particle-tracking microrheology and diffusing wave spectroscopy, are based on passively measuring the motions of thermally driven micrometer-sized probe particles [7]. These techniques can probe microstructural scale local heterogeneities inside complex materials over a broad range of time scales with high spatiotemporal resolution, under the assumption of thermodynamic equilibrium. Nevertheless, passive microrheology techniques are more useful for measuring viscosity-dominant materials [8]. Optical tweezers (OTs) can be used for both passive and active microrheology [7]. In active microrheology, OTs can generate controllable oscillatory forces on probe microparticles, offering active microrheological measurements for elasticity-dominant viscoelastic materials [9,10]. However, the use of OTs requires precise alignment of the optical trap to each individual probe particle, and therefore long measurement time, which limits their practicability in the driving need for high throughput volumetric mechanical imaging in mechnobiology, especially with the rapidly increasing demand of three-dimensional cell cultures [11].
The emerging technique known as optical coherence elastography (OCE) can provide a volumetric mechanical imaging with micrometer spatial resolution [12–14]. In general, OCE utilizes phase-sensitive optical coherence tomography (OCT) to probe nano- or pico-meter displacements of targets of interest that result from mechanical loadings exerted on the targets. Typical mechanical loading methods include actuator, acoustic radiation force (ARF), and magnetic field force [12,13]. Although most of them can measure dynamics over a large spatiotemporal ranges in tissues [15], they are not as well suited to microrheological measurements, i.e., they lack the capability of quantitatively distinguishing localized microstructural mechanical variations with cellular-scale resolution [13]. For example, the strain map measured by ultrahigh resolution OCE can achieve 2 μm × 2 μm spatial resolution, however, with a reduced axial resolution of 15 μm [16].
Inspired by the pioneering work of Ashkin’s experiments on accelerating micrometer-sized particles with optical radiation pressure [17], we have proposed photonic force (PF)-OCE. PF-OCE uses radiation pressure of photons resulting from a weakly focused light beam as mechanical loading exerted on the embedded microparticles [18]. Without the premise of precise optical alignment that is strictly required in OTs, the mechanical imaging speed can be greatly boosted with PF-OCE. Although PF-OCE is a promising new approach for 3D mechanical microscopy, its capability to quantitatively measure viscoelastic properties over different time scales (i.e., different frequency scales) is still unrealized. Furthermore, the optical system of our previous PF-OCE did not achieve theoretical shot-noise-limited detection sensitivity. In this Letter, we extend the capability of PF-OCE to spectroscopic microrheological studies over a broad range of modulation frequencies, leveraging displacement sensitivity approaching that of the shot-noise limit.
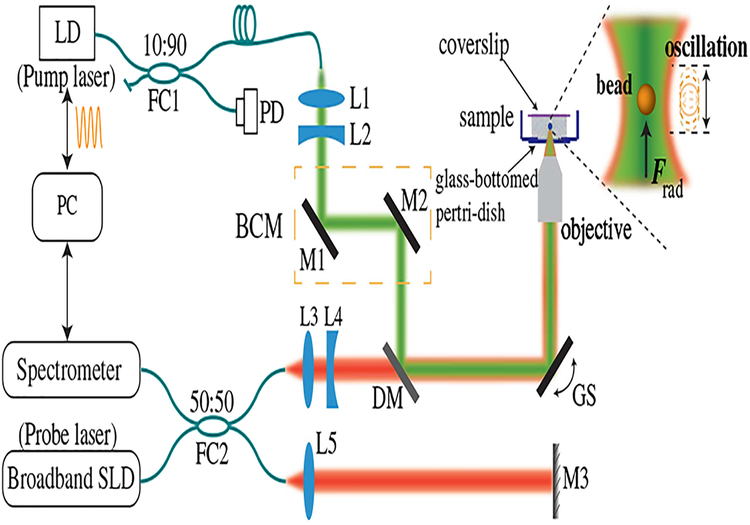
The experimental setup of PF-OCE is shown in Fig. 1, based on a PF “pump” and OCT “probe” configuration. The pump part was a laser diode (Frankfurt Laser Company, FLU0786M250 with optical fiber coupled output, nominal central wavelength at 789 nm) with sinusoidal modulation in optical power/intensity. The choice of 789 nm wavelength leads to a reduction of confounding photothermal (PT) response in an aqueous medium by ~25 times in magnitude compared to the 976 nm pump wavelength used in our previous system [18]. The pump beam was then directed into the sample to apply radiation pressure, i.e., the PF exerted on the embedded microparticles (beads). The probe part was a phase-sensitive spectral-domain OCT, utilizing a broadband super-luminescent diode (SLD, Thorlabs LS2000B) with nominal central wavelength at 1300 nm and full width half-maximum (FWHM) bandwidth of 200 nm. The pump beam was steered and co-aligned with the probe beam under the help of a beam control module (BCM). Both pump and probe beams were focused into the sample through an air-immersion objective lens (Olympus, LCPLN20XIR). The measured transverse and axial resolutions of OCT imaging were 2.3 μm (corresponding to an effective NA of 0.28) and 3.7 μm in air, respectively. The FWHM of the focused pump beam was measured as 2.2 μm in air, corresponding to an effective NA of 0.18.
Fig. 1.
Experimental setup of spectroscopic PF-OCE. LD, laser diode; SLD, superluminescent laser diode; FC 1–2, fiber coupler; L1–5, lens; M1–3, mirrors; PD, photo-detector; DM, dichroic mirror; GS, galvanometer scanner; BCM, beam control module.
Polyacrylamide (PAAm) hydrogels were used as viscoelastic materials for proof-of-concept studies. PAAm hydrogels have been widely used as tissue-mimicking phantoms and substrates for cell cultures. The stiffness of PAAm hydrogels can be tuned by varying total polymer concentration (T% w∕v) and relative cross-linker percentage (C% w∕w). Preparation of PAAm hydrogels followed standard procedures described in [19], except that the phantom was sandwiched between a coverslip and well of a glass-bottomed imaging petri dish. Uncoated polystyrene latex beads (refractive index ~1.58) with average diameter of ~1.7 μm were uniformly dispersed into PAAm hydrogels before polymerization as microrheological probe beads, while ~0.1 μm diameter polystyrene beads were also added to provide additional optical contrast for independent estimation of depth-dependent PT signal [18]. Under current experimental conditions, the PF exerted on ~0.1 μm PT-reporter beads is negligible.
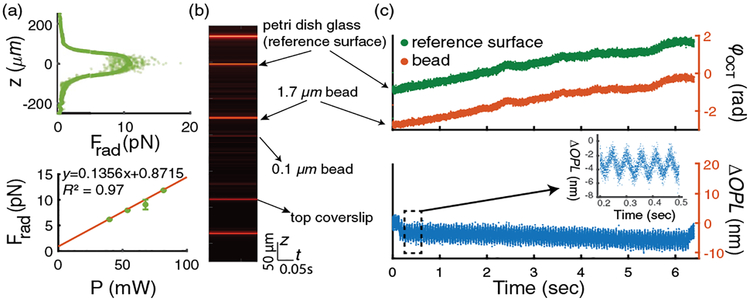
Depth-resolved calibration of PF Frad (z) can be conducted by measuring axial trajectory profiles of ~1.7 μm diameter polystyrene latex beads sparsely dispersed into a solution with 10% v/v glycerol in distilled water (with refractive index approximately equal to PAAm hydrogels). Details of the measurement procedure can be found in [20]. The measured depth-dependent Frad (z) is shown in Fig. 2(a), which indicates a maximum force of Frad ~ 11 pN with a pump power of around 78 mW in the sample (close to theoretical calculated result of ~18 pN based on generalized Lorenz–Mie theory [18,21]).
Fig. 2.
(a) Calibration of depth-dependent PF. Top: depth-resolved PF profile with optical power of ~78 mW in sample, data smoothed by moving averaging method are plotted as points with lower transparency; bottom: Frad(z= 0) under different excitation pump powers with a linear curve fit. (b) Measured M-mode OCT images of 1.7 μm beads in response to 18 Hz PF excitation. (c) Top: time-dependent OCT phase ϕOCT; bottom: ΔOPL of beads.
The oscillations of probe beads were measured under M-mode OCT imaging. The OCT beam was fixed at the center of B-mode images during an alignment step, during which probe beads were translated to the center of B-mode OCT images manually based on metrics to maximize interference fringe contrast. Images were continuously captured at a sampling rate equal to line scan rate of the camera and then processed (background subtraction, dispersion compensation, spectral re-sampling, and inverse Fourier transformation) to obtain complex OCT signals. One of the acquired M-mode images is shown in Fig. 2(b). Time-dependent OCT phase φOCT at positions of probe beads and coverslip were referenced to the petri dish bottom glass surface via multiplication by complex conjugate frame by frame to obtain corresponding optical phase change ΔφOCT and also partially reduce common-mode noises of the system [see Fig. 2(c)]. The optical path length changes ΔOPL induced by oscillations of beads and PT effect were calculated as ΔOPL = ΔφOCT · λc/(4πnmed), where λc is the center wavelength of the OCT beam, and nmed ~ 1.35 is the refractive index of the medium. By making use of OCT signal from 0.1 μm beads, the depth-dependent PT phase modulation could be reconstructed for PT compensation. After compensating for the PT-effect-induced ΔOPL at the position of each 1.7 μm bead, the complex mechanical response of each 1.7 μm bead was extracted. Detailed signal processing methods can be found in [22]. In our measurements, modulation frequencies f m of the pump beam were scanned step by step from 1 Hz to 7 kHz automatically with appropriate line scan rates, dynamically adjusted from 10 kHz to 90 kHz for best sampling condition (large enough modulation cycles and sampling rate to obtain near shot-noise-limited displacement noise floor). The sampling conditions used in this study required acquisition of 64,000 A-scans at each of three frames for each frequency at each bead and, in total, five beads per sample were measured. The measured minimum detectable ΔOPL was ~19 pm for modulation frequency >1 kHz with OCT signal-to-noise ratio of 46 dB, approaching the shot-noise limit [23] of ~13 pm (after averaging over 64,000 A-scans), which is approximately one order of magnitude improvement compared with our previous system [18]. Such an improvement of displacement sensitivity could be attributed to the more compact design and reduced height of the optical system.
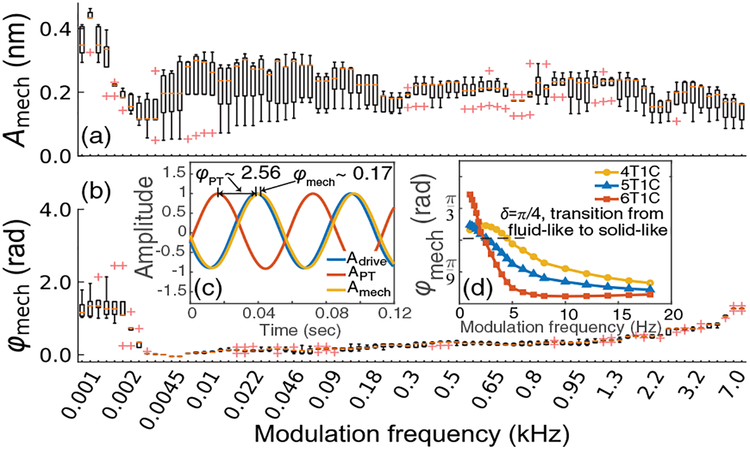
Complex mechanical responses of beads embedded in 6T1C (6% w/v total polymer concentration and 1% w/w relative cross-linker percentage) PAAm hydrogel are shown in Fig. 3. The oscillation amplitudes Amech show little variation, corresponding to a uniform mechanical stiffness of the hydrogels over the measured frequency range. However, the phase lags φmech, defined as magnitude of negative phase shift with respect to drive waveform [Fig. 3(c)], demonstrate an obvious jump from around π∕2 to 0 at modulation frequency of approximately 2.5 Hz. Such a jump implies that the PAAm hydrogels evolve from a viscosity-dominant state at low modulation frequency to an elasticity-dominant state at high modulation frequency, a behavior that has been extensively observed in polymer solutions [1]. Due to the localized excitation provided by PF exerted on beads, we attribute the rebound of phase lags from 0 towards π∕2 to increasing viscosity of the sample, rather than the bulk geometrical resonances that are present with spatially extended mechanical excitation [24].
Fig. 3.
Complex mechanical response (a) magnitudes Amech and (b) phase lags ϕmech over different frequencies in 6T1C PAAm sample. The median value of each frequency is indicated by an orange line. The red crosses are outliers, defined as data lying outside 1.5 whisker length with respect to lower or upper quartile. Inset: (c) illustration of phase lag definition and (d) measured phase lags at low modulation frequency in PAAm samples with different total polymer concentrations. All axes are displayed with a linear scale.
The complex shear modulus G* = G′ + iG″ can be reconstructed from the measured complex mechanical response of probe beads. Median values of five beads for each sample were extracted as reconstruction by the generalized Stokes–Einstein relation (GSER) [2]:
| (1) |
where a is the radius of the probe beads. Notably, GSER will be consistent with other more vigorous approaches to harmonically forced oscillations of embedded probe beads in viscoelastic materials when both a and modulation frequency fm are small [25,26]. Most viscoelastic materials appear to be stiffer at high modulation frequencies. As a result, the mechanical responses are much weaker, hindering the precise measurement of mechanical properties at high modulation frequencies. Compared to our previous system, PF-induced Amech was improved by a factor of 2 for a given sample stiffness, owing to a more optimal pairing of 2.2-μm PF with 1.7-μm bead sizes [18]. Improvements in both displacement sensitivity and precise isolation of mechanical response make the measurement of complex shear modulus at high frequencies possible.
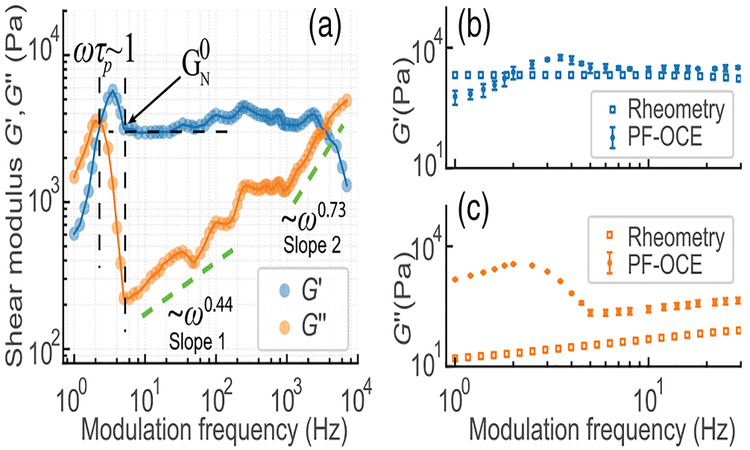
The reconstructed complex shear modulus depicts strong spectroscopic behavior (Fig. 4(a)). Storage modulus G′ shows an almost frequency-independent plateau over a large frequency range, which has commonly been observed in most entangled polymer networks [27]. Plateau modulus is defined as G′ at the modulation frequency where the loss modulus G″ is minimum. As expected, was increased with increasing total polymer concentration, as shown in Table 1 [27]. Remarkably, G″ follows well-known frequency-dependent trends at high modulation frequency, starting from G″ ~ ω0.44 between 7 Hz and 500 Hz, transitioning to G″ ~ ω0.73 above 1 kHz. Similar trends were also observed in other phantoms with different polymer concentrations, as summarized in Table 1. Those trends are concentration independent, indicating possible general structural dynamics of PAAm hydrogels under our sample preparation conditions. We also note that the G″ ~ ω0.75 trend follows a universal power-scaling law in semiflexible polymer networks, including PAAm hydrogels with crosslink concentration larger than 0.05% [28] and F-actin solutions in cytoplasm [29,30]. Therefore, our results are consistent with other reported literature based on particle-tracking microrheology, suggesting our PAAm hydrogels could be classified as semiflexible polymer networks. There is an unexpected drop of G′ at frequencies >3 kHz, which may result from insufficient sampling per modulation cycle [31], which could be eliminated by improving the A-scan rate with a high-speed swept source [32].
Fig. 4.
(a) Reconstructured complex shear modulus of 6T1C PAAm hydrogel. (b), (c) Representative comparison of complex shear modulus measured with PF-OCE and shear rheometry in 6T1C sample. For PF-OCE results, data-points and error bars indicate median value and standard deviation at each modulation frequency, respectively.
Table 1.
Parameters Characterizing G*(ω)
| Sample | fp (Hz) | Slope 1 | Slope 2 | |
|---|---|---|---|---|
| 4T1C | 5.0 ± 0.5 | 1224 ± 362 | 0.40 ± 0.03 | 0.69 ± 0.08 |
| 5T1C | 3.0 ± 0.5 | 1665 ± 276 | 0.36 ± 0.05 | 0.77 ± 0.09 |
| 6T1C | 2.5 ± 0.2 | 3021 ± 129 | 0.44 ± 0.09 | 0.73 ± 0.06 |
Furthermore, there is an obvious crossover between G′ and G″, which corresponds to a phase lag of π∕4. Such a crossover indicates the transition from a viscosity-dominant (fluid-like) phantom to an elasticity-dominant (solid-like) phantom, which can be observed more clearly in terms of phase lags as shown in Fig. 3(d). The corresponding time constant τp = 1∕fp, where fp denotes the frequency at the crossover, is defined as the lon-gest relaxation time of polymer chains [27]. As summarized in Table 1 (shown with 90% confidential interval), τp increases with polymer concentration, consistent with general features of polymer networks [33].
To validate our spectroscopic PF-OCE technique, we also compared all our results with those measured by a standard parallel-plate shear rheometer (TA Instruments, DHR-3) [18] (see Figs. 4(b) and 4(c) for a representative comparison result). After onset of the plateau modulus, G′ measured by spectroscopic PF-OCE matches well with that measured by standard shear rheometry [Fig. 4(b)]. In the plateau region, the discrepancy between two techniques may result from any misalignment between pump and probe beams and also possible random drifts of beads during measurements. At low modulation frequency (below the onset of the plateau modulus, where polymer chains are not involved in significant entanglement), PF-OCE results show more rich dynamics (more frequency-dependent variations) over bulk shear rheometry, which have also been observed in other microrheology results when compared to bulk rheometry [34]. In particular, G″, which is closely related to microstructural dynamics of the polymer chains and fluid flowing through the microstructural mesh, are found to deviate significantly from that in bulk shear rheometry [see Fig. 4(c)]. We speculate that the discrepancy may be attributed to the microscale forced fluid flow dynamics induced by the oscillation of each bead, compared to the relatively homogeneous fluid flow dynamics resulting from bulk mechanical loading. Nevertheless, the power-scaling law trends in our results are in good agreement with other microrheological measurements in PAAm hydrogels measured with dynamic light scattering or AFM, which have obtained similar frequency-dependent behaviors [4,35], providing a side validation to our spectroscopic PF-OCE.
In conclusion, we have demonstrated PF-OCE as a novel technique for spectroscopic microrheological studies. Modulation frequencies cover a broad range from 1 Hz to 7 kHz with potential for significant improvement. Complex shear moduli of PAAm hydrogels showed strong frequency-dependent responses. At high modulation frequency (above 1 kHz), the loss moduli were found to follow a universal power-scaling law of G″ ~ ω0.75, which has been observed in many semiflexible polymer networks. Reconstructed storage moduli in the plateau region agree well with standard bulk shear rheometry in the low-frequency range. This proof-of-concept study demonstrates that PF-OCE may serve as a versatile complementary technique to existing microrheological approaches in the field of mechanobiology, offering high sensitivity and spatiotemporal resolution. These capabilities could be especially beneficial for time-lapse, volumetric mechanical characterization of engineered biological substrates that are dynamically remodeled by cells.
Funding.
National Institutes of Health (R21EB024747, R01GM132823).
REFERENCES
- 1.Waigh TA, Rep. Prog. Phys 79, 074601 (2016). [DOI] [PubMed] [Google Scholar]
- 2.Wirtz D, Annu. Rev. Biophys 38, 301 (2009). [DOI] [PubMed] [Google Scholar]
- 3.Rigato A, Miyagi A, Scheuring S, and Rico F, Nat. Phys 13, 771 (2017). [DOI] [PMC free article] [PubMed] [Google Scholar]
- 4.Krajina BA, Tropini C, Zhu A, DiGiacomo P, Sonnenburg JL, Heilshorn SC, and Spakowitz AJ, ACS Cent. Sci 3, 1294 (2017). [DOI] [PMC free article] [PubMed] [Google Scholar]
- 5.Xing Z, Caciagli A, Cao T, Stoev I, Zupkauskas M, O’Neill T, Wenzel T, Lamboll R, Liu D, and Eiser E, Proc. Natl. Acad. Sci. USA 115, 8137 (2018). [DOI] [PMC free article] [PubMed] [Google Scholar]
- 6.Mason TG and Weitz DA, Phys. Rev. Lett 74, 1250 (1995). [DOI] [PubMed] [Google Scholar]
- 7.Weihs D, Mason TG, and Teitell MA, Biophys. J 91, 4296 (2006). [DOI] [PMC free article] [PubMed] [Google Scholar]
- 8.Squires TM and Mason TG, Annu. Rev. Fluid Mech 42, 413 (2010). [Google Scholar]
- 9.Keating M, Kurup A, Alvarez-Elizondo M, Levine AJ, and Botvinick E, Acta Biomater. 57, 304 (2017). [DOI] [PMC free article] [PubMed] [Google Scholar]
- 10.Nishizawa K, Bremerich M, Ayade H, Schmidt CF, Ariga T, and Mizuno D, Sci. Adv 3, e1700318 (2017). [DOI] [PMC free article] [PubMed] [Google Scholar]
- 11.Pampaloni F, Reynaud EG, and Stelzer EHK, Nat. Rev. Mol. Cell Biol 8, 839 (2007). [DOI] [PubMed] [Google Scholar]
- 12.Mulligan JA, Untracht GR, Chandrasekaran SN, Brown CN, and Adie SG, IEEE J. Sel. Top. Quantum Electron 22, 246 (2016). [Google Scholar]
- 13.Larin KV and Sampson DD, Biomed. Opt. Express 8, 1172 (2017). [DOI] [PMC free article] [PubMed] [Google Scholar]
- 14.Kennedy BF, Wijesinghe P, and Sampson DD, Nat. Photonics 11, 215 (2017). [Google Scholar]
- 15.Adie SG, Liang X, Kennedy BF, John R, Sampson DD, and Boppart SA, Opt. Express 18, 25519 (2010). [DOI] [PMC free article] [PubMed] [Google Scholar]
- 16.Curatolo A, Villiger M, Lorenser D, Wijesinghe P, Fritz A, Kennedy BF, and Sampson DD, Opt. Lett 41, 21 (2016). [DOI] [PubMed] [Google Scholar]
- 17.Ashkin A, Phys. Rev. Lett 24, 156 (1970). [Google Scholar]
- 18.Leartprapun N, Iyer RR, Untracht GR, Mulligan JA, and Adie SG, Nat. Commun 9, 2079 (2018). [DOI] [PMC free article] [PubMed] [Google Scholar]
- 19.Tse JR and Engler AJ, Curr. Protoc. Cell Biol 47, 1 (2010). [DOI] [PubMed] [Google Scholar]
- 20.Leartprapun N, Iyer RR, and Adie SG, Opt. Express 26, 2410 (2018). [DOI] [PMC free article] [PubMed] [Google Scholar]
- 21.Ren KF, Gréhan G, and Gouesbet G, Appl. Opt 35, 2702 (1996). [DOI] [PubMed] [Google Scholar]
- 22.Leartprapun N, Lin YC, and Adie SG, Opt. Express 27, 22615 (2019). [DOI] [PMC free article] [PubMed] [Google Scholar]
- 23.Chang EW, Kobler JB, and Yun SH, Opt. Lett 37, 3678 (2012). [DOI] [PMC free article] [PubMed] [Google Scholar]
- 24.Oldenburg AL and Boppart SA, Phys. Med. Biol 55, 1189 (2010). [DOI] [PMC free article] [PubMed] [Google Scholar]
- 25.Oestreicher HL, J. Acoust. Soc. Am 23, 707 (1951). [Google Scholar]
- 26.Urban MW, Nenadic IZ, Mitchell SA, Chen S, and Greenleaf JF, J. Acoust. Soc. Am 130, 1133 (2011). [DOI] [PMC free article] [PubMed] [Google Scholar]
- 27.Morse DC, Macromolecules 31, 7044 (1998). [Google Scholar]
- 28.Dasgupta BR and Weitz DA, Phys. Rev. E 71, 021504 (2005). [DOI] [PubMed] [Google Scholar]
- 29.Gittes F and MacKintosh FC, Phys. Rev. E 58, R1241 (1998). [Google Scholar]
- 30.Gisler T and Weitz DA, Phys. Rev. Lett 82, 1606 (1999). [Google Scholar]
- 31.Schnurr B, Gittes F, MacKintosh FC, and Schmidt CF, Macromolecules 30, 7781 (1997). [Google Scholar]
- 32.Singh M, Wu C, Liu C-H, Li J, Schill A, Nair A, and Larin KV, Opt. Lett 40, 2588 (2015). [DOI] [PMC free article] [PubMed] [Google Scholar]
- 33.Liu Y, Jun Y, and Steinberg V, J. Rheol 53, 1069 (2009). [Google Scholar]
- 34.Shin JH, Gardel ML, Mahadevan L, Matsudaira P, and Weitz DA, Proc. Natl. Acad. Sci. USA 101, 9636 (2004). [DOI] [PMC free article] [PubMed] [Google Scholar]
- 35.Abidine Y, Laurent VM, Michel R, Duperray A, Palade LI, and Verdier C, Europhys. Lett 109, 38003 (2015). [Google Scholar]


