

SUMMARY
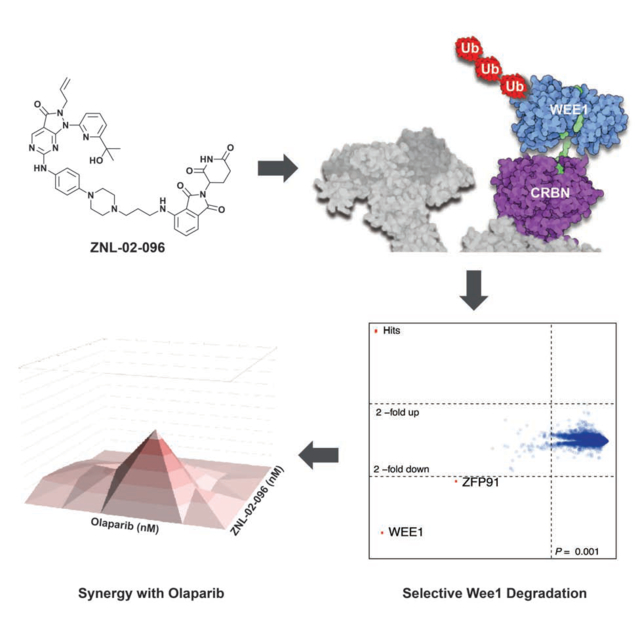
The G1/S cell cycle checkpoint is frequently dysregulated in cancer, leaving cancer cells reliant on a functional G2/M checkpoint to prevent excessive DNA damage. Wee1 regulates the G2/M checkpoint by phosphorylating CDK1 at Tyr15 to prevent mitotic entry. Previous drug development efforts targeting Wee1 resulted in the clinical-grade inhibitor, AZD1775. However, AZD1775 is burdened by dose-limiting adverse events, and has off-target PLK1 activity. In an attempt to overcome these limitations, we developed Wee1 degraders by conjugating AZD1775 to the cereblon (CRBN)-binding ligand, pomalidomide. The resulting lead compound, ZNL-02-096, degrades Wee1 while sparing PLK1, induces G2/M accumulation at 10-fold lower doses than AZD1775, and synergizes with Olaparib in ovarian cancer cells. We demonstrate that ZNL-02-096 has CRBN-dependent pharmacology that is distinct from AZD1775, which justifies further evaluation of selective Wee1 degraders.
eTOC Blurb
Li, Pinch et al. develop and characterize the first selective Wee1 degrader, ZNL-02-096, by linking the clinical candidate inhibitor, AZD1775, to the cereblon-binding ligand, pomalidomide. They demonstrate that ZNL-02-096 exhibits cereblon-dependent pharmacology, induces G2/M phase accumulation and apoptosis at lower doses than AZD1775, and synergizes with Olaparib.
Graphical Abstract
INTRODUCTION
Wee1, a tyrosine kinase, regulates the G2/M cell-cycle checkpoint by phosphorylating and inactivating CDK1 in response to extrinsic DNA damage and errors in DNA synthesis, thereby preventing mitotic entry(Schmidt et al., 2017). Cancer cells often have a deficient G1/S checkpoint, frequently via mutation of p53, which leaves them reliant on the G2/M checkpoint to avoid mitotic catastrophe. Therefore, abrogation of the G2/M checkpoint by inhibiting Wee1 can sensitize tumors to DNA-damaging therapies(Carrassa and Damia, 2017; Matheson et al., 2016a).
AZD1775 (Fig. 1A) is an ATP-competitive Wee1 inhibitor that decreases downstream phosphorylation of CDK1 Tyr15, induces premature mitosis, sensitizes cancer cells to DNA-damaging agents, and causes tumor regression in preclinical cancer models(Fu et al., 2018; Guertin et al., 2013; Hirai et al., 2009). Numerous clinical trials are underway to evaluate AZD1775 in combination with DNA-damaging agents in advanced solid tumors and leukemia. Several trials are also testing AZD1775 monotherapy, for example in ovarian cancer patients with germline BRCA1/2 mutations(Leijen et al., 2016).
Figure 1. Design and characterization of Wee1-targeted degraders.

(A) Chemical structure of AZD1775, with linker attachment point highlighted in blue (B) Chemical structures of Wee1 degraders and the negative control, ZNL-02-178 (C) Histogram of the shortest pairwise distances between lenalidomide and AZD1775, with the red arrow corresponding to the docking pose in panel D (Rosetta) (D) Shortest pairwise distance docking pose between lenalidomide and AZD1775 (Rosetta)
While AZD1775 shows promising efficacy in the clinic, it has been associated with dose-limiting toxicities, including neutropenia, thrombocytopenia, anemia, and nausea(Do et al., 2015; Guertin et al., 2013). Furthermore, AZD1775 has off-target activity against other kinases; for example, it is equipotent against recombinant Wee1 and the Ser/Thr kinase, PLK1(Wright et al., 2017), and analogs of AZD1775 have been reported that maintain potency against Wee1 but with reduced single-agent cellular cytotoxicity(Matheson et al., 2018; Matheson et al., 2016b). These limitations highlight the need for an agent that selectively eliminates Wee1 activity and that offers the potential for lower dosing.
Bifunctional degraders are small molecules composed of two protein-binding ligands, one that recruits an E3 ligase and the other that binds a protein of interest (POI). The resulting ternary complex enables the ubiquitination and proteasomal degradation of the POI. Degraders can offer advantages over traditional inhibitors, including catalytic target engagement to give a sub-stoichiometric drug requirement, and the ability to achieve selective degradation with a non-selective ligand(Toure and Crews, 2016; Winter et al., 2015). For example, selective degradation of CDK4 or CDK6 can be achieved with dual CDK4/6 inhibitor-based degraders(Jiang et al., 2019), and selective degradation of CDK9 is possible with degraders based on a non-selective CDK inhibitor(Olson et al., 2017). In a study that probed the degradable kinome, Wee1 was among the kinases degraded by a promiscuous multi-kinase degrader(Huang et al., 2018), suggesting that Wee1 is a suitable target for small molecule-induced degradation.
Here, we describe the design and characterization of the selective Wee1 degrader. Through docking and structure-guided design(Nowak et al., 2018), we developed a series of degraders by conjugating AZD1775 to pomalidomide, which binds the ubiquitously expressed E3 ligase, CRBN. Using cell-based assays, we demonstrate that the resulting lead compound, ZNL-02-096, induces potent and rapid Wee1 degradation, while sparing degradation of AZD1775’s secondary target, PLK1. We further show that ZNL-02-096 induces G2/M accumulation, increases unrepaired DNA damage and apoptosis, and synergizes with the PARP inhibitor, Olaparib, in ovarian cancer cells.
RESULTS
Development and Optimization of Wee1 Degraders
To develop a Wee1-targeted degrader, we modified AZD1775 by conjugating it to the CRBN-binding ligand, pomalidomide(Chamberlain et al., 2014; Chanan-Khan et al., 2013). The available co-crystal structure of Wee1 with AZD1775 (PDB 5V5Y) suggests that the N-methyl piperazine is solvent exposed (Fig. 1A) and we therefore selected this site for the attachment of linkers to pomalidomide.
Compounds were alkylated from the 4-nitrogen of AZD1775’s piperazine, and extended with a polyethylene glycol (PEG) chain conjugated to pomalidomide. By this approach, we synthesized ZNL-02-012, as well as a derivative without the amide bond (ZNL-02-047) to reduce the number of hydrogen bond donors, with the goal of enhancing cell penetration(Fig. 1B). ZNL-02-012 and ZNL-02-047 were similarly potent binders of recombinant Wee1, with IC50 values of 1–10 nM, as evaluated using the Fluorescence Resonance Energy Transfer (FRET)-based LanthaScreen assay (Invitrogen) (Table S1). Both compounds also induced Wee1 degradation following a 5 hr treatment in MOLT4 cells, an acute lymphoblastic leukemia (ALL) cell line that is sensitive to AZD1775 treatment(Di Rora et al., 2018). While a 1 μM treatment of ZNL-02-012 was required to achieve maximal Wee1 degradation, 100 nM of ZNL-02-047 was sufficient to degrade Wee1, likely due to enhanced cell permeability (Fig. S1). We also confirmed that treatment with either AZD1775 or pomalidomide alone was insufficient to induce Wee1 degradation (Fig. S1). That ZNL-02-012 and ZNL-02-047 successfully engaged recombinant Wee1 and mediated its cellular degradation validated the N-methyl piperazine of AZD1775 as a suitable linker attachment site.
To optimize these initial compounds, we determined the minimum required linker length for ternary complex formation using Rosetta docking to predict degrader-mediated protein-protein interactions(Nowak et al., 2018). We performed docking with 40,000 models based on the X-ray crystal structures of lenalidomide bound to CRBN (PDB 5FQD) and apo Wee1 (PDB 3CR0) to identify the top 200 low energy minima conformations. We then aligned the structure of AZD1775 bound to Wee1 (PDB 5V5Y) to the docked poses of apo Wee1, which allowed us to calculate the shortest possible distances between the N-methyl piperazine of AZD1775 and lenalidomide (Fig. S1). Use of the apo structure to generate a docking model, followed by addition of the AZD1775 ligand post-docking, made possible the exploration of binding conformations that would otherwise have been excluded due to steric clashes. This approach thereby enables the design of degraders with short linkers, including molecules in which the two ligands are directly fused. Accordingly, we identified a cluster of linkers 3–7 Å in length, corresponding to 2–6 linker atoms, as sufficient to connect the two moieties (Fig. 1C–D).
To test this docking prediction, we synthesized two derivatives with short saturated carbon chain linkers, either 6 (ZNL-02-040) or 3 (ZNL-02-096) atoms in length(Fig. 1B). While both compounds potently engaged recombinant Wee1 (LanthaScreen)(Table S1) and induced Wee1 degradation following a 5 hr exposure in MOLT4 cells, degradation was most pronounced for ZNL-02-096, which we selected as our lead compound (Fig. S1). We also synthesized a corresponding negative control (ZNL-02-178) by methylating the nitrogen of the glutarimide ring to prevent CRBN binding (Fig. 1B). ZNL-02-178 inhibits but does not degrade Wee1, enabling comparisons with ZNL-02-096 to distinguish between inhibition- and degradation-dependent pharmacology (Fig. S1). Ultimately, we used Rosetta docking to inform linker development, which yielded ZNL-02-096 as a potent, nanomolar Wee1 degrader.
ZNL-02-096 is a Rapid and Selective CRBN-mediated Wee1 Degrader
To assess the mechanism of ZNL-02-096, we compared its activity in parental versus CRBN−/− MOLT4 cells. In parental MOLT4 cells, ZNL-02-096 induced potent Wee1 degradation after 5 rs, with maximal degradation observed at 100 nM and a “hook effect” apparent at the top concentration of 10 μM, where ZNL-02-096-CRBN and ZNL-02-096-Wee1 binary complexes inhibit the formation of a productive ternary complex(Pettersson and Crews, 2019; Toure and Crews, 2016). By contrast, treatment with ZNL-02-096 in CRBN−/− MOLT4 cells did not affect Wee1 abundance, demonstrating that ZNL-02-096-mediated Wee1 degradation was CRBN-dependent (Fig. 2A). Furthermore, treatment with ZNL-02-096 in the parental MOLT4 cells reduced phosphorylation of CDK1 at Tyr15 (pCDK1 Y15) starting at a 100 nM dose, while decreased pCDK1 Y15 was observed in the CRBN−/− MOLT4 cells starting at a 1 μM dose. Therefore, low concentrations of ZNL-02-096 (100 nM) yielded CRBN-dependent effects on pCDK1 Y15, while high concentrations (1 μM or above) resulted in the combined effects of inhibition and degradation.
Figure 2 |. ZNL-02-096 induces potent, rapid, selective, and CRBN-dependent Wee1 degradation.

(A) Immunoblot analysis of MOLT4 parental or CRBN−/− cells treated with ZNL-02-096 for 5 hrs; (B) Immunoblot analysis of MOLT4 cells pre-treated with DMSO, Carfilzomib (Carf.), MLN4924 (MLN), pomalidomide (Pom.), or AZD1775 for 2 hrs, and then co-treated with ZNL-02-096 for 5 hrs; (C) Immunoblot analysis of MOLT4 cells treated with ZNL-02-096 for the indicated time points; (D) Immunoblot analysis of MOLT4 cells treated with ZNL-02-096 or ZNL-02-178 for the indicated time points; (E) Log2 fold-change in abundance of proteins as measured using multiplexed quantitative-mass spectrometry-based proteomics of MOLT4 cells treated with ZNL-02-096 (100 nM) for 2 hrs vs. p-value. n = 3 biological replicates.
We next evaluated the necessity of proteasome function, Wee1 and CRBN binding for ZNL-02-096 activity. Degradation of Wee1 by ZNL-02-096 was rescued upon pretreatment with the proteasome inhibitor, carfilzomib, establishing a requirement for proteasome function (Fig. 2B). Wee1 degradation was also prevented following pretreatment with the NEDD8-activating enzyme inhibitor, MLN4924, indicating a dependence on Cullin-RING ligase (CRL) activity given that CUL4 neddylation is required for E3 ligase activity (Fig. 2B). Finally, pretreatment with either an excess of AZD1775 or pomalidomide prevented ZNL-02-096-induced Wee1 degradation, demonstrating a requirement for both Wee1 and CRBN engagement (Fig. 2B), although pomalidomide pretreatment gave only partial rescue. Notably, the decrease in pCDK Y15 induced by 100 nM of ZNL-02-096 was similarly dependent on proteasome function and CRBN binding, as indicated by the rescue of this downstream phenotype upon pretreatment with carfilzomib, MLN4924, or pomalidomide. As expected, pretreatment with 1 μM of AZD1775 alone decreased pCDK1 Y15 by inhibiting Wee1, independent of ZNL-02-096 co-treatment (Fig. 2B).
To evaluate the kinetics of Wee1 degradation, we performed a time course in MOLT4 cells using 100 nM of ZNL-02-096. Degradation occurred rapidly, with over 50% degradation achieved within 30 min, and complete degradation reached by 3 hr. Wee1 degradation was accompanied by a similarly rapid reduction in pCDK1 Y15 (Fig. 2C). In addition to being rapid, Wee1 degradation was prolonged, with a single 100 nM treatment of ZNL-02-096 resulting in sustained Wee1 loss for at least 48 hrs. By contrast, the negative control, ZNL-02-178, had no effect on Wee1 protein levels out to 48 hrs after treatment (Fig. 2D).
To compare their biochemical selectivity, we submitted ZNL-02-096 and AZD1775 for KINOMEscan profiling (DiscoverX) at 1 μM. As expected, both compounds displayed a similar off-target profile - for example, exhibiting strong engagement of both Wee1 and PLK1 (Fig. S1; Supp Data Set 1). This result was confirmed in a FRET-based Z’-LYTE kinase assay (Invitrogen), in which ZNL-02-096 potently inhibited PLK1 (IC50 = 102 nM; Table S1).
Given precedent that selective degraders can be generated from non-selective ligands(Jiang et al., 2019; Olson et al., 2017), we next assessed the selectivity of degradation by performing multiplexed mass spectrometry (MS)-based proteomics(Donovan et al., 2018) in MOLT4 cells treated with 100 nM of ZNL-02-096 for 2 hrs. Wee1 was the only protein significantly (P = 8.22E-09) downregulated (Log2FC = −1.97) across the proteome, thus establishing ZNL-02-096 as a Wee1 degradation selective molecule. No downregulation of PLK1 was evident by proteomics, or by immunoblot analysis (Fig. 2D–E).
Zinc-finger transcription factors such as Ikaros (IKZF1), Aiolos (IKZF3), and ZFP91 are established off-targets of IMiD-based degraders(Donovan et al., 2018; Krönke et al., 2014). While low levels of ZFP91 degradation was evident in the proteomics experiment (Fig. 2E), no degradation of either IKZF1 or IKZF3 by ZNL-02-096 was observed at short time points. However, degradation of both IKZF1 and IKZF3 was apparent following a 24 hr treatment, as assayed by immunoblotting (Fig. S1).
These data show that ZNL-02-096 induces potent degradation of Wee1 in a CRBN- and proteasome-dependent manner, with maximal degradation achieved at 100 nM. While ZNL-02-096 inhibits PLK1 in vitro, it does not degrade PLK1 in cells. Finally, while ZNL-02-096 induces selective Wee1 degradation at short time points (2–5 hrs), it degrades the common IMiD targets (IKZF1/3) by 24 hrs post-treatment. Therefore, it is critical to include an IMiD control in cell-based assays in order to distinguish between the phenotypes of Wee1 versus IKZF1/3 degradation.
ZNL-02-096 Induces DNA Damage, Apoptosis, and Deregulation of the G2/M Checkpoint
We next evaluated the effects of targeted Wee1 degradation on the cell cycle. Following loss of Wee1 activity, cancer cells are expected to enter mitosis before completing DNA repair, resulting in unrepaired DNA damage and mitotic catastrophe (Beck et al., 2012). In support of this hypothesis, a 24 hr treatment of ZNL-02-096 (100 nM) in MOLT4 cells reduced pCDK1 Y15, increased apoptosis, as monitored by PARP cleavage, and increased unrepaired DNA, as indicated by the expression of the DNA double-strand break marker, γH2Ax. By contrast, treatment with an equivalent dose of ZNL-02-178 or AZD1775 did not produce these downstream changes. Rather, a 1 μM treatment of AZD1775 was necessary to produce the same downstream changes as 100 nM of ZNL-02-096. Serving as the IMiD control, 1 μM of pomalidomide did not affect phosphorylation of CDK1 Y15, apoptosis, or levels of DNA damage (Fig. 3A). These data indicate that ZNL-02-096 induces the same downstream effects as AZD1775, but at 10-fold lower doses, likely because the degrader’s catalytic turnover enables efficacy at lower doses than the inhibitor.
Figure 3 |. ZNL-02-096 induces DNA damage, apoptosis, and premature mitosis.

(A) Immunoblot analysis of MOLT4 cells treated with the ZNL-02-096, ZNL-02-178, AZD1775, or pomalidomide for 24 hrs. (B) MOLT4 cells treated with ZNL-02-096, ZNL-02-178, or AZD1775 for the indicated time points and stained with propidium iodide. Reported as mean ± SEM for n=3 biological replicates; (C) Parental or CRBN−/− MOLT4 cells treated with ZNL-02-096, ZNL-02-178, AZD1775, or Lenalidomide for 24 hrs and stained with propidium iodide. Reported as mean ± SEM for n=3 biological replicates.
Treatment with 100 nM of ZNL-02-096 increased the proportion of MOLT4 cells in G2/M in a time-dependent manner, measured by propidium iodide (PI) staining, while an equivalent dose of ZNL-02-178 or AZD1775 did not appreciably affect the cell cycle (Fig. 3B). Mirroring the concentration-dependence of the downstream signalling effects (Fig. 3A), a 10-fold higher dose of AZD1775 (1 μM) was needed to elicit the same cell cycle changes as 100 nM of ZNL-02-096. Furthermore, the G2/M accumulation mediated by 100 nM of ZNL-02-096 was absent in CRBN−/− MOLT4 cells, highlighting a requirement for CRBN-dependent degradation (Fig. 3C).
To assess whether this cell cycle phenotype was extensible to other cancer cell lines, we tested ZNL-02-096, ZNL-02-178, and AZD1775 in triple-negative breast cancer (TNBC) and ovarian cancer cell lines using an image-based method to assay changes in cell cycle state(Hafner et al., 2016). In the TNBC (BT549, HCC1806) and ovarian cancer (COV362, Kuramochi, OVCAR8) cell lines tested, ZNL-02-096 induced G2/M phase accumulation at lower doses than either ZNL-02-178 or AZD1775(Fig. S2). Strikingly, neither ZNL-02-096 nor AZD1775 induced significant cell cycle changes in the non-transformed mammary epithelial cell line, MCF10A, indicating a cancer cell line-dependent sensitivity to Wee1 loss(Fig. S2). This agrees with previous reports that normal cells are protected from AZD1775-induced DNA damage and toxicity due to low basal replication stress(Fang et al., 2019).
Collectively, these data reveal that ZNL-02-096 (100 nM) treatment leads to loss of pCDK1 Y15, increased apoptosis and unrepaired DNA damage, and G2/M phase accumulation in a CRBN-dependent manner. The requirement for CRBN engagement was shown by: 1) rescue upon treatment with ZNL-02-178, which cannot engage CRBN, and 2) rescue upon treatment of ZNL-02-096 in MOLT4 CRBN−/− cells. AZD1775 treatment induced the same downstream phenotypes as ZNL-02-096, but only at higher doses.
ZNL-02-096 Induces CRBN-Dependent Antiproliferative Effects and Synergizes with Olaparib
We next profiled the antiproliferative activity of ZNL-02-096. In MOLT4 cells, ZNL-02-096 exhibited slightly enhanced cytotoxicity as compared to AZD1775 (ZNL-02-096 IC50 = 390 nM; AZD1775 IC50 = 800 nM), while ZNL-02-178 was significantly less potent (IC50 = 4557 nM). This shift in the IC50 values of ZNL-02-096 versus ZNL-02-178 represents the CRBN-dependent contribution to the antiproliferative activity. The CRBN-dependence was further indicated by the approximately 6-fold shift in the IC50 of ZNL-02-096 in MOLT4 CRBN−/− cells (IC50 = 2220 nM) versus in the parental cells. (Fig. 4A). Pomalidomide alone had no detectable cytotoxicity(Fig. S3), suggesting that the CRBN-dependent antiproliferative activity of ZNL-02-096 is attributable to Wee1 degradation.
Figure 4 |. ZNL-02-096 induces anti-proliferative effects and synergizes with Olaparib.

(A) Cell viability of parental or CRBN−/− MOLT4 cells treated with AZD1775, ZNL-02-096, or ZNL-02-178 for 72 hrs, using CellTiter-Glo. Plotted as mean ± SEM for n=4 replicates; (B) Cell viability of OVCAR8 cells treated with AZD1775, ZNL-02-096, or ZNL-02-178 for 72 hrs, using CellTiter-Glo. Plotted as mean ± SEM for n=4 replicates; (C) Cell viability of OVCAR8 cells co-treated with ZNL-02-096 and Olaparib, or AZD1775 and Olaparib for 72 hrs, using CellTiter-Glo. Plotted as mean ± SEM for n=4 replicates.
To more broadly profile the antiproliferative activity of ZNL-02-096, we submitted it to the PRISM platform (Broad Institute), a pooled cytotoxicity assay, to evaluate its potency against 300 suspension and hematopoietic cancer cell lines(Yu et al., 2016). We also profiled ZNL-02-178 to distinguish between CRBN-dependent and CRBN-independent effects. ZNL-02-096 exhibited sub-1 μM IC50 values in almost all of the lines tested, while ZNL-02-178 was uniformly less potent. The largest shift in potency between ZNL-02-096 and ZNL-02-178 was observed in multiple myeloma (MM) cell lines, which may be partially attributable to IKZF1/3 degradation given the therapeutic efficacy of lenalidomide in MM patients (Supp Data Set 2). In the cell lines profiled, sensitivity to ZNL-02-096 was not dependent on p53 mutational status(Fig. S3)(Chen et al., 2018; Guertin et al., 2013). These data highlight that ZNL-02-096 demonstrates single-agent antiproliferative activity against a broad range of cancer cell lines, and the CRBN-dependent contribution, as assessed by the shift in potency of ZNL-02-178, varied considerably between cell lines, which may be explained by varying expression of CRBN. Moreover, cell lines dependent on IKZF1/3 exhibited striking sensitivity to ZNL-02-096, likely due to the additional effects of IMiD-dependent IKZF1/3 degradation.
To avoid any confounding phenotypes from IKZF1/3 degradation, we chose to perform follow-up studies in ovarian cancer cell lines, which are insensitive to IKZF1/3 degradation. Furthermore, AZD1775 has demonstrated efficacy in ovarian cancer in both preclinical models and the clinic, making ovarian cancer a therapeutically relevant system in which to evaluate ZNL-02-096(Guertin et al., 2013; Zhang et al., 2017). In particular, AZD1775 is reported to enhance the sensitivity of ovarian cancer cells to the PARP inhibitor, Olaparib(Kim et al., 2015; Meng et al., 2018), and AZD1775/Olaparib combination therapy is being evaluated in a Phase 1b clinical trial(ClinicalTrials.gov). We therefore profiled ZNL-02-096 in a panel of ovarian cell lines. Notably, while ZNL-02-096 induced potent cell death in the three ovarian cancer cell lines tested (OVCAR8, COV283, and Kuramochi), it showed little cytotoxicity in the non-malignant ovarian line, OCE1, therefore showing cancer cell line-dependent antiproliferative activity(Fig. S3). ZNL-02-096 demonstrated the most potent antiproliferative activity in OVCAR8 cells, as well as the largest difference in potency relative to ZNL-02-178, so we selected this cell line for further study. After confirming that ZNL-02-096 degraded Wee1 in OVCAR8 cells, with maximal degradation observed at 100 nM(Fig. S4), we next evaluated the efficacy of ZNL-02-096 and Olaparib combination treatments. ZNL-02-096 synergized with Olaparib in OVCAR8 cells following a 72 hr treatment, with similar synergy observed upon AZD1775 and Olaparib co-treatment (Fig. 4E; Fig. S4). By contrast, ZNL-02-178 displayed less synergistic activity with Olaparib than ZNL-02-096 at low doses. Pomalidomide and Olaparib co-treatment was not synergistic, nor was pomalidomide and AZD1775 co-treatment(Fig. S4). These data highlight that ZNL-02-096 demonstrates single-agent cytotoxicity and displays CRBN-dependent synergy with Olaparib in OVCAR8 cells, suggesting a potential therapeutic value to combination therapies of PARP inhibitors and Wee1 degraders.
DISCUSSION
Despite the proven utility of Wee1 inhibition in preclinical models and the clinic, to our knowledge, small molecules that selectively induce Wee1 degradation have not been investigated previously. Given that a prior study implicated Wee1 as a degradable kinase(Huang et al., 2018) and that bifunctional degraders offer catalytic target engagement and the potential for lower dosing, we were motivated to develop Wee1 degraders. ZNL-02-096 exhibited Wee1 degradation at sub-μM doses, induced G2/M accumulation, increased unrepaired DNA damage, apoptosis, and exhibited antiproliferative activity across a panel of 300 cancer cell lines. Comparing ZNL-02-096 directly to AZD1775 showed that the degrader induced downstream changes at 10-fold lower doses than the inhibitor. Moreover, the negative control, ZNL-02-178, which inhibits Wee1 but cannot engage CRBN, enabled us to distinguish between the CRBN-dependent and CRBN-independent phenotypes of ZNL-02-096. These data suggest that targeted Wee1 degraders could be efficacious at lower doses than Wee1 inhibitors.
Selective protein degradation can be achieved with degraders that incorporate a nonselective inhibitor into their design (Jiang et al., 2019; Olson et al., 2017). Accordingly, while ZNL-02-096 maintained the same biochemical selectivity profile as AZD1775 and inhibited recombinant PLK1, cell-based assays and proteomics demonstrated that PLK1 was not degraded by ZNL-02-096(Bondeson et al., 2018). As observed for other degraders that hijack CRBN, ZNL-02-096 degraded IKZF1/3, which warrants additional medicinal chemistry efforts to eliminate this effect. However, incorporating an IMiD control in our cell-based assays enabled us to distinguish between the phenotypes of Wee1 versus IKZF1/3 degradation. Furthermore, this off-target IMiD activity could be leveraged in cancers that are sensitive to IMiDs, such as MM, which is supported by the potency of ZNL-02-096 in MM cell lines. By analogy, a degrader of BTK and IKZF1/3 showed efficacy in B-cell malignancies(Dobrovolsky et al., 2019).
Collectively, the data presented in this study justifies the evaluation of Wee1 degradation in ovarian cancer, as a monotherapy or in combination with Olaparib. We envision that ZNL-02-096 and future analogs may serve as starting points for developing therapeutic Wee1-targeted degraders, which could be broadly applicable in cancer.
SIGNIFICANCE
Wee1 kinase regulates the G2/M cell cycle checkpoint via phosphorylation and inactivation of CDK1. Given that cancer cells often have a deficient G1/S checkpoint, Wee1 inhibition can sensitize tumors to PARP inhibition and DNA-damaging therapies. Here, we describe the development and characterization of the selective Wee1 degrader, ZNL-02-096, generated by linking the clinical candidate Wee1 inhibitor, AZD1775, to the CRBN-binding ligand, pomalidomide. The CRBN-dependent pharmacology of ZNL-02-096 can be evaluated when compared to its negative control (ZNL-02-178), which cannot engage CRBN. Ultimately, we show that ZNL-02-096 induces apoptosis and G2/M accumulation at up to 10-fold lower doses than AZD1775, demonstrating that Wee1 degradation can enable efficacy at lower doses than Wee1 inhibition.
STAR METHODS
LEAD CONTACT AND MATERIALS AVIAILABILITY
Further information and requests for resources and reagents should be directed to and will be fulfilled by the Lead Contact, Nathanael S. Gray (Nathanael_Gray@dfci.harvard.edu). Requested compounds will be provided following completion of an MTA.
EXPERIMENTAL MODEL AND SUBJECT DETAILS
HCC1806 (donor sex: female), BT549 (donor sex: female), MOLT4 (donor sex: male), OVCAR8 (donor sex: female) and Kuramochi (donor sex: female) cells were maintained in RPMI (Corning, Corning, NY) supplemented with 10% fetal bovine serum (FBS) (Life Technologies, Carlsbad, CA) and 1% penicillin/streptomycin (Corning, Corning, NY). MCF10A (donor sex: female) cells were maintained in a 1:1 mix of DMEM:F12 supplemented with 5% horse serum (Life Technologies, Carlsbad, CA), 1% penicillin/streptomycin (Corning, Corning, NY), 20 ng/ml EGF (Peprotech, Rocky Hill, NJ), 500 ng/ml hydrocortisone (Sigma Aldrich, St. Louis, MO), 10 μg/ml insulin (Sigma Aldrich, St. Louis, MO), and 100 ng/ml cholera toxin (Sigma Aldrich, St. Louis, MO). COV362 (donor sex: female) cells were maintained in DMEM (Corning, Corning, NY) supplemented with 10% FBS (Life Technologies, Carlsbad, CA), 1% penicillin/streptomycin (Corning, Corning, NY) and 2mM L-glutamine (Life Technologies, Carlsbad, CA). OCE1 (donor sex: female) cells were maintained in FOMI (Wit-Fo) (PMID: 24303006) supplemented with 25 ng/ml cholera toxin (Sigma Aldrich, St. Louis, MO). All cell lines were cultured at 37 °C and 5% CO2 and were tested for the absence of Mycoplasma infection on a monthly basis.
METHOD DETAILS
Immunoblotting
Whole cell lysates for immunoblotting were prepared by pelleting cells from each cell line at 4°C (300 g) for 5 minutes. The resulting cell pellets were washed 1x with ice-cold PBS and then resuspended in RIPA lysis buffer (Sigma, cat#R0278) supplemented with protease and phosphatase inhibitor tablets (Roche cat#4906845001). Lysates were clarified at 14,000 rpm for 15 minutes at 4°C prior to quantification by BCA assay (Pierce, cat#23225). Whole cell lysates were loaded into Bolt 4–12% Bis-Tris Gels (Thermo Fisher, cat#NW04120BOX) and separated by electrophoreses at 95 V for 1.5 hours. The gels were transferred to a nitrocellulose membrane using the iBlot Gel T ransfer at P3 for 7 minutes (Thermo Fisher, cat#IB23001) and then blocked for 1 hr at room temperature in Odyssey blocking buffer (LICOR Biosciences, cat#927–50010). Membranes were probed using antibodies against the relevant proteins at 4°C overnight in 20% Odyssey Blocking Buffer in 1x TBST. Membranes were then washed three times with 1x TBST (at least 5 minutes per wash) followed by incubation with the IRDye goat anti-mouse (LICOR, cat#926–32210) or goat anti-rabbit (LICOR, cat #926–32211) secondary antibody (diluted 1:10,000) in 20% Odyssey Blocking Buffer in 1x TBST for 1 hr at room temperature. After three washes with 1x TBST (at least 5 minutes per wash), the immunoblots were visualized using the ODYSSEY Infrared Imaging System (LICOR).
Cell Viability Assays
The indicated cell lines were plated in flat bottom 384-well plates (Corning cat#3570). MOLT4 cells were plated at a density of 3,000 cells per well in 50 μL media, while OVCAR8, COV362, and Kuramochi cells were plated at a density of 750 cells per well in 50 μL media. Cells were treated the next day (except for MOLT4 cells, which were treated the same day as plating) with 0.1 μL of the indicated compounds in a four-fold dilution series using the Janus pinner. Cells were incubated with compounds for 72 hours at 37°C 5% CO2. Anti-proliferative effects were then assessed by CellTiter-Glo Luminescent Cell Viability Assay (Promega cat#G7570) according to the manufacturer’s standards, measuring luminescence using an Envision plate-reader. IC50 values were determined using a non-linear regression curve fit in GraphPad Prism 8. N=4 biological replicates were used for each treatment condition.
Cell Cycle Analysis (PI Staining)
MOLT4 cells were plated at 1.5 million cells per well in a 6-well plate, with 3 mL of media per well. Immediately after plating, cells were treated with the indicated concentrations of the indicated compound. At the indicated time points, cells were collected by transferring each well to a 15 mL conical, centrifuging (1000 rpm for 3 min), and then washing the cell pellet 3x with cold PBS. Cell pellets were then fixed with 1 mL cold 80% ethanol in PBS at 4°C overnight. The cell pellets were then washed by adding 1 mL of PBS and then centrifuging (1500 rpm for 5 minutes), followed by aspiration of the PBS/ethanol mix. Cells were resuspended in cell cycle staining solution (100 μg/mL of RNAse A (Roche, 10109169001) and 50 μg/mL propidium iodide (Life Technologies, P1304MP), diluted in PBS, and incubated for 10 minutes at room temperature. Cell cycle data was acquired by flow cytometry on a Guava easyCyte flow cytometer (Millipore) using the InCyte software. Data was analyzed using FlowJo. N=3 biological replicates were used for each treatment condition.
In Vitro Kinase Assays
LanthaScreen assays were conducted for Wee1 in a 10-point dose response as performed in the commercial assay service by Life Technologies. Z’-LYTE assays were conducted for PLK1 as performed in the commercial assay service by Life Technologies in a 10-point dose response using Km ATP concentrations.
Inhibitor Treatment and Western Blotting Experiments
MOLT4 cells were plated at 1.5 million cells per well in a 6-well plate, with 3 mL of media per well. Cells were then immediately treated with the indicated concentration of the indicated compound and incubated for the indicated amount of time. Cells were collected by transferring each well to a 15 mL conical, centrifuging (1000 rpm for 3 min), then washing the cell pellet 2x with cold PBS. Each cell pellet was then lysed in 100 μL of RIPA lysis buffer (+protease/phosphatase inhibitors). Samples were normalized and prepped in 4x LDS + 10% β-mercaptoethanol and boiled for 5 min at 95°C. Lysates were probed for specified proteins by western blotting using the Bolt system (Life Technologies).
Synergy
(a). Plate cells
OVCAR8 cells were plated at a density of 750 cells per well in 50 μL media in a white 384-well plate (Corning cat#3570).
(b). Prepare compound plates and treat cells
Each compound was plated in a 384-well plate in a 5-point, four-fold dilution curve as illustrated below (where blue is ZNL-02-096 (A, below), yellow is Olaparib (B, below), gray and white is DMSO; dark blue or yellow is the highest compound concentration, with dilutions represented by the gradations to light blue or yellow). Cells were treated the day after plating with 0.1 μL from each compound plate using the Janus pinner (ZNL-02-096 plate pinned with orientation A1 to back left (A, below); Olaparib plate pinned with orientation A1 to front right (B, below), to give the co-treatment pattern (C, below) in which green represents co-treatment regions).
(c). Incubate cells with compound
Cells were incubated with compounds for 72 hours at 37°C 5% CO2. Anti-proliferative effects were then assessed by CellTiter-Glo Luminescent Cell Viability Assay (Promega cat#G7570) according to the manufacturer’s standards, measuring luminescence using an Envision plate-reader. IC50 values were determined using a non-linear regression curve fit in GraphPad Prism 8. N=4 biological replicates were used for each treatment condition.
Proteomics
(a). Sample preparation TMT LC-MS3 mass spectrometry
MOLT4 cells were treated with DMSO or 100 nM of ZNL-02-096 for 2 or 4 hours in biological triplicates and lenalidomide in biological duplicates for 4 hours and cells were harvested by centrifugation. Lysis buffer (8 M Urea, 50 mM NaCl, 50 mM 4-(2hydroxyethyl)-1-piperazineethanesulfonic acid (EPPS) pH 8.5, Protease and Phosphatase inhibitors from Roche) was added to the cell pellets and homogenized by 20 passes through a 21 gauge (1.25 in. long) needle to achieve a cell lysate with a protein concentration between 1 – 4 mg mL-1. A micro-BCA assay (Pierce) was used to determine the final protein concentration of protein in the cell lysate. 200 μg of protein for each sample were reduced and alkylated as previously described(Donovan et al., 2018)
Proteins were precipitated using methanol/chloroform. In brief, four volumes of methanol were added to the cell lysate, followed by one volume of chloroform, and finally three volumes of water. The mixture was vortexed and centrifuged to separate the chloroform phase from the aqueous phase. The precipitated protein was washed with three volumes of methanol, centrifuged and the resulting washed precipitated protein was allowed to air dry. Precipitated protein was resuspended in 4 M Urea, 50 mM HEPES pH 7.4, followed by dilution to 1 M urea with the addition of 200 mM EPPS, pH 8. Proteins were first digested with LysC (1:50; enzyme: protein) for 12 hours at room temperature. The LysC digestion was diluted down to 0.5 M Urea with 200 mM EPPS pH 8 and then digested with trypsin (1:50; enzyme:protein) for 6 hours at 37 °C. Tandem mass t ag (TMT) reagents (Thermo Fisher Scientific) were dissolved in anhydrous acetonitrile (ACN) according to manufacturer instructions. Anhydrous ACN was added to each peptide sample to a final concentration of 30% v/v, and labeling was induced with the addition of TMT reagent to each sample at a ratio of 1:4 peptide:TMT label. The 10-plex labeling reactions were performed for 1.5 hours at room temperature and the reaction quenched by the addition of hydroxylamine to a final concentration of 0.3% for 15 minutes at room temperature. The sample channels were combined at a 1:1:1:1:1:1:1:1:1:1:1 ratio, desalted using C18 solid phase extraction cartridges (Waters) and analyzed by LC-MS for channel ratio comparison. Samples were then combined using the adjusted volumes determined in the channel ratio analysis and dried down in a speed vacuum. The combined sample was then resuspended in 1% formic acid and acidified (pH 2–3) before being subjected to desalting with C18 SPE (Sep-Pak, Waters). Samples were then offline fractionated into 96 fractions by high pH reverse-phase HPLC (Agilent LC1260) through an aeris peptide xb-c18 column (phenomenex) with mobile phase A containing 5% acetonitrile and 10 mM NH4HCO3 in LC-MS grade H2O, and mobile phase B containing 90% acetonitrile and 10 mM NH4HCO3 in LC-MS grade H2O (both pH 8.0). The 96 resulting fractions were then pooled in a non-continuous manner into 24 fractions and these fractions were used for subsequent mass spectrometry analysis.
Data were collected using an Orbitrap Fusion Lumos mass spectrometer (Thermo Fisher Scientific, San Jose, CA, USA) coupled with a Proxeon EASY-nLC 1200 LC pump (Thermo Fisher Scientific). Peptides were separated on an Easy Spray ES803 75 μm inner diameter microcapillary column (Thermo Fisher Scientific). Peptides were separated using a 190 min gradient of 6–27% acetonitrile in 1.0% formic acid with a flow rate of 350 nL/min.
Each analysis used an MS3-based TMT method as described previously(McAlister et al., 2014) The data were acquired using a mass range of m/z 340 – 1350, resolution 120,000, AGC target 5 × 10⁵, maximum injection time 100 ms, dynamic exclusion of 120 seconds for the peptide measurements in the Orbitrap. Data dependent MS2 spectra were acquired in the ion trap with a normalized collision energy (NCE) set at 35%, AGC target set to 1.8 × 10⁴ and a maximum injection time of 120 ms. MS3 scans were acquired in the Orbitrap with a HCD collision energy set to 55%, AGC target set to 2 × 10⁵, maximum injection time of 150 ms, resolution at 50,000 and with a maximum synchronous precursor selection (SPS) precursors set to 10.
(b). LC-MS data analysis
Proteome Discoverer 2.2 (Thermo Fisher) was used to for .RAW file processing and controlling peptide and protein level false discovery rates, assembling proteins from peptides, and protein quantification from peptides. MS/MS spectra were searched against a Uniprot human database (September 2016) with both the forward and reverse sequences. Database search criteria are as follows: tryptic with two missed cleavages, a precursor mass tolerance of 20 ppm, fragment ion mass tolerance of 0.6 Da, static alkylation of cysteine (57.02146 Da), static TMT labelling of lysine residues and N-termini of peptides (229.16293 Da), and variable oxidation of methionine (15.99491 Da). TMT reporter ion intensities were measured using a 0.003 Da window around the theoretical m/z for each reporter ion in the MS3 scan. Peptide spectral matches with poor quality MS3 spectra were excluded from quantitation (summed signal-to-noise across 11 channels < 200 and precursor isolation specificity < 0.5).
Reporter ion intensities were normalized and scaled using in-house scripts in the R framework (R Core Team, 2014). Statistical analysis was carried out using the limma package within the R framework(Ritchie et al., 2015).
Image-based measurement of cell viability and cell cycle perturbation (Related to Fig. S2 & Fig. S3)
Breast cancer cell lines, BT549, HCC1806, and MCF10A cells were plated at a density of 1000 cells per well in 384-well Cell Carrier plates (Perkin Elmer, Waltham, MA) using a Multidrop Combi Reagent Dispenser (Thermo Fisher Scientific, Waltham, MA) and allowed to adhere to for 24 hours prior to drug treatment. Ovarian cancer cell were platted similarly at the following densities: COV362 and OVCAR8 500 cells/well, Kuramochi 1500 cells per well and, OCE1 1000 cells per well. Cells were treated with a dilution series of the indicated drugs using a D300 Digital Dispenser (Hewlett-Packard, Palo Alto, CA). Cells were stained and fixed for analysis at the time of drug delivery and after 24, 48 or 72 hrs of incubation. Cells were pulsed for one hour with EdU (Lumiprobe, Hunt Valley, MD) and stained with 1:2000 LIVE/DEAD Far Red Dead Cell Stain (LDR) (Thermo Fisher Scientific, Waltham, MA). Cells were then fixed with 3.7% formaldehyde (Sigma Aldrich, St. Louis, MO) for 30 minutes and permeabilized with 0.5% Triton X-100 in PBS. The EdU was labeled with cy3-azide (Lumiprobe, Hunt Valley, MD) for 30 min. The cells were then blocked for one hour with Odyssey blocking buffer (LI-COR, Lincoln, NE), and stained overnight at 4°C with 2 μg/mL Hoechst 33342 (Sigma Aldrich, St. Louis, MO) and a 1:1000 dilution of anti-phospho-histone H3 (pHH3) Alexa 488 (Ser10, clone D2C8) conjugated antibody (Cell Signaling Technologies, Danvers, MA). Fixed cells were imaged with a 10x objective using an Operetta microscope and analyzed using the Columbus image data storage and analysis system (Perkin Elmer, Waltham, MA). Nuclei were segmented using Columbus software (Perkin Elmer, Waltham, MA) based on their Hoechst signal. DNA content was defined by the total Hoechst intensity within the nuclear mask to identify cells in the G1 and G2 phases of the cell cycle. The average LDR, EdU and phospho-histone H3 intensities within the nuclear masks were determined. The LDR signal was used to classify cells as live or dead, the EdU and pHH3 signals to identify S and M phase cells respectively. Cells with intermediate DNA content and no EdU signal were classified as S phase dropout cells. Live cell counts were normalized to DMSO-treated controls on the same plates to yield normalized growth rate inhibition (GR) values as described previously (Hafner et al., 2016). Experiments in breast cancer cell lines were performed as technical triplicates in biological duplicate, and as technical and biological triplicates in ovarian cancer cell lines.
Rosetta Docking
All protein docking was carried out using Rosetta 3.8 provided through SBGrid(Morin et al., 2013).Input models were downloaded from the PDB (CRBN bound lenalidomide pdb: 5fqd, chain B; Wee1 pdb: 3cr0, chain A with inhibitor, glycerol and Cl removed). Ligand parameters for lenalidomide were generated using OpenEye Omega (OpenEye Scientific) and parameter files generated using Rosetta ‘molfile_to_params.py’. Pdb structure coordinates were combined into a single file and prepared for docking using the Rosetta ‘docking_prepack_protocol’ program. Initial global docking was performed by running Rosetta ‘docking_protocol’ 80 times (total 40,000 poses) with the following command line options:
-partners A_B -dock_pert 5 25 -randomize2 -ex1 -ex2aro -nstruct 500 -beta providing the combined pdb, lenalidomide specific parameter files and database file as input.
To assess the landscape of possible low energy binding modes for Wee1, the top 200 lowest I_sc scoring docking decoys were selected. X-ray crystal structure model of Wee1 bound AZD1775 (pdb: 5v5y) was superimposed to each of the docked poses of Wee1 using Pymol ‘align’ command (The PyMOL Molecular Graphics System, Version 1.8.6.0 Schrodinger, LLC). The shortest pairwise distance between selected atoms on lenalidomide and AZD1775 (see highlighted atoms in Supplementary Figure 1) was calculated in Pymol as Euclidean distance for each of the top 200 poses. The histogram was obtained in GraphPad Prism 7 using Column Analysis - Frequency Distribution. Data analysis and statistics for all steps were performed using GraphPad Prism 7.
Chemistry Experimental Procedures
Chemical synthesis and structure validation
Starting materials, reagents and solvents were purchased from commercial suppliers and were used without further purification unless otherwise noted. All reactions were monitored using a Waters Acquity UPLC/MS system (Waters PDA eλ Detector, QDa Detector, Sample manager - FL, Binary Solvent Manager) using Acquity UPLC® BEH C18 column (2.1 × 50 formic acid in Water; solvent B = 0.1% formic acid in Acetonitrile; flow rate: 0.6mL/min. Reaction products were purified by flash column chromatography using CombiFlash®Rf with Teledyne Isco RediSep® normal-phase silica flash columns (4 g, 12 g, 24 g, 40 g or 80 g) and Waters HPLC system using SunFireTM Prep C18 column (19 × 100 mm, 5 μm particle size): solvent gradient = 80% A at 0 min, 10% A at 25 min; solvent A = 0.035% TFA in Water; solvent B = 0.035% TFA in MeOH; flow rate: 25 mL/min. 1H NMR spectra were recorded on 500 MHz Bruker Avance III spectrometers and 13C NMR spectra were recorded on 125 MHz Bruker Avance III spectrometer. Chemical shifts are reported in parts per million (ppm, δ) downfield from tetramethylsilane (TMS). Coupling constants (j) are reported in Hz. Spin multiplicities are described as br (broad), s (singlet), d (doublet), t (triplet), q (quartet) and m (multiplet).
To a solution of known intermediate 1(Matheson et al., 2016b) (220 mg, 0.6 mmol) in toluene was added m-chloroperoxybenzoic acid (145 mg, 0.65 mmol) and the reaction mixture was stirred for 1 hour. N,N-Diisopropylethylamine and aniline 2 (205 mg, 0.74 mmol) were added and the reaction mixture was stirred overnight. Sat. NaHCO3 (10 mL) was added and the mixture was extracted with EtOAc (15 mL×2). The organic phase was washed with brine, dried over MgSO4, filtered, and concentrated in vacuo. The crude material was purified via silica gel chromatography (20:1 DCM:MeOH) to afford intermediate 3 (255mg, 73%). LC-MS: m/z 587.34 [M+1]+. TFA (1 mL) was added to a solution of (3) (255 mg, 0.43 mmol) in DCM (4 mL). The reaction was stirred for 2 hours. The solvent was removed under reduced pressure to obtain the TFA salt of the Boc-deprotected amine (4). LC-MS: m/z 487.31 [M+1]+. 1H NMR (500 MHz, DMSO) δ 10.20 (s, 1H), 8.87–8.84 (m, 3H), 8.03 (t, J= 7.8 Hz, 1H), 7.73 (d, J = 7.8 Hz, 1H), 7.61 (d, J = 7.5 Hz, 3H), 6.99 (d, J = 9.0 Hz, 2H), 5.66 (ddt, J = 16.3, 10.3, 6.0 Hz, 1H), 4.99 (dd, J = 10.2, 1.2 Hz, 1H), 4.82 (dd, J = 17.1, 1.3 Hz, 1H), 4.68 (d, J = 5.4 Hz, 2H), 3.36–3.18 (m, 8H), 1.46 (s, 6H).
4-((2-(2-(2-(2-(4-(4-((2-Allyl-1-(6-(2-hydroxypropan-2-yl)pyridin-2-yl)-3-oxo-2,3-dihydro-1H-pyrazol o[3,4-d]pyrimidin-6-yl)amino)phenyl)piperazin-1-yl)ethoxy)ethoxy)ethoxy)ethyl)amino)-2-(2,6-dio xopiperidin-3-yl)isoindoline-1,3-dione (ZNL-02-047)
To a solution of Intermediate (4) (35 mg, 0.073 mmol) in DMF(1.5mL) was added tert-Butyl (2-(2-(2-(2-bromoethoxy)ethoxy)ethoxy)ethyl)carbamate (28 mg, 0.08 mmol) and K2CO3 (20 mg, 0.15 mmol). The mixture was heated at 60°C for 6 h. Then allowing the reaction to cool to room temperature, the solution was dissolved in water and ethyl acetate. The mixture extracted with EtOAc (3 × 10 ml). The organic extract was washed with brine (20 ml), dried over MgSO4, and concentrated under reduced pressure. The residue was purified via silica gel chromatography (10:1 DCM: MeOH) to give compound (5) (44 mg, 80 % yield). LC-MS: m/z 762.46 [M+1]+. Intermediate (5) (22 mg, 0.03 mmol) was dissolved in DCM (2 mL). TFA (0.5 mL) was added and the mixture was stirred for 30 minutes. The solvent was removed under reduced pressure and the residue was dissolved in DMSO (1 mL). 2-(2,6-dioxopiperidin-3-yl)-4-fluoroisoindoline-1,3-dione (8) (10 mg, 0.035 mmol) and N, N-diisopropylethylamine (15 μL, 0.09 mmol) were added, and the mixture was stirred at 90 °C for 3 h. The mixture was purified by HPLC (10–90% MeOH in H2O) to give TFA salt ZNL-02-047 (8 mg, 30%) as a yellow solid. LC-MS: m/z 918.46 [M+1]+.
1H NMR (500 MHz, DMSO) δ 11.11 (s, 1H), 10.20 (s, 1H), 9.75 (s, 1H), 8.85 (s, 1H), 8.03 (t, J = 7.8 Hz, 1H), 7.76 (d, J = 7.9 Hz, 1H), 7.62 (d, J = 7.6 Hz, 3H), 7.57 (dd, J = 8.4, 7.2 Hz, 1H), 7.13 (d, J = 8.6 Hz, 1H), 7.04 (d, J = 7.0 Hz, 1H), 6.99 (d, J = 9.0 Hz, 2H), 6.60 (s, 1H), 5.67 (ddt, J = 16.3, 10.3, 6.0 Hz, 1H), 5.06 (dd, J = 12.8, 5.4 Hz, 1H), 5.00 (dd, J = 10.2, 1.1 Hz, 1H), 4.83 (dd, J = 17.1, 1.2 Hz, 1H), 4.69 (d, J = 4.8 Hz, 2H), 3.80 – 3.75 (m, 5H), 3.64 –3.57 (m, 12H), 3.49 – 3.44 (m, 2H), 3.39 (s, 2H), 3.22 (d, J = 9.8 Hz, 2H), 3.01 (t, J = 11.9 Hz, 2H), 2.89 (ddd, J = 17.1, 14.0, 5.4 Hz, 1H), 2.65 – 2.53 (m, 1H), 2.06 – 1.98 (m, 1H), 1.47 (s, 6H).
13C NMR (125 MHz, DMSO) δ 173.29, 171.19, 170.57, 169.45, 168.12, 167.75, 161.54, 160.90, 158.64, 158.37, 156.56, 147.54, 146.87, 145.90, 139.26, 136.73, 132.66, 132.57, 121.71, 118.73, 117.92, 116.75, 111.20, 109.73, 72.79, 70.15, 69.99, 69.36, 67.29, 53.92, 51.38, 49.04, 47.04, 46.61, 42.17, 40.59, 36.59, 36.10, 31.46, 30.93, 24.45, 22.61.
4-((6-(4-(4-((2-Allyl-1-(6-(2-hydroxypropan-2-yl)pyridin-2-yl)-3-oxo-2,3-dihydro-1H-pyrazolo[3,4-d] pyrimidin-6-yl)amino)phenyl)piperazin-1-yl)hexyl)amino)-2-(2,6- dioxopiperidin-3-yl)isoindoline-1,3-dione (ZNL-02-040)
To a solution of Intermediate (4) (35 mg, 0.073 mmol) in DMF (1.5mL) was added tert-Butyl (6-bromohexyl) carbamate (24 mg, 0.08 mmol) and K2CO3 (20 mg, 0.15 mmol). The mixture was heated at 60°C for 6 h. Then allowing the reaction to cool to room temperature, the solution was dissolved in water and ethyl acetate. The mixture extracted with EtOAc (3 × 10 ml). The organic extract was washed with brine (20 ml), dried over MgSO4, and concentrated under reduced pressure. The residue was purified via silica gel chromatography (10:1 DCM: MeOH) to give compound (6) (37 mg, 75 % yield). LC-MS: m/z 686.47 [M+1]+. Intermediate (6) (20 mg, 0.03 mmol) was dissolved in DCM (2 mL). TFA (0.5 mL) was added and the mixture was stirred for 30 minutes. The solvent was removed under reduced pressure and the residue was dissolved in DMSO (1 mL).
2-(2,6-dioxopiperidin-3-yl)-4-fluoroisoindoline-1,3-dione (8) (10 mg, 0.035 mmol) and N, N-diisopropylethylamine (15 μL, 0.09 mmol) were added, and the mixture was stirred at 90 °C for 3 h. The mixture was purified by HPLC (10–90% MeOH in H2O) to give TFA salt ZNL-02-040 (10 mg, 39%) as a yellow solid. LC-MS: m/z 842.52 [M+1]+.
1H NMR (500 MHz, DMSO) δ 11.08 (s, 1H), 10.13 (s, 1H), 8.82 (s, 1H), 8.04 (s, 1H), 7.75 (s, 1H), 7.59 (dd, J = 14.7, 7.4 Hz, 4H), 7.09 (d, J = 8.5 Hz, 1H), 7.02 (d, J = 7.0 Hz, 1H), 6.90 (d, J = 8.5 Hz, 2H), 6.53 (s, 1H), 5.66 (dd, J = 16.6, 10.4 Hz, 1H), 5.33 (s, 1H), 5.04 (dd, J = 12.7, 5.2 Hz, 1H), 4.99 (d, J = 10.1 Hz, 1H), 4.82 (d, J = 17.2 Hz, 1H), 4.67 (s, 2H), 3.07 (s, 5H), 2.87 (dd, J = 21.4, 8.8 Hz, 1H), 2.60 – 2.53 (m, 1H), 2.29 (d, J = 6.5 Hz, 2H), 2.11 – 1.95 (m, 1H), 1.59 (s, 2H), 1.46 (s, 6H), 1.42 – 1.21 (m, 6H).
13C NMR (125 MHz, DMSO) δ 173.28, 170.57, 169.44, 167.78, 161.64, 160.98, 156.47, 147.71, 146.92, 139.29, 136.77, 132.68, 131.25, 121.62, 118.73, 117.68, 116.75, 115.92, 110.86, 109.49, 72.79, 58.30, 53.28, 49.16, 49.02, 47.07, 42.29, 40.59, 40.43, 40.26, 40.09, 31.46, 30.93, 29.12, 27.16, 26.70, 22.64.
4-((3-(4-(4-((2-Allyl-1-(6-(2-hydroxypropan-2-yl)pyridin-2-yl)-3-oxo-2,3-dihydro-1H-pyrazolo[3,4-d] pyrimidin-6-yl)amino)phenyl)piperazin-1-yl)propyl)amino)-2-(2,6-dioxopiperidin-3-yl)isoindoline-1,3-dione (ZNL-02-096)
To a solution of Intermediate (4) (100 mg, 0.2 mmol) in DMF (2 mL) was added tert-Butyl (3-bromopropyl) carbamate (60 mg, 0.24 mmol) and K2CO3 (55 mg, 0.4 mmol). The mixture was heated at 60°C for 6 h. Then allowing the reaction to cool to room temperature, the solution was dissolved in water and ethyl acetate. The mixture extracted with EtOAc (3 × 10 ml). The organic extract was washed with brine (20 ml), dried over MgSO4, and concentrated under reduced pressure. The residue was purified via silica gel chromatography (10:1 DCM: MeOH) to give compound (7) (110 mg, 85 % yield). LC-MS: m/z 644.44 [M+1]+. Intermediate (7) (30 mg, 0.04 mmol) was dissolved in DCM (2 mL). TFA (0.5 mL) was added and the mixture was stirred for 30 minutes. The solvent was removed under reduced pressure and the residue was dissolved in DMSO (1 mL). 2-(2,6-dioxopiperidin-3-yl)-4-fluoroisoindoline-1,3-dione (8) (15 mg, 0.055 mmol) and N, N-diisopropylethylamine (20 μL, 0.12 mmol) were added, and the mixture was stirred at 90 °C for 3 h. The mixture was purified by HPLC (10–90% MeOH in H2O) to give TFA salt ZNL-02-096 (11 mg, 35%) as a yellow solid. LC-MS: m/z 800.52 [M+1]+.
1H NMR (500 MHz, DMSO) δ 11.10 (s, 1H), 10.72 (s, 1H), 10.21 (s, 1H), 8.84 (s, 1H), 8.04 (t, J = 7.6 Hz, 1H), 7.75 (d, J = 8.0 Hz, 1H), 7.67 – 7.57 (m, 4H), 7.18 (d, J = 8.6 Hz, 1H), 7.06 (d, J = 7.0 Hz, 1H), 7.00 (d, J = 9.0 Hz, 2H), 6.78 (s, 1H), 5.66 (ddt, J = 16.4, 10.3, 6.0 Hz, 1H), 5.06 (dd, J = 12.7, 5.4 Hz, 1H), 5.02 – 4.96 (m, 1H), 4.82 (dd, J = 17.1, 1.1 Hz, 1H), 4.73 – 4.61 (m, 2H), 3.82 – 3.64 (m, 3H), 3.62 – 3.52 (m, 2H), 3.52 – 3.36 (m, 3H), 3.22 – 3.08 (m, 6H), 2.89 (ddd, J = 16.9, 13.9, 5.4 Hz, 1H), 2.66 – 2.53 (m, 2H), 2.15 – 1.98 (m, 3H), 1.46 (s, 6H).
13C NMR (125 MHz, DMSO) δ 173.29, 170.57, 169.21, 168.11, 167.76, 163.49, 161.53, 161.40, 160.88, 156.51, 147.51, 146.55, 145.96, 139.28, 136.78, 132.77, 132.66, 132.44, 121.69, 118.73, 117.81, 116.80, 116.70, 111.17, 109.94, 72.88, 72.79, 72.63, 70.99, 70.39, 68.08, 65.64, 63.27, 63.20, 60.65, 60.61, 53.72, 51.16, 49.03, 47.03, 46.36, 31.46, 30.93, 23.63, 22.65.
tert-Butyl3-(2-(2-(2-(2,6-dioxopiperidin-3-yl)-1,3-dioxoisoindolin-4-ylamino)ethoxy)ethoxy) propanoate (10)
To a solution of 2-(2,6-dioxopiperidin-3-yl)-4-fluoroisoindoline-1,3-dione (8) (0.4 g, 4.3 mmol) and NH2-PEG2-t-Bu (9) (0.25 g, 4.3 mmol) in DMF (10 mL) was added N, N-Diisopropylethylamine (2.5 mL). The solution was heated at 90°C for 2 hours, then c ooled, diluted with water (15 mL) and acidified to pH 4–5 with 10% KHSO4. The mixture was extracted with ethyl acetate (3 × 20 mL) and the combined organic extracts washed with brine, dried over anhydrous sodium sulfate and concentrated in vacuo. The residue was purified by silica chromatography (2:1 petroleum ether: EtOAc) to give compound 10 (120 mg, 23% yield) as a yellow solid.
1H NMR (400 MHz, CDCl3): δ 8.09 (s, 1H), 7.49 (m, 1H), 7.10 (d, 1H), 6.92 (d, 1H), 4.92 (m, 1H), 3.72 (m, 4H), 3.64 (m, 4H), 3.46 (t, 2H), 2.67~2.94 (m, 3H), 2.51 (t, 2H), 2.13 (m, 1H), 1.44 (s, 9H). LC-MS: m/z 512.17 [M+23]+.
3-(2-(2-((2-(2,6-Dioxopiperidin-3-yl)-1,3-dioxoisoindolin-4-yl)amino)ethoxy)ethoxy) propanoic acid (11)
To a solution of tert-butyl3-(2-(2-(2-(2,6-dioxopiperidin-3-yl)-1,3-dioxoisoindolin-4-ylamino)ethoxy)ethoxy)propanoate (185 mg, 0.38 mmol) in DCM (5 mL) was added TFA (1.5 mL) and the solution was stirred for 2 hours. The solvent was removed under reduced pressure to give compound 11 (150 mg, 94% yield) as a yellow solid.
1H NMR (400 MHz, CDCl3): δ 8.62 (s, 1H), 7.48 (m, 1H), 7.10 (d, 1H), 6.91 (d, 1H), 6.54 (br s, 1H), 4.93 (m, 1H), 3.77 (t, 2H), 3.73 (t, 2H), 3.67 (s, 4H), 3.46 (t, 2H), 2.86 (m, 1H), 2.77 (m, 2H), 2.65 (t, 2H), 2.13 (m, 1H). LC-MS: m/z 434.25 [M+1]+.
To a solution of intermediate 7 (20mg, 0.03 mmol) in DCM (2 mL) was added TFA (0.5 mL). The reaction was stirred for 1 hour. The solvent was removed to give the title compound as the TFA salt. HATU (23 mg, 0.06 mmol) 3-(2-(2-((2-(2,6-dioxopiperidin-3-yl)-1,3-dioxoisoindolin-4-yl)amino)ethoxy)ethoxy) propanoic acid 11 (13 mg, 0.03 mmol) and diisopropylethylamine (28 μL, 0.15 mmol) were added to a solution of the TFA salt in DMF (1.5 mL). The reaction was stirred for 1 h and the mixture was purified by HPLC (10–90% MeOH in H2O) to give TFA salt ZNL-02-012 (23 mg, 82%) as a yellow solid. LC-MS: m/z 959.70 [M+1]+.
1H NMR (500 MHz, DMSO) δ 11.02 (s, 1H), 10.13 (s, 1H), 9.44 (s, 1H), 8.78 (s, 1H), 8.04 – 7.85 (m, 2H), 7.68 (d, J = 8.1 Hz, 1H), 7.51 (ddd, J = 23.5, 13.9, 8.4 Hz, 3H), 7.07 (d, J = 8.6 Hz, 1H), 7.04 – 6.88 (m, 3H), 6.53 (s, 1H), 5.60 (ddt, J = 16.3, 10.3, 6.0 Hz, 1H), 5.04 – 4.87 (m, 2H), 4.76 (dd, J = 17.1, 1.3 Hz, 1H), 4.61 (d, J = 5.2 Hz, 2H), 3.72 (d, J = 12.4 Hz, 2H), 3.59 – 3.35 (m, 12H), 3.08 (m, 6H), 2.95 – 2.73 (m, 3H), 2.58 – 2.46 (m, 2H), 2.27 (t, J = 6.4 Hz, 2H), 2.01 – 1.88 (m, 1H), 1.82 – 1.71 (m, 2H), 1.39 (s, 6H).
13C NMR (125 MHz, DMSO) δ 173.29, 171.19, 170.57, 169.45, 168.12, 167.75, 161.54, 160.90, 158.64, 158.37, 156.56, 147.54, 146.87, 145.90, 139.26, 136.73, 132.66, 132.57, 121.71, 118.73, 117.92, 116.75, 111.20, 109.73, 72.79, 70.15, 69.99, 69.36, 67.29, 53.92, 51.38, 49.04, 47.04, 46.61, 42.17, 40.59, 40.43, 40.26, 40.09, 36.59, 36.10, 31.46, 30.93, 24.45, 22.61.
To DMF (3mL) was added NaH 60% (21mg, 0.54mmol), then 2-(2,6-dioxopiperidin-3-yl)-4-fluoroisoindoline-1,3-dione 8 (100mg, 0.36mmol) was dissolved in DMF (1 mL) was dropped at 0°C, the mixture was stirred for 15 minutes, Mel (35uL, 0.54mmol) was added and the mixture was stirred for 8 h warming to room temperature. The mixture was diluted with EtOAc (20 mL) and water (30mL), and extracted with EtOAc (3 × 10 mL). The organic extract was washed with brine (20 ml), dried (MgSO4) and concentrated under reduced pressure, and the residue was purified via silica gel chromatography (DCM: MeOH =10:1) to give 4-fluoro-2-(1-methyl-2,6-dioxopiperidin-3-yl) isoindoline-1,3-dione (80 mg, 76 % yield). LC-MS: m/z 291.09 [M+1]+.
To a solution of Intermediate (7) (40 mg, 0.05 mmol) was in DCM (2 mL) was added TFA (0.5 mL) and the resulting solution was stirred for 30min at room temperature. The solvent was removed under reduced pressure and the residue was dissolved in DMSO (1 mL).
4-Fluoro-2-(1-methyl-2,6-dioxopiperidin-3-yl)isoindoline-1,3-dione (12) (28 mg, 0.078 mmol) and N, N-diisopropylethylamine (40 μL, 0.22 mmol) were added, and the mixture was stirred at 90 °Cfor 3 h.
The mixture was purified by HPLC (10–90% MeOH in H2O) to give TFA salt ZNL-02-178 (15 mg, 37%) as a yellow solid. LC-MS: m/z 814.46 [M+1]+.
1H NMR (500 MHz, DMSO) δ 10.22 (s, 1H), 9.68 (s, 1H), 8.84 (s, 1H), 8.03 (t, J = 7.8 Hz, 1H), 7.75 (d, J = 8.0 Hz, 1H), 7.70 – 7.57 (m, 4H), 7.17 (d, J = 8.6 Hz, 1H), 7.08 (d, J = 7.0 Hz, 1H), 7.00 (d, J = 8.9 Hz, 2H), 6.80 (d, J = 5.7 Hz, 1H), 5.66 (ddd, J = 16.4, 11.0, 6.0 Hz, 1H), 5.14 (dd, J = 13.0, 5.4 Hz, 1H), 4.99 (d, J = 10.2 Hz, 1H), 4.82 (d, J = 17.1 Hz, 1H), 4.68 (d, J = 4.8 Hz, 2H), 3.80 (d, J = 12.5 Hz, 2H), 3.62 (d, J = 11.3 Hz, 2H), 3.43 (d, J = 6.0 Hz, 2H), 3.31 – 3.09 (m, 4H), 3.02 (s, 3H), 3.00 – 2.87 (m, 3H), 2.77 (dd, J = 13.4, 2.9 Hz, 1H), 2.62 – 2.53 (m, 1H), 2.11 – 1.93 (m, 3H), 1.46 (s, 6H).
13C NMR (125 MHz, DMSO) δ 172.29, 170.33, 169.21, 168.12, 167.71, 161.54, 161.45, 160.89, 158.60, 158.32, 156.55, 147.54, 146.55, 145.91, 139.25, 136.82, 132.78, 132.66, 132.52, 118.73, 117.76, 116.72, 111.24, 109.95, 72.79, 53.82, 51.36, 49.60, 47.04, 40.59, 40.42, 40.25, 40.17, 40.09, 31.59, 30.93, 27.08, 23.79, 21.89.
QUANTIFICATION AND STATISTICAL ANALYSIS
For all experiments, the number of replicates and error bars are described in the respective figure legends. All biological experiments were performed at least twice.
Antiproliferation Assay
IC50 values were determined using a non-linear regression curve fit in GraphPad Prism. N=4 biological replicates were used for each treatment condition. Values are reported as mean +/– SEM, as also indicated in the figure legends
FACS
Data were analyzed using FlowJo. N=3 biological replicates were used for each treatment condition. Bar height represents mean percentage of cells in each cell cycle phase, and error bars represent SEM, as also indicated in figure legends.
DATA AND CODE AVAILABILITY
The published article includes all datasets generated during this study.
Supplementary Material
Data S2. Proteomics output from limma processing of MOLT4 cells treated for 2 hours with ZNL-02-096 vs DMSO control. Related to Figure 2.
Data S3. NMR Spectra of compounds. Related to Figure 1
Scheme 1:

2-Allyl-1-(6-(2-hydroxypropan-2-yl)pyridin-2-yl)-6-((4-(piperazin-1-yl)phenyl)amino)-1,2-dihydro-3 H-pyrazolo[3,4-d]pyrimidin-3-one (4)
Scheme 2:

Synthesis of ZNL-02-040, ZNL-02-047 and ZNL-02-096
Scheme 3:

Synthesis of 3-(2-(2-((2-(2,6-Dioxopiperidin-3-yl)-1,3-dioxoisoindolin-4-yl)amino)ethoxy)ethoxy) propanoic acid (11):
Scheme 4:

Synthesis of N-(3-(4-(4-((2-allyl-1-(6-(2-hydroxypropan-2-yl)pyridin-2-yl)-3-oxo-2,3-dihydro-1H-pyrazolo[3,4-d] pyrimidin-6-yl)amino)phenyl)piperazin-1-yl)propyl)-3-(2-(2-((2-(2,6-dioxopiperidin-3-yl)-1,3-dioxoi soindolin-4-yl)amino)ethoxy)ethoxy)propenamide (ZNL-02-012):
Scheme 5:

Synthesis of 4-Fluoro-2-(1-methyl-2,6-dioxopiperidin-3-yl)isoindoline-1,3-dione (12):
Scheme 6:

Synthesis of 4-((3-(4-(4-((2-allyl-1-(6-(2-hydroxypropan-2-yl)pyridin-2-yl)-3-oxo-2,3-dihydro-1H-pyrazolo[3,4-d] pyrimidin-6-yl)amino)phenyl)piperazin-1-yl)propyl)amino)-2-(1-methyl-2,6-dioxopiperidin-3-yl)is oindoline-1,3-dione (ZNL-02-178):
Highlights.
A selective Wee1 degrader was generated by conjugating pomalidomide to AZD1775
Wee1 degradation induced G2/M accumulation at lower doses than Wee1 inhibition
Wee1 degradation synergized with Olaparib in ovarian cancer cells
ACKNOLWEDGEMENTS
We thank the Gray lab for helpful discussions and M. Kostic and B. Nabet for providing feedback on the manuscript. This work was supported by the NIH F31 Fellowship CA225066 (B.J.P), the NIH Training Grants 5 T32 GM007306-41 and 5 T32 GM095450-04 (B.J.P), the Chleck Family Foundation (B.J.P., Z.M.D.), the NIH/NCI Grant HL127365 (to P.K.S. and N.S.G.), and the NIH R01 CA218278 01A1 (N.S.G., E.S.F.).
COMPETING FINANCIAL INTERESTS
N.S.G. is a Scientific Founder and member of the Scientific Advisory Board (SAB) of C4 Therapeutics, Syros, Soltego, B2S, Gatekeeper and Petra Pharmaceuticals and has received research funding from Novartis, Astellas, Taiho and Deerfield. E.S.F. is a founder, SAB, and/or equity holder of C4 and Civetta and consults for Novartis, AbbVie and Deerfield. The Fischer lab receives/has received funding from Novartis, Deerfield and Astellas. P.K.S. is a founder, SAB member and equity holder in Merrimack Pharmaceutical and Glencoe Software; member of Board of Directors of Applied Biomath and SAB of RareCyte Inc. P.K.S. declares that none of these relationships are related to the content of this manuscript. B.J.P, Z.L., D.A.S., E.S.F., C.O., R.P.N., K.A.D. and N.S.G are inventors on a patent application related to the Wee1 degraders described here.
Footnotes
Publisher's Disclaimer: This is a PDF file of an unedited manuscript that has been accepted for publication. As a service to our customers we are providing this early version of the manuscript. The manuscript will undergo copyediting, typesetting, and review of the resulting proof before it is published in its final form. Please note that during the production process errors may be discovered which could affect the content, and all legal disclaimers that apply to the journal pertain.
REFERENCES
- Beck H, Nahse-Kumpf V, Larsen MSY, O’Hanlon KA, Patzke S, Holmberg C, Mejlvang J, Groth A, Nielsen O, Syljuasen RG, et al. (2012). Cyclin-Dependent Kinase Suppression by WEE1 Kinase Protects the Genome through Control of Replication Initiation and Nucleotide Consumption. Mol Cell Biol 32, 4226–4236. [DOI] [PMC free article] [PubMed] [Google Scholar]
- Bondeson DP, Smith BE, Burslem GM, Buhimschi AD, Hines J, Jaime-Figueroa S, Wang J, Hamman BD, Ishchenko A, and Crews CM (2018). Lessons in PROTAC Design from Selective Degradation with a Promiscuous Warhead. Cell Chem Biol 25, 78–87 e5. [DOI] [PMC free article] [PubMed] [Google Scholar]
- Carrassa L, and Damia G (2017). DNA damage response inhibitors: Mechanisms and potential applications in cancer therapy. Cancer treatment reviews 60, 139–151. [DOI] [PubMed] [Google Scholar]
- Chamberlain PP, Lopez-Girona A, Miller K, Carmel G, Pagarigan B, Chie-Leon B, Rychak E, Corral LG, Ren YJ, Wang M, et al. (2014). Structure of the human Cereblon-DDB1-lenalidomide complex reveals basis for responsiveness to thalidomide analogs. Nat Struct Mol Biol 21, 803–809. [DOI] [PubMed] [Google Scholar]
- Chanan-Khan AA, Swaika A, Paulus A, Kumar SK, Mikhael JR, Rajkumar SV, Dispenzieri A, and Lacy MQ (2013). Pomalidomide: the new immunomodulatory agent for the treatment of multiple myeloma. Blood Cancer J 3, e143. [DOI] [PMC free article] [PubMed] [Google Scholar]
- Chen D, Lin X, Gao J, Shen L, Li Z, Dong B, Zhang C, and Zhang X (2018). Wee1 Inhibitor AZD1775 Combined with Cisplatin Potentiates Anticancer Activity against Gastric Cancer by Increasing DNA Damage and Cell Apoptosis. BioMed research international 2018, 5813292. [DOI] [PMC free article] [PubMed] [Google Scholar]
- Di Rora AGL, Beeharry N, Imbrogno E, Ferrari A, Robustelli V, Righi S, Sabattini E, Falzacappa MVV, Ronchini C, Testoni N, et al. (2018). Targeting WEE1 to enhance conventional therapies for acute lymphoblastic leukemia. J Hematol Oncol 11, 99. [DOI] [PMC free article] [PubMed] [Google Scholar]
- Do K, Wilsker D, Ji J, Zlott J, Freshwater T, Kinders RJ, Collins J, Chen AP, Doroshow JH, and Kummar S (2015). Phase I Study of Single-Agent AZD1775 (MK-1775), a Wee1 Kinase Inhibitor, in Patients With Refractory Solid Tumors. Journal of clinical oncology : official journal of the American Society of Clinical Oncology 33, 3409–3415. [DOI] [PMC free article] [PubMed] [Google Scholar]
- Dobrovolsky D, Wang ES, Morrow S, Leahy C, Faust T, Nowak RP, Donovan KA, Yang G, Li ZN, Fischer ES, et al. (2019). Bruton tyrosine kinase degradation as a therapeutic strategy for cancer. Blood 133, 952–961. [DOI] [PMC free article] [PubMed] [Google Scholar]
- Donovan KA, An J, Nowak RP, Yuan JTC, Fink EC, Berry BC, Ebert BL, and Fischer ES (2018). Thalidomide promotes degradation of SALL4, a transcription factor implicated in Duane Radial Ray syndrome. Elife 7, e38430. [DOI] [PMC free article] [PubMed] [Google Scholar]
- Fang Y, McGrail DJ, Sun CY, Labrie M, Chen XH, Zhang D, Ju ZL, Vellano CP, Lu YL, Li YS, et al. (2019). Sequential Therapy with PARP and WEE1 Inhibitors Minimizes Toxicity while Maintaining Efficacy. Cancer Cell 35, 851–867.e7. [DOI] [PMC free article] [PubMed] [Google Scholar]
- Fu S, Wang Y, Keyomarsi K, Meric-Bernstam F, and Meric-Bernstein F (2018). Strategic development of AZD1775, a Wee1 kinase inhibitor, for cancer therapy. Expert opinion on investigational drugs 27, 741–751. [DOI] [PubMed] [Google Scholar]
- Guertin AD, Li J, Liu Y, Hurd MS, Schuller AG, Long B, Hirsch HA, Feldman I, Benita Y, Toniatti C, et al. (2013). Preclinical Evaluation of the WEE1 Inhibitor MK-1775 as Single-Agent Anticancer Therapy. Molecular cancer therapeutics 12, 1442–1452. [DOI] [PubMed] [Google Scholar]
- Hafner M, Niepel M, Chung M, and Sorger PK (2016). Growth rate inhibition metrics correct for confounders in measuring sensitivity to cancer drugs. Nature Methods 13, 521. [DOI] [PMC free article] [PubMed] [Google Scholar]
- Hirai H, Iwasawa Y, Okada M, Arai T, Nishibata T, Kobayashi M, Kimura T, Kaneko N, Ohtani J, Yamanaka K, et al. (2009). Small-molecule inhibition of Wee1 kinase by MK-1775 selectively sensitizes p53-deficient tumor cells to DNA-damaging agents. Molecular cancer therapeutics 8, 2992–3000. [DOI] [PubMed] [Google Scholar]
- Huang HT, Dobrovolsky D, Paulk J, Yang G, Weisberg EL, Doctor ZM, Buckley DL, Cho JH, Ko E, Jang J, et al. (2018). A Chemoproteomic Approach to Query the Degradable Kinome Using a Multi-kinase Degrader. Cell Chem Biol 25, 88–99.e6. [DOI] [PMC free article] [PubMed] [Google Scholar]
- Jiang B, Wang ES, Donovan KA, Liang Y, Fischer ES, Zhang T, and Gray NS (2019). Development of Dual and Selective Degraders of Cyclin-Dependent Kinases 4 and 6. Angewandte Chemie 58, 6321–6326. [DOI] [PMC free article] [PubMed] [Google Scholar]
- Kim G, Ison G, Mckee AE, Zhang H, Tang SH, Gwise T, Sridhara R, Lee E, Tzou A, Philip R, et al. (2015). FDA Approval Summary: Olaparib Monotherapy in Patients with Deleterious Germline BRCA-Mutated Advanced Ovarian Cancer Treated with Three or More Lines of Chemotherapy. Clin Cancer Res 21, 4257–4261. [DOI] [PubMed] [Google Scholar]
- Krönke J, Hurst SN, and Ebert BL (2014). Lenalidomide induces degradation of IKZF1 and IKZF3. Oncoimmunology 3, e941742. [DOI] [PMC free article] [PubMed] [Google Scholar]
- Leijen S, van Geel R, Pavlick A, Tibes R, Rosen L, Razak AR, Lam R, Demuth T, Rose S, Lee M, et al. (2016). Phase I study evaluating WEE1 inhibitor AZD1775 as monotherapy and in combination with gemcitabine, Cisplatin, or Carboplatin in patients with advanced solid tumors. J. Clin. Oncol. 34, 4371–4380. [DOI] [PMC free article] [PubMed] [Google Scholar]
- Matheson CJ, Backos DS, and Reigan P (2016a). Targeting WEE1 Kinase in Cancer. Trends Pharmacol Sci 37, 872–881. [DOI] [PubMed] [Google Scholar]
- Matheson CJ, Casalvieri KA, Backos DS, and Reigan P (2018). Development of Potent Pyrazolopyrimidinone-Based WEE1 Inhibitors with Limited Single-Agent Cytotoxicity for Cancer Therapy. Chemmedchem 13, 1681–1694. [DOI] [PMC free article] [PubMed] [Google Scholar]
- Matheson CJ, Venkataraman S, Amani V, Harris PS, Backos DS, Donson AM, Wempe MF, Foreman NK, Vibhakar R, and Reigan P (2016b). A WEE1 Inhibitor Analog of AZD1775 Maintains Synergy with Cisplatin and Demonstrates Reduced Single-Agent Cytotoxicity in Medulloblastoma Cells. ACS chemical biology 11, 921–930. [DOI] [PubMed] [Google Scholar]
- McAlister GC, Nusinow DP, Jedrychowski MP, Wuhr M, Huttlin EL, Erickson BK, Rad R, Haas W, and Gygi SP (2014). MultiNotch MS3 enables accurate, sensitive, and multiplexed detection of differential expression across cancer cell line proteomes. Analytical chemistry 86, 7150–7158. [DOI] [PMC free article] [PubMed] [Google Scholar]
- Meng XB, Bi JL, Li YJ, Yang SJ, Zhang YP, Li M, Liu HT, Li YY, Mcdonald ME, Thiel KW, et al. (2018). AZD1775 Increases Sensitivity to Olaparib and Gemcitabine in Cancer Cells with p53 Mutations. Cancers 10, 149. [DOI] [PMC free article] [PubMed] [Google Scholar]
- Morin A, Eisenbraun B, Key J, Sanschagrin PC, Timony MA, Ottaviano M, and Sliz P (2013). Collaboration gets the most out of software. Elife 2, e01456. [DOI] [PMC free article] [PubMed] [Google Scholar]
- National Institutes of Health. AZD1775 Combined with Olaparib in Patients with Refractory Solid Tumors. Available at https://clinicaltrials.gov/ct2/show/NCT02511795 Accessed November 10, 2019.
- Nowak RP, DeAngelo SL, Buckley D, He ZX, Donovan KA, An J, Safaee N, Jedrychowski MP, Ponthier CM, Ishoey M, et al. (2018). Plasticity in binding confers selectivity in ligand-induced protein degradation. Nature Chemical Biology 14, 706–714. [DOI] [PMC free article] [PubMed] [Google Scholar]
- Olson CM, Jiang B, Erb MA, Liang Y, Doctor ZM, Zhang Z, Zhang T, Kwiatkowski N, Boukhali M, Green JL, et al. (2017). Pharmacological perturbation of CDK9 using selective CDK9 inhibition or degradation. Nature Chemical Biology 14, 163–170. [DOI] [PMC free article] [PubMed] [Google Scholar]
- Pettersson M, and Crews CM (2019). PROteolysis TArgeting Chimeras (PROTACs) - Past, present and future. Drug discovery today Technologies 31, 15–27. [DOI] [PMC free article] [PubMed] [Google Scholar]
- Ritchie ME, Phipson B, Wu D, Hu Y, Law CW, Shi W, and Smyth GK (2015). limma powers differential expression analyses for RNA-sequencing and microarray studies. Nucleic acids research 43, e47. [DOI] [PMC free article] [PubMed] [Google Scholar]
- R Core Team. (2014). R: A language and environment for statistical computing. https://www.R-project.org/
- Schmidt M, Rohe A, Platzer C, Najjar A, Erdmann F, and Sippl W (2017). Regulation of G2/M Transition by Inhibition of WEE1 and PKMYT1 Kinases. Molecules 22, 2045. [DOI] [PMC free article] [PubMed] [Google Scholar]
- Toure M, and Crews CM (2016). Small-Molecule PROTACS: New Approaches to Protein Degradation. Angewandte Chemie 55, 1966–1973. [DOI] [PubMed] [Google Scholar]
- Winter GE, Buckley DL, Paulk J, Roberts JM, Souza A, Dhe-Paganon S, and Bradner JE (2015). Phthalimide conjugation as a strategy for in vivo target protein degradation. Science 348, 1376–1381. [DOI] [PMC free article] [PubMed] [Google Scholar]
- Winter GE, Mayer A, Buckley DL, Erb MA, Roderick JE, Vittori S, Reyes JM, di Iulio J, Souza A, Ott CJ, et al. (2017). BET Bromodomain Proteins Function as Master Transcription Elongation Factors Independent of CDK9 Recruitment. Molecular Cell 67, 5–18.e19. [DOI] [PMC free article] [PubMed] [Google Scholar]
- Wright G, Golubeva V, Remsing Rix LL, Berndt N, Luo Y, Ward GA, Gray JE, Schonbrunn E, Lawrence HR, Monteiro ANA, et al. (2017). Dual Targeting of WEE1 and PLK1 by AZD1775 Elicits Single Agent Cellular Anticancer Activity. ACS chemical biology 12, 1883–1892. [DOI] [PMC free article] [PubMed] [Google Scholar]
- Yu CN, Mannan AM, Yvone GM, Ross KN, Zhang YL, Marton MA, Taylor BR, Crenshaw A, Gould JZ, Tamayo P, et al. (2016). High-throughput identification of genotype-specific cancer vulnerabilities in mixtures of barcoded tumor cell lines. Nat Biotechnol 34, 419–423. [DOI] [PMC free article] [PubMed] [Google Scholar]
- Zhang MH, Dominguez D, Chen SQ, Fan J, Qin L, Long A, Li X, Zhang Y, Shi HR, and Zhang B (2017). WEE1 inhibition by MK1775 as a single-agent therapy inhibits ovarian cancer viability. Oncol Lett 14, 3580–3586. [DOI] [PMC free article] [PubMed] [Google Scholar]
Associated Data
This section collects any data citations, data availability statements, or supplementary materials included in this article.
Supplementary Materials
Data S2. Proteomics output from limma processing of MOLT4 cells treated for 2 hours with ZNL-02-096 vs DMSO control. Related to Figure 2.
Data S3. NMR Spectra of compounds. Related to Figure 1
Data Availability Statement
The published article includes all datasets generated during this study.