

Abstract
Objective
To derive and validate a model of risk of septic shock among children with suspected sepsis, using data known in the electronic health record at hospital arrival.
Study design
This observational cohort study at 6 pediatric emergency department and urgent care sites used a training dataset (5 sites, April 1, 2013, to December 31, 2016), a temporal test set (5 sites, January 1, 2017 to June 30, 2018), and a geographic test set (a sixth site, April 1, 2013, to December 31, 2018). Patients 60 days to 18 years of age in whom clinicians suspected sepsis were included; patients with septic shock on arrival were excluded. The outcome, septic shock, was systolic hypotension with vasoactive medication or ≥30 mL/kg of isotonic crystalloid within 24 hours of arrival. Elastic net regularization, a penalized regression technique, was used to develop a model in the training set.
Results
Of 2464 included visits, septic shock occurred in 282 (11.4%). The model had an area under the curve of 0.79 (0.76–0.83) in the training set, 0.75 (0.69–0.81) in the temporal test set, and 0.87 (0.73–1.00) in the geographic test set. With a threshold set to 90% sensitivity in the training set, the model yielded 82% (72%−90%) sensitivity and 48% (44%−52%) specificity in the temporal test set, and 90% (55%−100%) sensitivity and 32% (21%−46%) specificity in the geographic test set.
Conclusions
This model estimated the risk of septic shock in children at hospital arrival earlier than existing models. It leveraged the predictive value of routine electronic health record data through a modern predictive algorithm and has the potential to enhance clinical risk stratification in the critical moments before deterioration.
Septic shock is a state of cardiovascular dysfunction owing to severe infection in which survival depends on early diagnosis and time-sensitive, resource-intensive resuscitation.1,2 Pediatric guidelines recommend treatment before hypotensive shock, but clinicians often fail to recognize early sepsis in time to prevent deterioration to septic shock.3,4 The importance of improving pediatric septic shock diagnosis has been recognized by pediatric leaders who ranked improving detection of pediatric sepsis as a top safety research priority and sepsis researchers, who prioritized improving early differentiation of patients at risk for shock.5,6 Pediatric guidelines recommend the use of sepsis screening tools, however existing tools rely on assessment of physical examination findings with low inter-rater reliability, and have not been tested outside of tertiary emergency departments (EDs) staffed by subspecialty pediatric emergency physicians.7,8 Standardized diagnostic strategies are particularly needed in emergency care settings without pediatric specialization, where most children receive emergency care.9
No models exist to predict the risk of shock upon arrival to the ED, a critical time point for intervention. Existing predictive scores in pediatric septic shock have limited applicability to early diagnosis and treatment because they use data including laboratory results gathered over hours or days, and predict the more distant outcome of mortality.10,11
We sought to model the risk of hypotensive septic shock among patients with sepsis suspected by ED clinicians. We used only variables known upon arrival and ascertainment of the first vital signs. The goal of the model was to establish a predicted probability of shock.
Methods
This was an observational cohort study to develop and validate a predictive model. The objective of this study was to develop a model of the risk of hypotensive septic shock among patients in whom sepsis was suspected by clinicians, using only variables known upon arrival, and to validate the model by testing model performance in 2 distinct test sets. We followed the transparent reporting of a multivariable prediction model for individual prognosis or diagnosis (TRIPOD) guidelines.12
The study took place at 6 sites in Colorado, comprised of pediatric ED, urgent care, and dual-track ED/urgent care sites with >150 000 annual visits combined. Providers included pediatric emergency physicians, pediatricians, nurse practitioners, and physician assistants. At these sites, a suspected sepsis pathway was activated as soon as there was concern for possible sepsis based on history, physical examination findings, or comorbidities. As described elsewhere in this article, to encourage early identification of possible sepsis, a diverse spectrum of care could be initiated after activation of the pathway ranging from close observation to full sepsis treatment, including antibiotics, fluid resuscitation, and admission.13 Thus, the pathway was initiated in many patients who were initially concerning but later differentiated themselves, representing a larger and less severely ill cohort of patients than those treated in many severe sepsis pathways.7,14 Pathway activations comprised approximately 0.05% of all patients presenting to the sites. Clinical criteria for use of the suspected sepsis pathway were based on American College of Critical Care Medicine guidelines, as well as the presence of high-risk conditions (Table I; available at www.jpeds.com).3,15
Table I.
Institutional clinical guidelines used to initiate evaluation for potential or confirmed sepsis
| Fever or clinical scenario consistent with infection and any of the following: | |
|---|---|
| Confirmed severe sepsis/septic shock | High risk for sepsis |
| Hypotension | Immunosuppressed, immunocompromised |
| Altered mental status | Central venous catheter |
| New need for positive pressure ventilation | Abnormally prolonged capillary refill time |
| Lactate ≥4 mmol/L | Weak peripheral pulses |
| Acute kidney injury | Purpura, petechiae or erythroderma |
| Disseminated intravascular coagulation, new thrombocytopenia | Orthostasis |
| New hepatic dysfunction | |
| Acute need for a resuscitation room | |
Patients 60 days to 18 years old were included; patients who arrived already in hypotensive septic shock, based on having a hypotensive first systolic blood pressure with a bolus or vasoactive agent initiated in the first 30 minutes, were excluded. To avoid excessive influence of a small number of individual patients with frequent visits on the model, only 1 visit per individual patient was included in the datasets analyzed. To accurately represent the mixture of first, middle, and last visits that a single patient might have for sepsis, the included visit was randomly chosen for each patient who had multiple visits in the sepsis dataset. Patients who were transferred from the Children’s Hospital Colorado system to a hospital outside of the 6 sites or incomplete visits (left before formal evaluation or incorrect registration) were excluded. Medical management was unaltered by the study.
We used an electronic health record (EHR) registry, including patients with clinically suspected sepsis at 6 pediatric emergency care sites. Patients were identified by the suspected sepsis pathway timestamp in the EHR. Additionally, standardized monthly chart review of patients admitted to the intensive care unit was used to identify and include missed cases of septic shock in the dataset.
Data were extracted from the Epic Clarity database (Epic Systems Corporation, Verona, Wisconsin), imported into REDCap, and loaded monthly to update longitudinal variables. A de-identified dataset was exported to SAS 9.4 (SAS, Cary, North Carolina) for data management and R 3.5.2 (R Foundation for Statistical Computing, Vienna, Austria) for analysis.16 Data collected included vital signs, patient history, laboratory results, treatments, and hospital course.
The quality registry was approved by Children’s Hospital Colorado Quality Improvement Research Program; analysis of this dataset for research was approved by the Colorado Multiple Institution Review Board, with a waiver of informed consent.
Outcomes
The primary outcome measure, hypotensive septic shock, was defined as systolic hypotension per American College of Critical Care Medicine definitions within the first 24 hours of ED arrival, plus administration of either vasoactive medication or ≥30 mL/kg of isotonic crystalloids (1500 mL in patients weighing ≥50 kg), within the first 24 hours.15 This outcome was chosen because it included an objective physiologic finding and the need for resuscitative care within a meaningful timeframe of ED arrival, and because the goal was to include not only patients with refractory shock, but also patients in whom early treatment may have prevented a more severe shock state. Although 30 mL/kg is less than is currently recommended for shock resuscitation, it represents a clinical decision to give more than a single bolus. In concert with hypotension, this factor suggests a potential early shock state that is temporally proximate enough to ED arrival that early detection and treatment would have potential to improve outcomes.1,2 A secondary outcome of hypotension with vasoactive use was also evaluated.
Outcomes were assessed using data in the registry extracted from the EHR. The lowest systolic blood pressure within the first 24 hours of care determined whether hypotension occurred, and the medication administration record was used to determine administration of vasoactive agents and isotonic crystalloid solutions. Outcomes were classified before construction of the model.
Predictor Variables
We identified potential predictor variables known at ED arrival based on biologic plausibility, availability, and published literature. These variables included patient demographics, medical characteristics, and vital signs (Table II). Medical characteristics ascertained from the EHR included chronic complex condition in existing International Classification of Diseases, 10th edition, codes in the patient problem list; prior hospitalizations, ascertained from records of prior visits; and the presence of a central line, ascertained from the documentation in the blood culture laboratory order.17 We created interaction terms to consider for inclusion in the model based on biologically meaningful interactions, including age, heart rate, respiratory rate, and blood pressure.
Table II.
Final model for the prediction of septic shock among patients in whom ED clinicians were concerned for sepsis at the time of ED arrival*
| Predictive variables | Log odds increase in septic shock probability with each unit increase in predictor |
|---|---|
| Intercept | 1.6415501 |
| Systolic blood pressure, mm Hg | −0.0228011 |
| Piecewise diastolic blood pressure term† | 0.0235015 |
| If ≥ 69 mm Hg, set to 0 | |
| If < 69 mm Hg, set to 69–Diastolic Blood Pressure | |
| Temperature, °C | −0.0561305 |
| Age, years × respiratory rate, breaths per minute | 0.0011637 |
| Age, years × shock index, beat per minute/mm Hg*,‡ | 0.0645130 |
| Arrival via Emergency Medical Services | 0.1394753 |
| Oncological comorbidity§ | −0.7875011 |
| Indwelling central line present on arrival | −0.0857997 |
| Hospitalized in the last year | −0.1473406 |
| Predictors that were evaluated and not included in the final model (zero coefficient) were heart rate, beats per minute; respiratory rate, breaths per minute; pulse oximetry oxygen saturation, %; weight, kg; (weight, kg) squared; pulse pressure, mm Hg¶; shock index, beat per minute/mm Hg¶; Temperature-corrected heart rate,** beats per minute; age, years × heart rate, beats per minute; Age, years × systolic blood pressure, mm Hg; Age, years × temperature, °C; Age, years × diastolic blood pressure, mm Hg; Temperature, °C × respiratory rate, breaths per minute; temperature, °C × shock index, beat per minute/mm Hgb; Age, years × temperature, °C × heart rate, beats per minute; age, years × temperature, °C × respiratory rate, breaths per minute; female; chronic complex condition§; number of hospitalizations in the last year; ever hospitalized in intensive care; hospitalized in intensive care in the last year; respiratory viral season††; and triage level. | |
The model is a linear predictor that estimates the log odds of septic shock, using the sum of the intercept and the predictors multiplied by their coefficient. To transform the odds of septic shock to a probability, use the transformation exB/(1+exB).
Diastolic blood pressure was modeled with a piecewise linear term reflecting an inflection in its association with the outcome.
Shock index = Heart Rate/Systolic Blood Pressure.
Chronic complex conditions were defined using Feudtner International Classification of Diseases, 9th and 10th edition codes.17
Pulse pressure = Systolic Blood Pressure-Diastolic Blood Pressure.
Temperature-corrected heart rate = Heart Rate–(T-38) × 10.
Respiratory season was defined as months from November through April, based on local historical incidence of respiratory syncytial virus and influenza.
Analysis and Missing Data
To address missing data, first, missing electronically abstracted data that could be corrected with chart review was corrected. Missing weights and triage levels were manually abstracted using growth curves and clinical notes. Missing oxygen saturations were assigned a value of 100%, following conventions of risk scores in sepsis, which assumed normal in unmeasured variables.18 However, any additional vital signs that were not recorded could not be approximated, and were considered truly missing. Fewer than 5% of the overall study population were missing predictors or outcome variables, and these cases were excluded.
Three datasets were created from the registry, such that each dataset contained unique visits. To increase the external validity of the validation step, 2 distinct test sets were created, based on 2 different types of non-random data splits, a TRIPOD type 2b, or pseudoexternal, validation strategy.12 The datasets were a training set, from 5 sites, including a tertiary pediatric ED, 3 pediatric urgent care sites, and 1 dual-track ED/urgent care site, with visits from April 1, 2013, to December 31, 2016; a temporal holdout test set from the 5 original sites from January 1, 2017, to June 30, 2018; and a geographic holdout test set from a sixth site, a pediatric community-based ED, from April 1, 2013, to June 30, 2018.
Before fitting the models, exploratory analyses assessed the relationships between the covariates and the outcome. Piecewise and polynomial transformations were used where appropriate. We used elastic net regularization to model the predicted probability of hypotensive septic shock given the covariates, using the glmnet package in R.19 We used ensr to choose alpha and lambda, the tuning parameters, such that deviance was minimized, which uses 10-fold cross-validation.20 Two models were considered: the model that minimized deviance and a second parsimonious model that achieved similar deviance. To choose the number of parameters in the parsimonious model, we generated a model 500 times in ensr, using a randomly generated grouping for cross-validation for each run. We plotted the mean minimal deviance by the number of parameters in the model, and chose the number where further gains in error reduction with additional parameters were limited (Figure 1; available at www.jpeds.com) using the mean alpha and lambda for that number of parameters that produced the minimal deviances. To internally validate the model, we evaluated the performance of the model in the training set, evaluating the area under the receiver operating characteristic (AUROC) curve and calibration plots.
Figure 1.
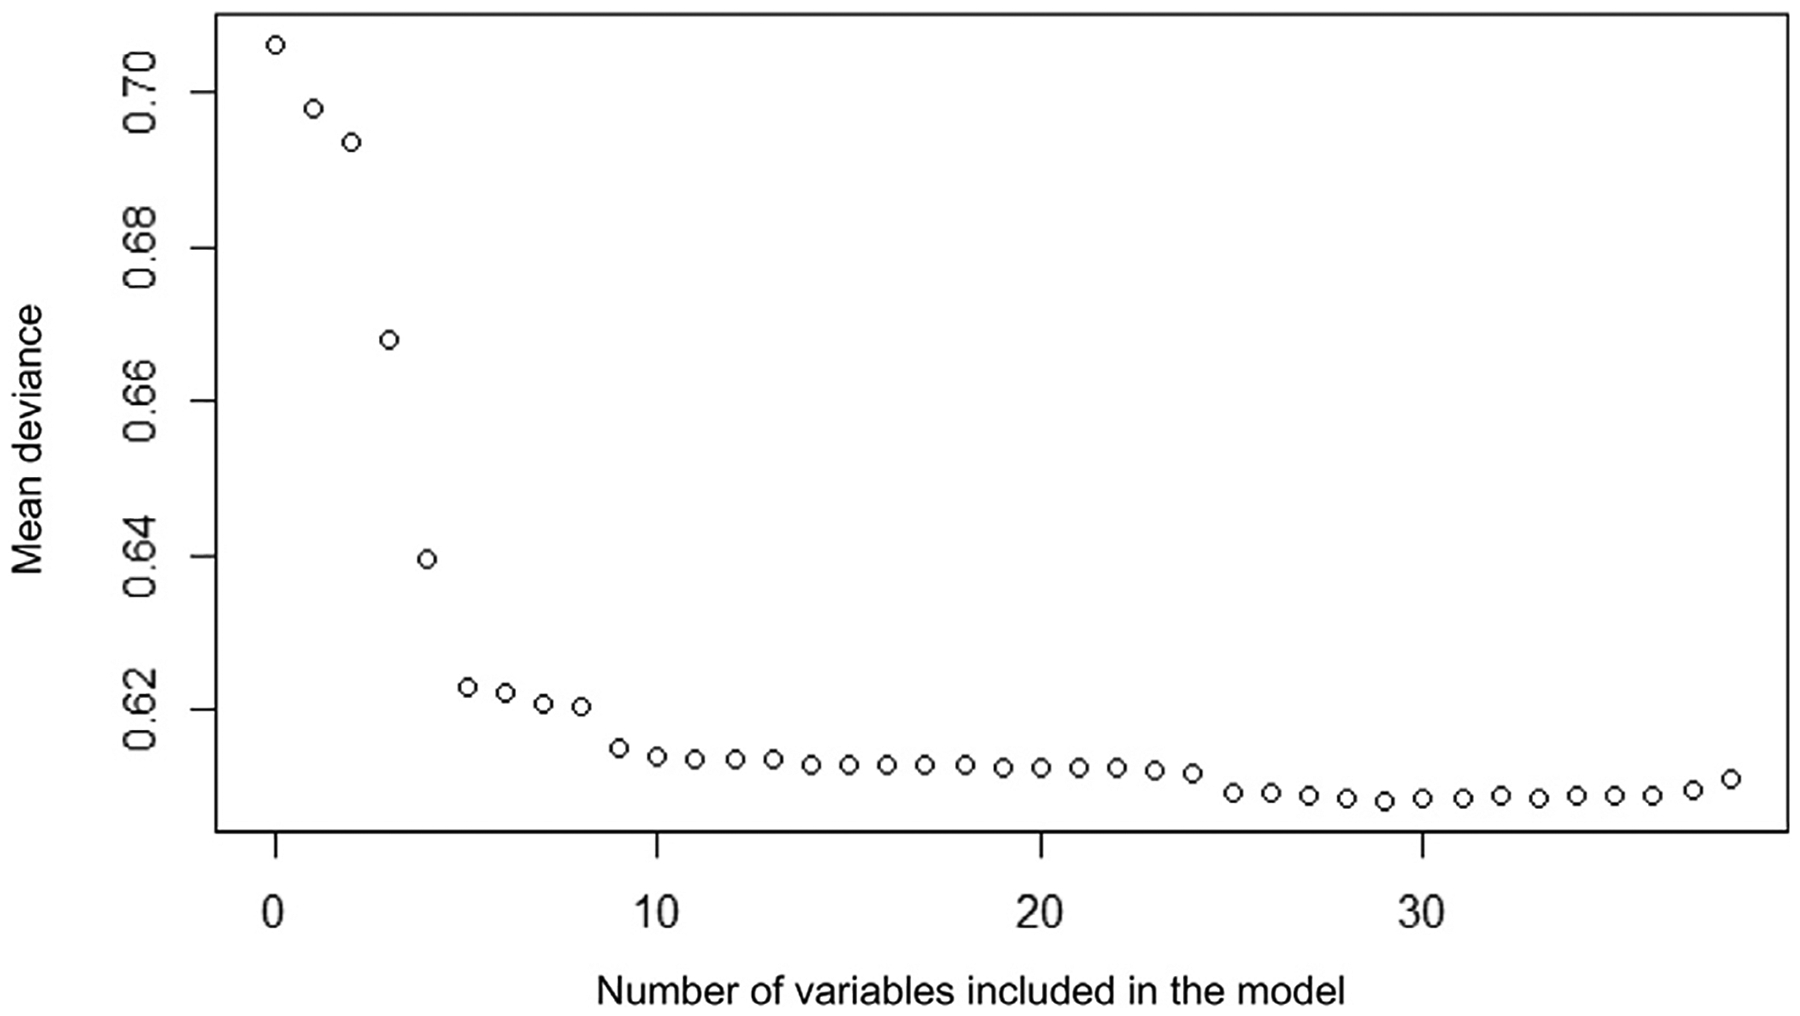
Mean deviance of cross-validated model compared with the number of variables included in the model.
We calculated 2 classification thresholds in the training set. We used Youden’s J statistic to identify the threshold that optimized sensitivity and specificity, and we chose a threshold that produced 90% sensitivity. We chose this threshold to prioritize sensitivity, based on existing pediatric sepsis diagnostic tools with 81%−94% sensitivity in academic EDs.7,8 At both thresholds, we evaluated the sensitivity, specificity, positive predictive value and negative predictive value, calculating Clopper-Pearson exact CI.21
To validate the model, AUROC and calibration plots were used to evaluate discrimination and calibration. At the thresholds of risk determined in the training set, we evaluated test characteristics of the models. Precision recall curves were generated for the model.
Results
Of 4686 total visits in the registry during the study dates, 2464 were retained after applying exclusion criteria (Figure 2; available at www.jpeds.com). Fewer than 5% of all visits had missing data for predictors or outcomes; these were excluded from analysis (Table III; available at www.jpeds.com). The outcome of hypotensive septic shock in the first 24 hours occurred in 282 patients (11.4%). Although subjects were similar in many characteristics in all datasets, the population in the geographic test set had a higher proportion of patients with private payer health insurance and fewer with chronic complex conditions compared with the training set (Table IV).
Figure 2.
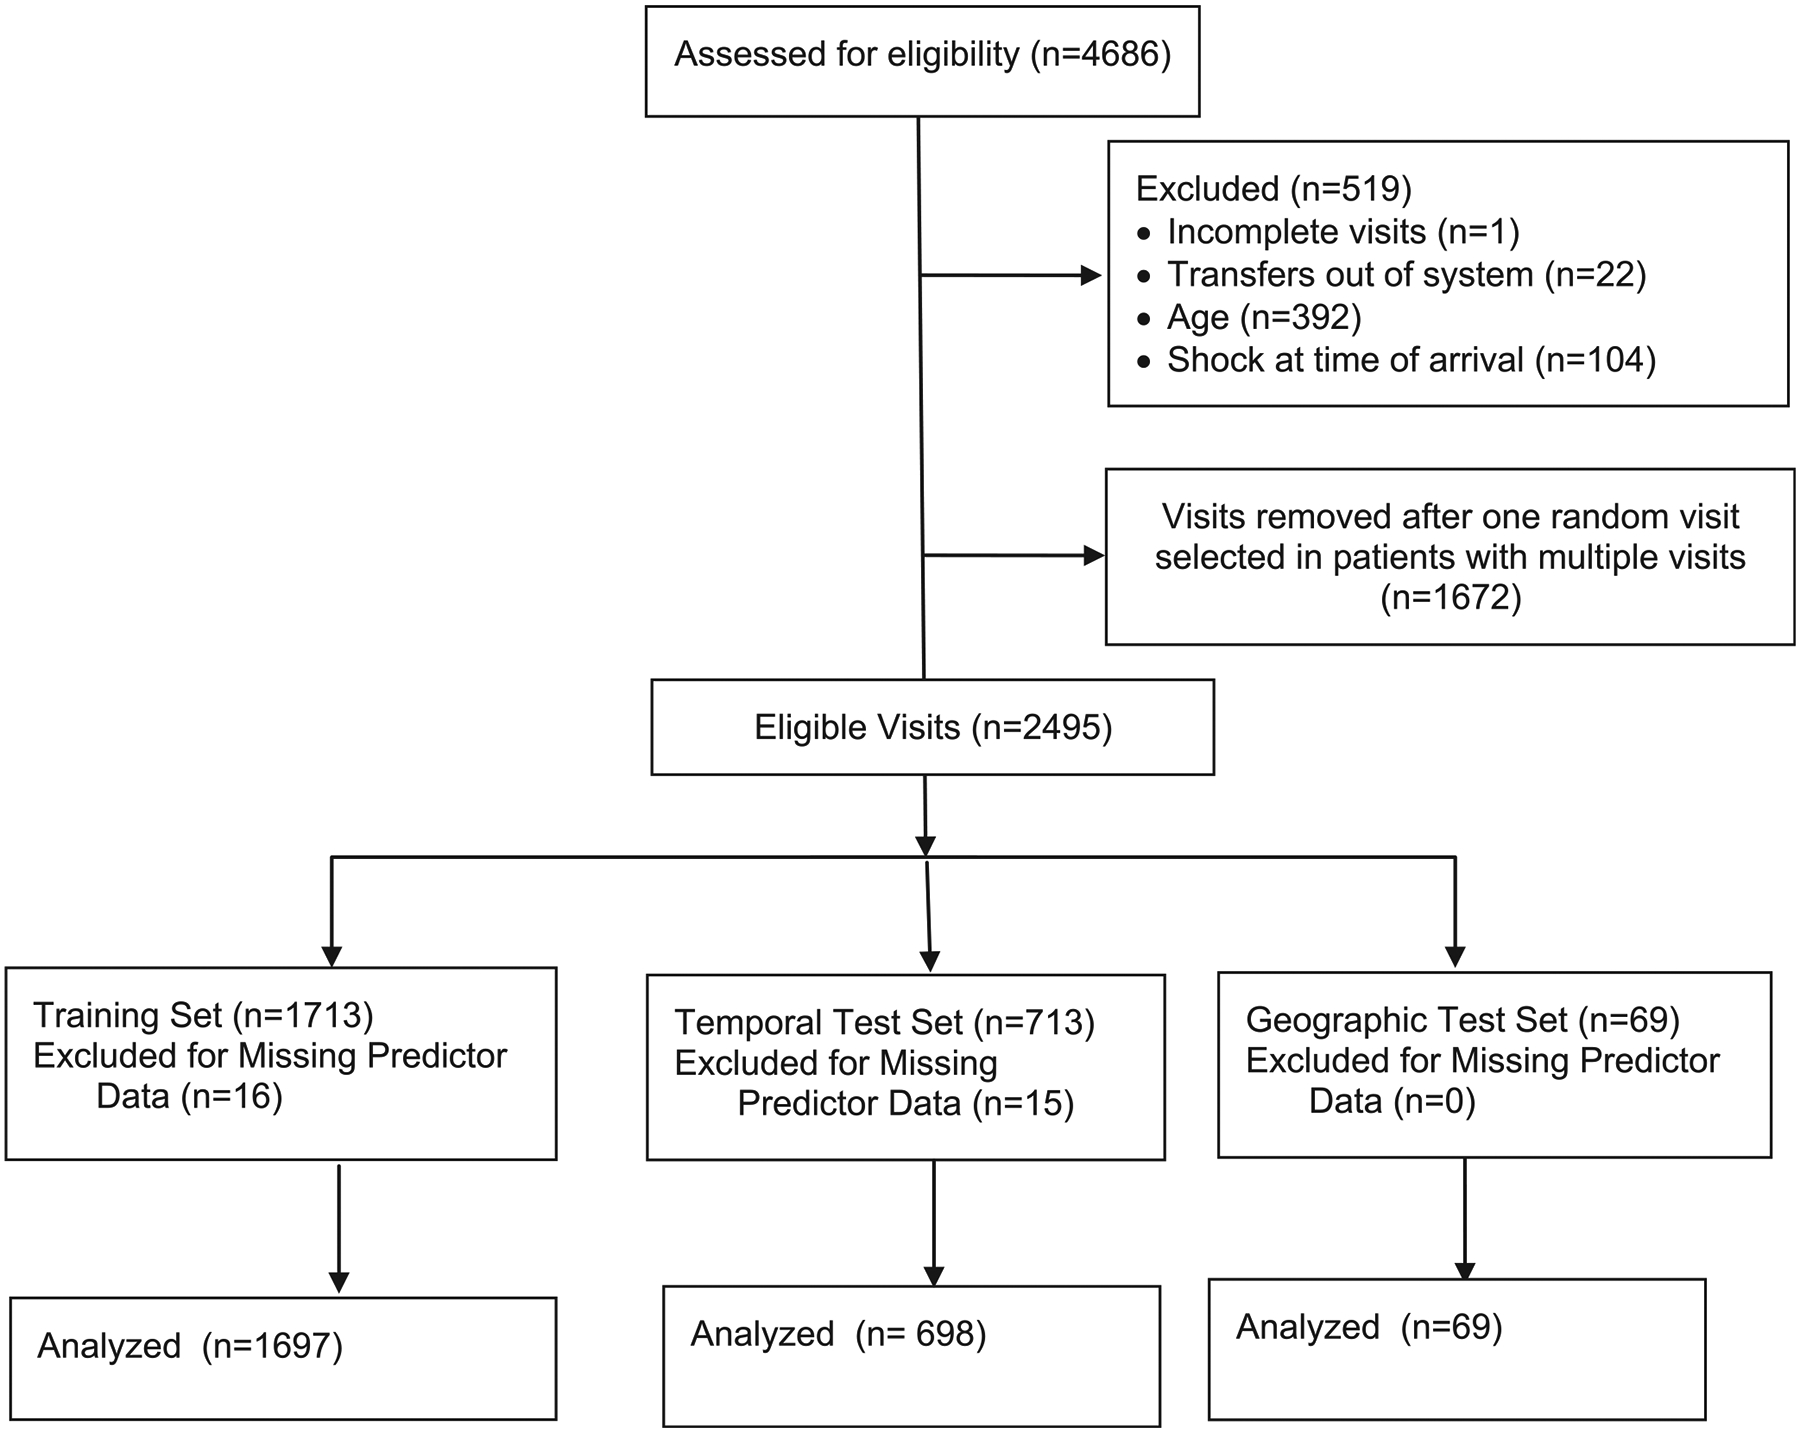
Study flow diagram.
Table III.
Rates of missingness of predictor and outcome data*
| Variables | Training set (n = 1713) | Temporal test set (n = 713) | Geographic test set (n = 69) |
|---|---|---|---|
| Predictive variables | |||
| Respiratory rate | 1 (0) | 5 (1) | 0 (0) |
| Heart rate | 1 (0) | 7 (1) | 0 (0) |
| Oxygen saturation by pulse oximetry | 12 (1) | 5 (1) | 1 (1) |
| Temperature | 0 (0) | 5 (1) | 0 (0) |
| Weight | 0 (0) | 0 (0) | 0 (0) |
| Diastolic blood pressure | 16 (1) | 6 (1) | 0 (0) |
| Systolic blood pressure | 16 (1) | 6 (1) | 0 (0) |
| Age | 0 (0) | 0 (0) | 0 (0) |
| Sex | 0 (0) | 0 (0) | 0 (0) |
| Chronic complex condition† | 0 (0) | 0 (0) | 0 (0) |
| Oncological comorbidity† | 0 (0) | 0 (0) | 0 (0) |
| Central line present on arrival | 0 (0) | 0 (0) | 0 (0) |
| Hospitalized in the last year | 0 (0) | 0 (0) | 0 (0) |
| No. of hospitalizations in the last year | 0 (0) | 0 (0) | 0 (0) |
| Ever hospitalized in intensive care | 0 (0) | 0 (0) | 0 (0) |
| Triage level | 0 (0) | 0 (0) | 0 (0) |
| Respiratory season | 0 (0) | 0 (0) | 0 (0) |
| Arrival via emergency medical services | 7 (0) | 0 (0) | 0 (0) |
| Variables used in assessing outcome | |||
| ED antibiotics‡ | 0 (0) | 0 (0) | 0 (0) |
| Vasoactive use‡ | 0 (0) | 0 (0) | 0 (0) |
| Total fluid volume in 24 hours‡ | 0 (0) | 0 (0) | 0 (0) |
Values are number (%).
All visits with these variables missing were excluded from analysis.
These variables were considered to not be present if the chronic complex condition International Classification of Diseases, 9th or 10th edition codes did not appear in the EHR problem list, and thus could not be considered missing.17
These variables were considered to not have been given if the assigned medications did not appear in the medical administration record, and thus could not be considered missing.
Table IV.
Study population
| Characteristics | Training set (n = 1697) | Temporal test set (n = 698) | Geographic test set (n = 69) |
|---|---|---|---|
| Primary outcome, hypotensive septic shock | 192 (11) | 80 (11) | 10 (14) |
| Minutes after arrival of first hypotension | 193 (85–434) | 175 (81–479) | 27 (0–261) |
| Male | 926 (55) | 353 (51) | 34 (49) |
| Age | 5.9 (2.1–12.2) | 5.6 (2.1–12.5) | 6.0 (2.7–13.4) |
| Private payer health insurance | 725 (43) | 292 (42) | 44 (64) |
| Chronic complex condition* | 1000 (59) | 417 (60) | 16 (23) |
| Central venous line present on arrival | 364 (21) | 131 (19) | 2 (3) |
| Arrived via emergency medical services | 218 (13) | 82 (12) | 11 (16) |
| Hospitalized in the last year | 870 (51) | 378 (54) | 12 (17) |
| No. of hospitalizations in the last year in patients with hospitalizations | 2.0 (1.0–4.0) | 2.0 (1.0–4.0) | 1.0 (1.0–1.3) |
| Intensive care unit hospitalization ever | 601 (35) | 224 (32) | 6 (9) |
| Intensive care unit hospitalization in the last year | 371 (22) | 151 (22) | 3 (4) |
| ED disposition | |||
| Home | 456 (27) | 205 (29) | 18 (26) |
| Inpatient ward or operating room | 845 (50) | 342 (49) | 29 (42) |
| Intensive care unit | 394 (23) | 151 (22) | 22 (32) |
| Deceased | 2 (0) | 0 (0) | 0 (0) |
| Hospital course | |||
| Vasoactive agent | 112 (7) | 36 (5) | 6 (9) |
| Positive-pressure ventilation | 145 (9) | 57 (8) | 5 (7) |
| Hospital length of stay, days | 3.0 (2.0–7.0) | 3.0 (2.0–6.0) | 3.0 (1.5–6.0) |
| Intensive care unit length of stay, days | 1.0 (0.0–4.0) | 1.0 (0.0–4.0) | 2.0 (0.0–6.0) |
| 30-day in-hospital mortality | 25 (1) | 4 (1) | 0 (0) |
Values are number (%) or median (IQR).
Chronic complex conditions were defined using Feudtner International Classification of Diseases, 9th and 10th edition codes.17
Performance of both models in terms of discrimination and calibration was similar; however, the parsimonious model used nine variables (Table II), although the full model contained 31 variables. Because the more parsimonious model showed minimal loss in performance in the test datasets while using fewer variables, we selected it as the preferred model reported here.
The AUROC within the training set was 0.79 (0.76–0.83) (Figure 3). In the temporal test set the AUROC was 0.75 (0.69–0.81), and in the geographic test set it was 0.87 (0.73–1.00). Calibration curves indicated good calibration, with a tendency of the model to slightly underestimate risk in the highest-risk deciles of the population (Figure 4; available at www.jpeds.com). Test characteristics in the training and test sets are shown in Table V. With a threshold of predicted risk set to produce 90% sensitivity in the training set, the specificity was 47% (95% CI, 44–49%) in the training set. At this threshold, in the temporal test set, the sensitivity was 82% (95% CI, 72–90%), and in the geographic test set it was 90% (95% CI, 55%−100%).
Figure 3.
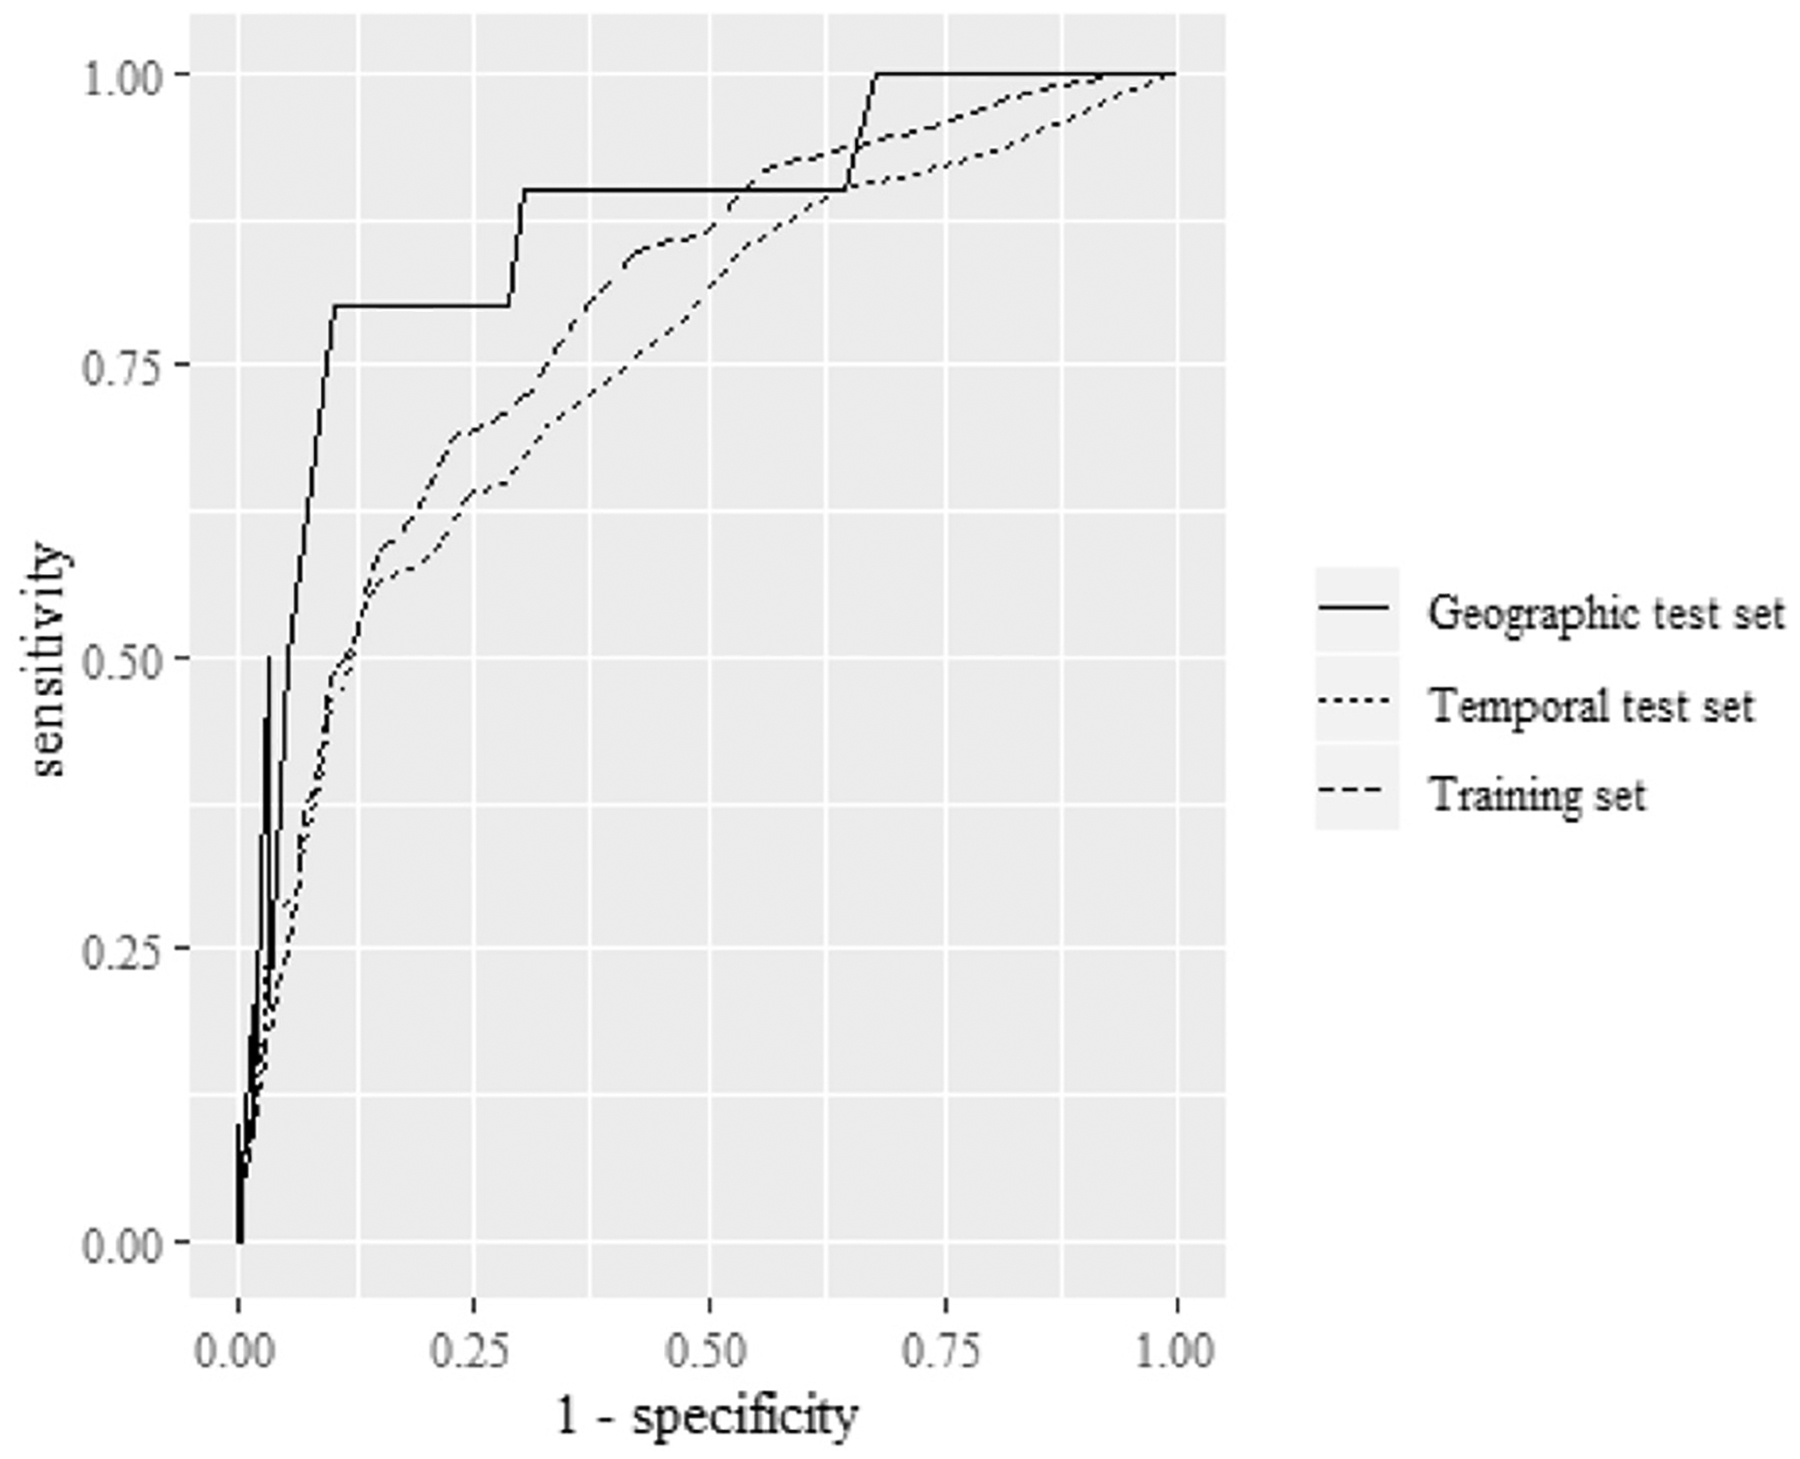
Receiver operating characteristic plots in the training and test sets.
Figure 4.
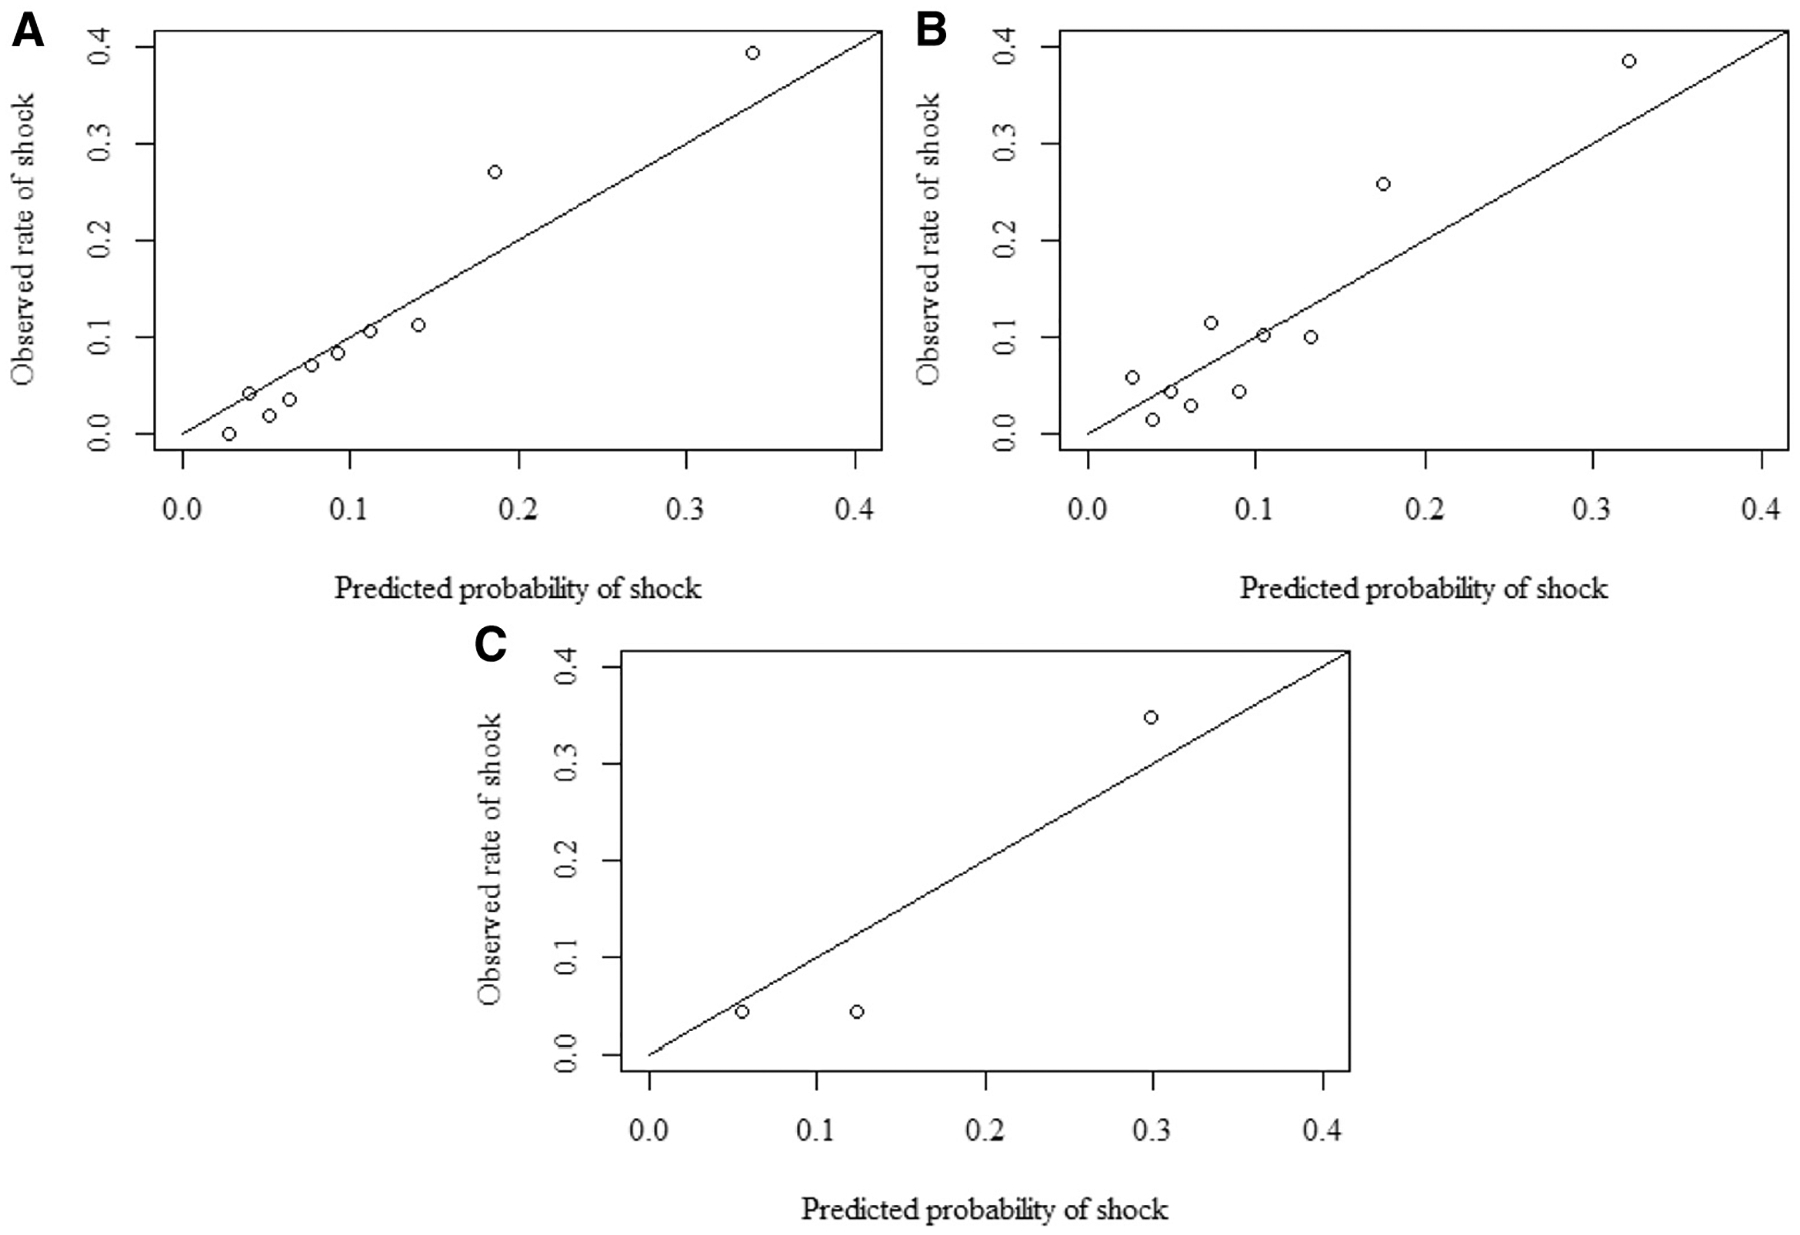
Calibration plots. A, Training set comparison of predicted proportion of patients with shock vs observed proportion of patients with shock, within deciles of risk (slope = 1.31; intercept = −0.04). B, Temporal test set comparison of predicted proportion of patients with shock vs observed proportion of patients with shock, within deciles of risk (slope = 1.28; intercept = 0.02). C, Geographic test set comparison of predicted proportion of patients with shock vs observed proportion of patients with shock, within tertiles of risk. Tertiles were used because the numbers were small in this dataset (slope = 1.35; intercept = −0.07).
Table V.
Test characteristics of the model in training and test sets*
| Datasets | Threshold of predicted risk | Sensitivity (95% CI) | Specificity (95% CI) | Positive predictive value (95% CI) | Negative predictive value (95% CI) |
|---|---|---|---|---|---|
| Training | 0.13 | 0.69 (0.62–0.75) | 0.78 (0.75–0.80) | 0.28 (0.24–0.32) | 0.95 (0.94–0.96) |
| Temporal test | 0.13 | 0.59 (0.47–0.7) | 0.79 (0.76–0.82) | 0.27 (0.20–0.34) | 0.94 (0.91–0.96) |
| Geographic test | 0.13 | 0.90 (0.55–1.00) | 0.61 (0.47–0.73) | 0.28 (0.14–0.47) | 0.97 (0.86–1.00) |
| Training | 0.07 | 0.90 (0.84–0.94) | 0.47 (0.44–0.49) | 0.18 (0.15–0.20) | 0.97 (0.96–0.98) |
| Temporal test | 0.07 | 0.82 (0.72–0.90) | 0.48 (0.44–0.52) | 0.17 (0.13–0.21) | 0.95 (0.93–0.98) |
| Geographic test | 0.07 | 0.90 (0.55–1.00) | 0.32 (0.21–0.46) | 0.18 (0.09–0.32) | 0.95 (0.75–1.00) |
Two thresholds were derived in the training set: a threshold designed to optimize both sensitivity and specificity (Youden’s J, threshold = 0.13), and a threshold designed for 90% sensitivity (threshold = 0.07).
The model was assessed for the secondary outcome of hypotension with vasoactive agent requirement in the first 24 hours, a more severe and rare subgroup within the primary outcome. The AUROC in the training set was 0.74 (0.68–0.80), in the temporal test set it was 0.71 (0.60–0.82), and in the geographic test set it was 0.84 (0.70–0.98). Test characteristics of the model for the secondary outcome are reported in Table VI (available at www.jpeds.com). Precision-recall curves were generated and shown in Figure 5 (available at www.jpeds.com).
Table VI.
Test characteristics of the model in training and test sets for the secondary outcome of hypotension in the first 24 hours with vasoactive use*
| Datasets | Threshold of predicted risk | Sensitivity (95% CI) | Specificity (95% CI) | Positive predictive value (95% CI) | Negative predictive value (95% CI) |
|---|---|---|---|---|---|
| Training | 0.13 | 0.63 (0.51–0.74) | 0.74 (0.72–0.76) | 0.10 (0.08–0.13) | 0.98 (0.97–0.98) |
| Temporal test | 0.13 | 0.52 (0.33–0.71) | 0.76 (0.73–0.79) | 0.09 (0.05–0.14) | 0.97 (0.96–0.99) |
| Geographic test | 0.13 | 1.00 (0.40–1.00) | 0.57 (0.44–0.69) | 0.12 (0.04–0.29) | 1.00 (0.91–1.00) |
| Training | 0.07 | 0.83 (0.73–0.91) | 0.44 (0.41–0.46) | 0.06 (0.05–0.08) | 0.98 (0.97–0.99) |
| Temporal test | 0.07 | 0.79 (0.60–0.92) | 0.46 (0.42–0.49) | 0.06 (0.04–0.09) | 0.98 (0.96–0.99) |
| Geographic test | 0.07 | 1.00 (0.4–1.00) | 0.57 (0.44–0.69) | 0.12 (0.04–0.29) | 1.00 (0.91–1.00) |
Two thresholds were derived in the training set for the primary outcome of hypotension requiring fluid or vasoactive use: a threshold designed to optimize both sensitivity and specificity (Youden’s J, threshold = 0.13), and a threshold designed for 90% sensitivity for the primary outcome (threshold = 0.07).
Figure 5.
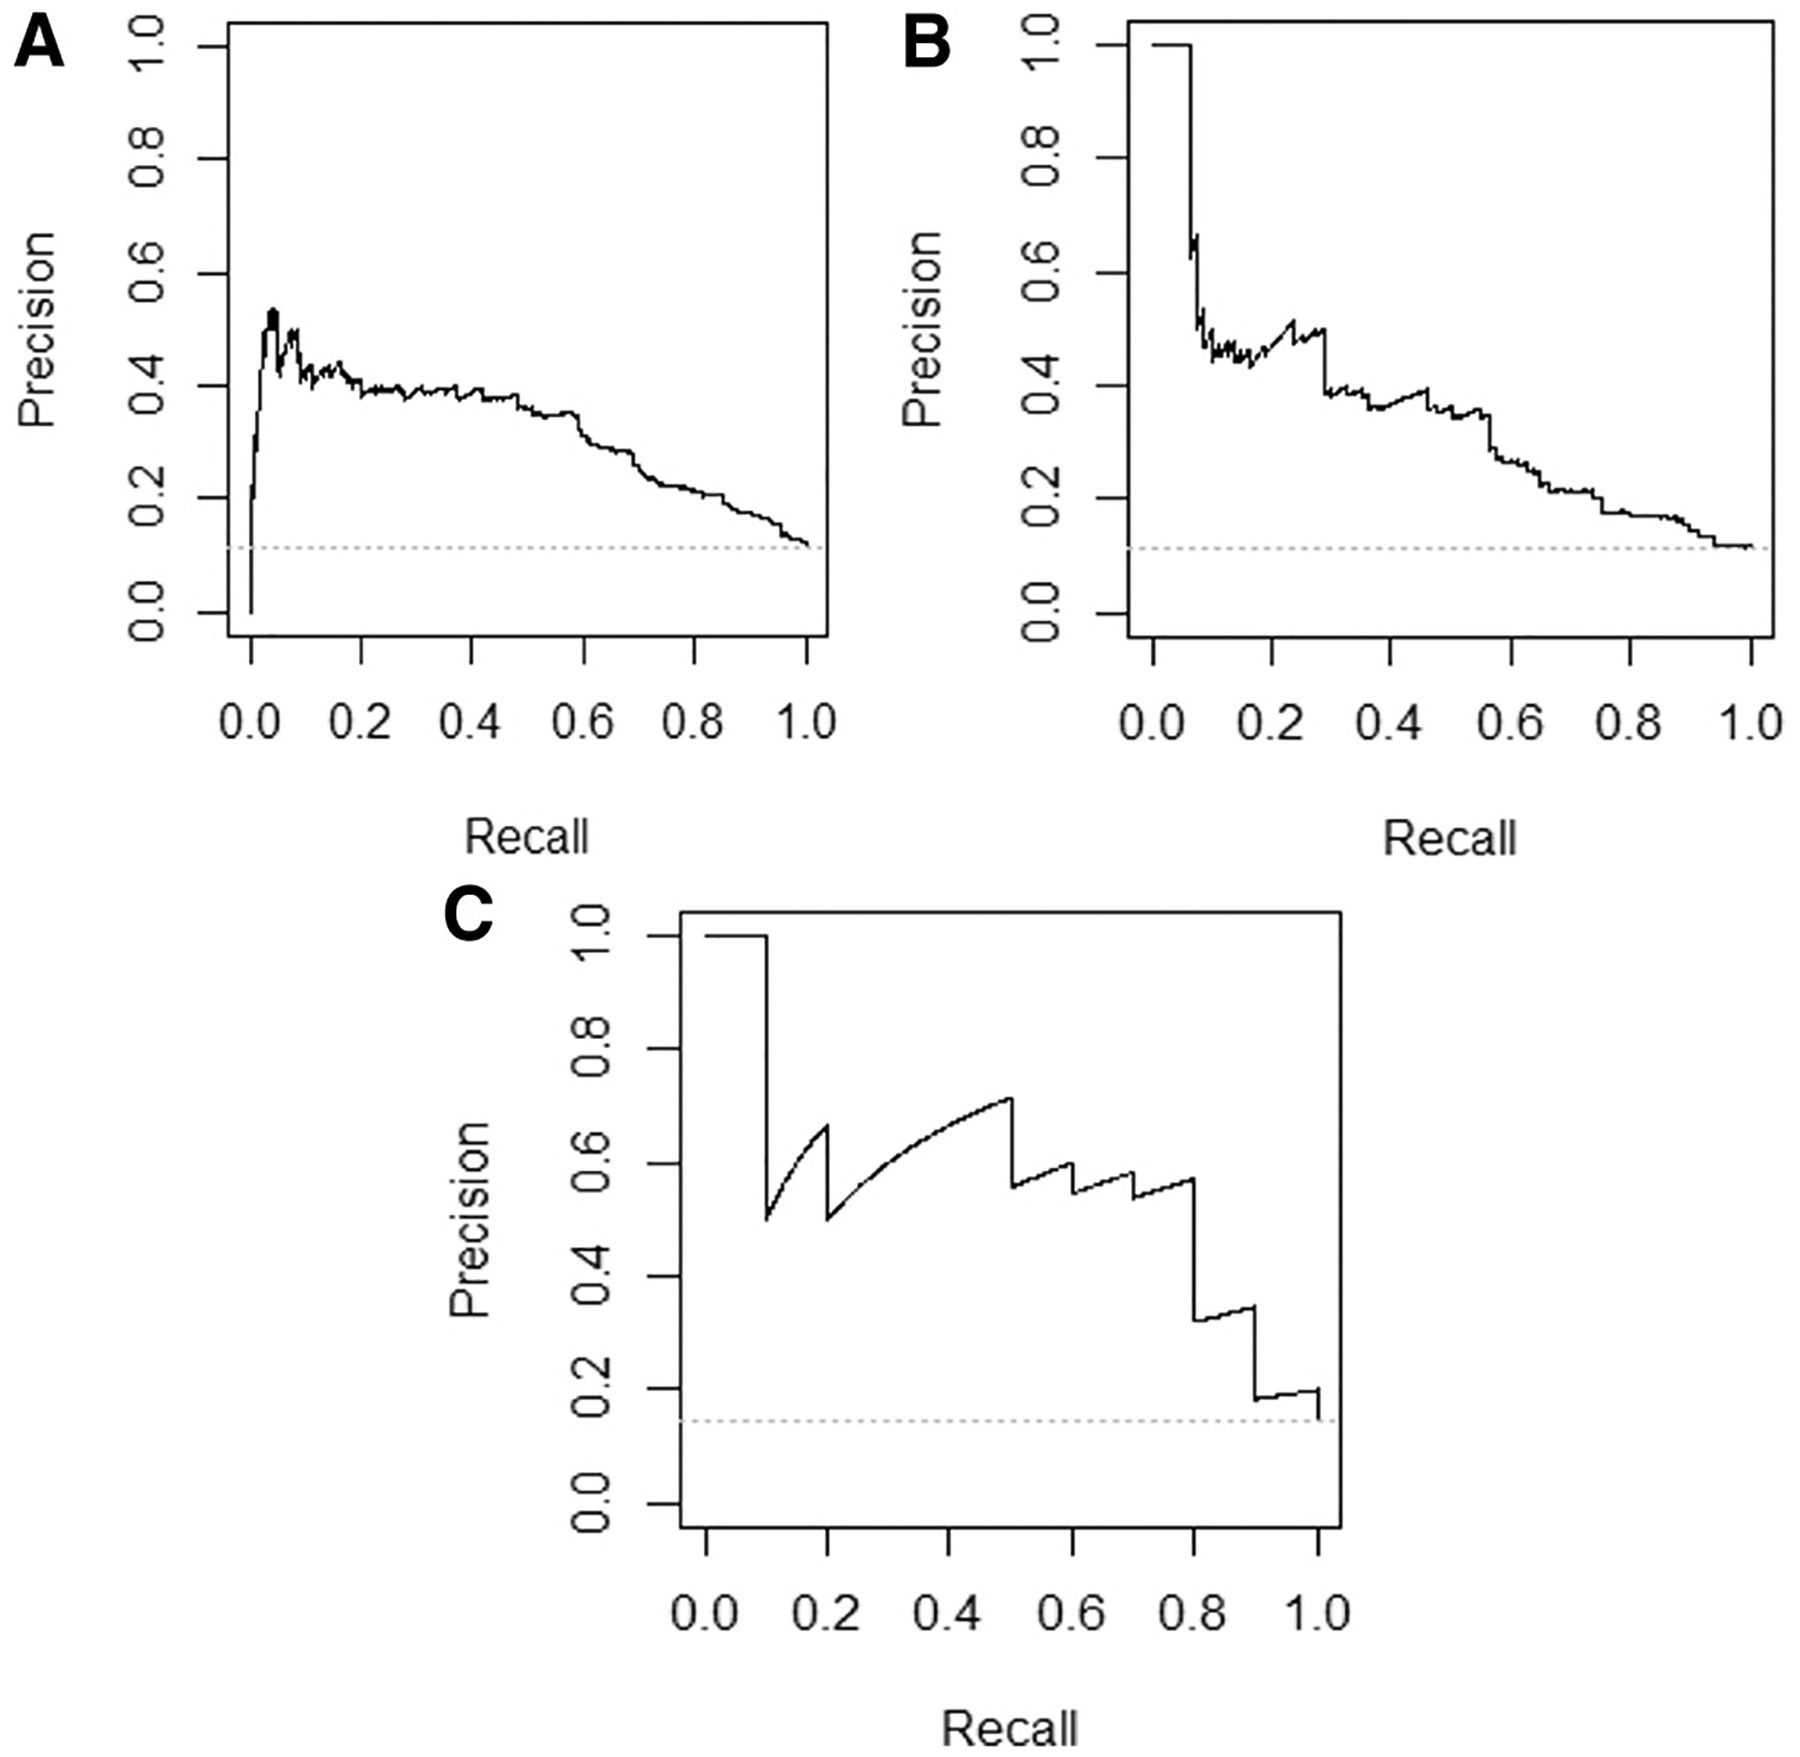
Precision recall curves. Precision indicates positive predictive value, and recall indicates sensitivity, and a model with perfect discrimination would follow the right upper borders of the plot. Performance of a model with no discrimination would equal the prevalence of the outcome in the dataset, indicated by the horizontal grey dashed line. A, Training set precision recall curve. Precision represents positive predictive value and recall represents sensitivity. B, Temporal test set precision recall curve. Precision represents positive predictive value and recall represents sensitivity. C, Geographic test set precision recall curve. Precision represents positive predictive value and recall represents sensitivity.
Discussion
We report a model for prediction of pediatric hypotensive septic shock in the first 24 hours. The model is an equation designed for computer-based calculation to maximize the predictive value of data already existing in the EHR. The model discriminated well, as measured by the AUROC. The geographic test set had fewer patients, making point estimates in this test set less precise. However, despite small numbers, it was important to evaluate a test set in a nontertiary emergency care environment (Table I). The AUROC and test characteristics indicated that the model did perform well in a smaller ED with a less severely ill population than the training set.
Calibration curves were used to explore performance of the model across the spectrum of risk. They demonstrated good calibration in the low-risk to middle-risk patients; however, in the highest deciles of risk, the model underestimated the predicted probability of risk. The intended use for this model is to identify the highest risk cohort of patients, and it did effectively identify the highest risk group of patients, but these curves indicate that it should not be used to provide an estimate of precise risk in the higher ranges of risk.
Precision recall curves plot the positive predictive value across all sensitivities ranging from 0% to 100%. Although the precision recall curves for this model demonstrated that positive predictive value decreased at the highest sensitivities (Figure 5), sepsis is a clinical scenario in which a high sensitivity would be prioritized despite some loss in positive predictive value. A positive predictive value in the 15%−20% range is useful for a potentially fatal condition and compares favorably with existing tools.
This model was designed for a setting in which a clinician indicates a preliminary concern for suspected sepsis upon arrival. This led to variables that were concerning for sepsis, such as a high-risk condition, being negatively associated with the risk of shock. Thus, this model would be inappropriate to use as a “sniffer,” searching the entire ED population for sepsis. If implemented as decision support, it should be in a setting where there is a mechanism for clinicians to document concern for possible sepsis as a trigger to receive decision support from the model. The model could then inform ongoing clinical decision making about diagnosis, use of antibiotics, admission or transfer to a higher level of care. The “assisted monitoring” approach for which this model is designed leverages clinical pretest probability to increase the prevalence of the outcome, improving positive predictive value. Additionally, risk stratification at the moment of initial concern, before treatment decisions have been made, is the right time in which decision support can influence decision making, one of the “five rights” that must be considered in designing decision support.22 The downside of assisted monitoring is that it does not identify patients in whom clinicians have no concern for sepsis.
As a model that calculates a predicted risk, the threshold of risk chosen for alerting can be adjusted to local context to choose a desired sensitivity. In the ED, 2 key factors to consider in a diagnostic tool are sensitivity and number needed to alert, the inverse of positive predictive value. For example, a center far from tertiary care or with fewer pediatric patients may chose a higher sensitivity compared with a center with a high volume of pediatric critical illness and on-site intensive care. Making a choice in the balance between alert fatigue and sensitivity should take into consideration baseline clinician sensitivity for sepsis, population acuity, and outcome prevalence. For example, if the model were set to alert at a threshold of 7% risk, in a population with 11% with hypotensive septic shock, it would have a sensitivity of 90%, and number needed to alert of 6. The model would classify 6 patients as high risk for every 1 who developed the outcome. Because the outcome being detected is severe, this is likely a reasonable number needed to alert. In a setting where the prevalence of the outcome was one-half that of the training set, at a sensitivity of 90%, the model would produce a number needed to alert of 11. Ideally, monitoring diagnostic performance should be ongoing after implementation, allowing for adjustment of alerting thresholds if necessary.
The model was designed for use with an EHR, rather than manual calculation. Optimizing predictive strength was prioritized, allowing for calculations and higher order interactions performed by a computer. The evolution of sepsis is dynamic; thus, clinical implementation of this model should emphasize ongoing patient assessment and risk stratification as additional laboratory results and vital signs become available. If implemented in settings without the predictor variables reliably available in the EHR at the time of arrival, such as presence of a central line, discrete input from clinicians could be necessary.
Previous pediatric sepsis models predicted mortality using up to 24 hours of clinical and laboratory data, and had AUROCs ranging from 0.71 to 0.88.10,11,23 Other models using machine learning algorithms in sepsis have demonstrated higher AUROCs, but in different populations such as adults and neonates, using up to 48 hours of data.24,25 The broad spectrum of illness severity in this study reflected the diagnostic uncertainty that the model addressed: only 23% were admitted to the intensive care unit and 28% were discharged home from the ED.
Sepsis diagnostic systems implemented in tertiary pediatric EDs have been described previously.7,8,26 There are substantial differences between this model derivation and validation study and prior reports about diagnostic tools that limit direct comparisons. These published tools are not predictive models and thus do not have an AUROC to compare, but as point-based scores some have reported sensitivity and specificity at a fixed threshold. Prior reports about ED-based diagnostic tools used treatment on the institutional sepsis pathway as the gold standard outcome, in some cases during a time when the diagnostic tools in question were being used to direct clinicians to use the pathway. In comparison, the model reported here used an outcome independent of the model. Additionally, this model was developed in a population in whom a sepsis evaluation was already initiated, that is, the population in this study represents the outcome in previous ED-based studies. The model reported here was developed in 1 dataset and tested in another, creating a more formal validation step.
With these limitations in mind, it is useful to compare this tool with the tool reported by Balamuth et al that used a similar outcome, sepsis treatment with vasoactive use. They described a system in which an automated EHR alert was followed by an assessment by a nurse and pediatric emergency physician.7,27 The model that we report also required clinician judgment, although the roles of the clinician and diagnostic tool are reversed, with a clinician indicating initial concern for sepsis first, followed by modeling predicted risk. The sensitivity of the Balamuth system for the outcome of sepsis with vasoactive use was 84% (66%−95%) and positive predictive value was 2% (2%−3%). In the model reported here, the sensitivity for hypotensive shock with vasoactive use, when set to the 90% sensitivity threshold, was 79% (60%−92%) in the temporal test set and 100% (40%−100%) in the geographic test set. The positive predictive value was 6% (4%−9%) in the temporal test set and 8% (2%−20%) in the geographic test set. Although the positive predictive value was higher in the model reported here, this likely reflects a higher prevalence of the outcome in the study population.
With similar test characteristics between these 2 approaches, local preferences in implementation may influence the choice. In the model reported here, clinicians indicated clinical suspicion for sepsis in <0.5% of all ED visits during the study period. The Balamuth tool triggered initially on ~10% of all ED patients, and was subsequently narrowed by nurses to 1%, followed by physician determination.7,27 An advantage of the model presented here is that it was derived and validated in multiple ED and urgent care settings, with a range of providers, which may generalize better to nontertiary settings where children receive emergency care.
The analysis incorporated cross-validation and penalized regression techniques within the umbrella of machine learning, as well as traditional predictive modeling approaches, including selecting predictors and interaction terms with a basis in literature and biological plausibility. Advantages of optimizing the models using cross-validation are decreasing the risk of overfitting to the training set and performing variable selection on a continuous scale, rather than throwing variables out as in stepwise selection. A penalized regression algorithm produces linear models, which are easier to implement in an EHR than tree-based algorithms. We decided to create a parsimonious model based on practical considerations about the minimal value added by additional variables, a decision that the algorithm would not have automatically made.
There are limitations to this study. All visits were within the same regional pediatric health care system, limiting generalizability. Despite this limitation, the validation step was enhanced by using a TRIPOD 2b strategy, in which data are split nonrandomly and each visit is only used once for derivation or validation, which is considered a pseudoexternal validation.
This model was developed using data as recorded in the EHR, and its performance is subject to the reliability of these variables in the EHR. The sites in this study had high rates of complete vital signs, and the model may not be appropriate in settings without complete vital signs routinely recorded. Information from the prehospital setting or about care at an outside hospital were not incorporated. Although this might potentially exclude important physiologic information, it also pragmatically reflects data that are in the EHR in real time during the visit and available for clinical decision support. The model relies on initial concern for sepsis from a clinician and its performance may vary based on clinicians’ individual level of concern.
This model strongly discriminated the risk of early hypotensive septic shock, in training and separate temporal and geographic test sets. This model added predictive value to initial clinician suspicion for sepsis, and it may improve early identification of patients at high risk for hypotensive septic shock, at the first moment when a clinician has an opportunity to intervene to prevent deterioration.
Supplementary Material
Acknowledgments
Funded by the Agency for Healthcare Research and Quality (K08HS025696 [to H.S.]), and by National Institutes of Health/National Center for Advancing Translational Sciences Colorado Clinical and Translational Sciences Institute (UL1 TR002535). Contents are the authors’ sole responsibility and do not necessarily represent official National Institutes of Health views. The funders had no role in the design and conduct of the study; collection, management, analysis, and interpretation of the data; preparation, review, or approval of the manuscript; and decision to submit the manuscript for publication. The authors declare no conflicts of interest.
Glossary
- AUROC
Area under the receiver operating characteristic
- ED
Emergency department
- HER
Electronic health record
- TRIPOD
Transparent reporting of a multivariable prediction model for individual prognosis or diagnosis
Footnotes
Portions of this study were presented at the Pediatric Academic Societies annual meeting, April 24-May 1, 2019, Baltimore, Maryland.
References
- 1.Inwald DP, Tasker RC, Peters MJ, Nadel S. Paediatric Intensive Care Society Study Group. Emergency management of children with severe sepsis in the United Kingdom: the results of the Paediatric Intensive Care Society sepsis audit. Arch Dis Child 2009;94:348–53. [DOI] [PubMed] [Google Scholar]
- 2.Carcillo JA, Kuch BA, Han YY, Day S, Greenwald BM, McCloskey KA, et al. Mortality and functional morbidity after use of PALS/APLS by community physicians. Pediatrics 2009;124:500–8. [DOI] [PubMed] [Google Scholar]
- 3.Davis AL, Carcillo JA, Aneja RK, Deymann AJ, Lin JC, Nguyen TC, et al. American College of Critical Care Medicine clinical practice parameters for hemodynamic support of pediatric and neonatal septic shock. Crit Care Med 2017;45:1061–93. [DOI] [PubMed] [Google Scholar]
- 4.Launay E, Gras-Le Guen C, Martinot A, Assathiany R, Blanchais T, Mourdi N, et al. Suboptimal care in the initial management of children who died from severe bacterial infection: a population-based confidential inquiry. Pediatr Crit Care Med 2010;11:469–74. [DOI] [PubMed] [Google Scholar]
- 5.Hoffman JM, Keeling NJ, Forrest CB, Tubbs-Cooley HL, Moore E, Oehler E, et al. Priorities for pediatric patient safety research. Pediatrics 2019;143:e2018–0496. [DOI] [PMC free article] [PubMed] [Google Scholar]
- 6.Schlapbach LJ, Weiss SL, Wolf J. Reducing collateral damage from mandates for time to antibiotics in pediatric sepsis-primum non nocere. JAMA Pediatr 2019;173:409–10. [DOI] [PubMed] [Google Scholar]
- 7.Balamuth F, Alpern ER, Abbadessa MK, Hayes K, Schast A, Lavelle J, et al. Improving Recognition of pediatric severe sepsis in the emergency department: contributions of a vital sign-based electronic alert and bedside clinician identification. Ann Emerg Med 2017;70:759–68.e2. [DOI] [PMC free article] [PubMed] [Google Scholar]
- 8.Cruz AT, Williams EA, Graf JM, Perry AM, Harbin DE, Wuestner ER, et al. Test characteristics of an automated age- and temperature-adjusted tachycardia alert in pediatric septic shock. Pediatr Emerg Care 2012;28:889–94. [DOI] [PubMed] [Google Scholar]
- 9.Ray KN, Olson LM, Edgerton EA, Ely M, Gausche-Hill M, Schmuhl P, et al. Access to high pediatric-readiness emergency care in the United States. J Pediatr 2018;194:225–32.e1. [DOI] [PMC free article] [PubMed] [Google Scholar]
- 10.Schlapbach LJ, MacLaren G, Festa M, Alexander J, Erickson S, Beca J, et al. Prediction of pediatric sepsis mortality within 1 h of intensive care admission. Intensive Care Med 2017;43:1085–96. [DOI] [PubMed] [Google Scholar]
- 11.Matics TJ, Sanchez-Pinto LN. Adaptation and validation of a pediatric sequential organ failure assessment score and evaluation of the Sepsis-3 definitions in critically ill children. JAMA Pediatr 2017;171: e172352. [DOI] [PMC free article] [PubMed] [Google Scholar]
- 12.Collins GS, Reitsma JB, Altman DG, Moons KG. Transparent reporting of a multivariable prediction model for Individual Prognosis or Diagnosis (TRIPOD): the TRIPOD statement. J Clin Epidemiol 2015;68: 134–43. [DOI] [PubMed] [Google Scholar]
- 13.Scott HF, Greenwald EE, Bajaj L, Deakyne Davies SJ, Brou L, Kempe A. The sensitivity of clinician diagnosis of sepsis in tertiary and community-based emergency settings. J Pediatr 2018;195:220–7.e1. [DOI] [PubMed] [Google Scholar]
- 14.Lane RD, Funai T, Reeder R, Larsen GY. High reliability pediatric septic shock quality improvement initiative and decreasing mortality. Pediatrics 2016;138:e20154153. [DOI] [PubMed] [Google Scholar]
- 15.Goldstein B, Giroir B, Randolph A. International Consensus Conference on Pediatric Sepsis. International pediatric sepsis consensus conference: definitions for sepsis and organ dysfunction in pediatrics. Pediatr Crit Care Med 2005;6:2–8. [DOI] [PubMed] [Google Scholar]
- 16.R Core Team. R: A Language and Environment for Statistical Computing. Vienna, Austria: R Foundation for Statistical Computing; 2018. www.R-project.org. Accessed March 22, 2019.
- 17.Feudtner C, Feinstein JA, Zhong W, Hall M, Dai D. Pediatric complex chronic conditions classification system version 2: updated for ICD-10 and complex medical technology dependence and transplantation. BMC Pediatr 2014;14:199. [DOI] [PMC free article] [PubMed] [Google Scholar]
- 18.Seymour CW, Liu VX, Iwashyna TJ, Brunkhorst FM, Rea TD, Scherag A, et al. Assessment of clinical criteria for sepsis: for the Third International Consensus Definitions for Sepsis and Septic Shock (Sepsis-3). JAMA 2016;315:762–74. [DOI] [PMC free article] [PubMed] [Google Scholar]
- 19.Friedman J, Hastie T, Tibshirani R. Regularization paths for generalized linear models via coordinate descent. J Stat Softw 2010;33: 1–22. [PMC free article] [PubMed] [Google Scholar]
- 20.DeWitt P. ensr: elastic Net SearcheR [updated January 22, 2019]. https://rdrr.io/cran/ensr. Accessed March 22, 2019.
- 21.Clopper C, Pearson ES. The use of confidence or fiducial limits illustrated in the case of the binomial. Biometrika 1934;26:404–13. [Google Scholar]
- 22.Osheroff J, Teich J, Levick D, Saldana L, Velasco F, Sitting D, et al. Improving Outcomes with Clinical Decision Support: An Implementer’s Guide. 2nd ed Chicago, IL: HIMSS Publishing; 2012. p. 20. [Google Scholar]
- 23.George EC, Walker AS, Kiguli S, Olupot-Olupot P, Opoka RO, Engoru C, et al. Predicting mortality in sick African children: the FEAST Paediatric Emergency Triage (PET) Score. BMC Med 2015;13: 174. [DOI] [PMC free article] [PubMed] [Google Scholar]
- 24.Delahanty RJ, Alvarez J, Flynn LM, Sherwin RL, Jones SS. Development and evaluation of a machine learning model for the early identification of patients at risk for sepsis. Ann Emerg Med 2019;73:334–44. [DOI] [PubMed] [Google Scholar]
- 25.Masino AJ, Harris MC, Forsyth D, Ostapenko S, Srinivasan L, Bonafide CP, et al. Machine learning models for early sepsis recognition in the neonatal intensive care unit using readily available electronic health record data. PLoS One 2019;14:e0212665. [DOI] [PMC free article] [PubMed] [Google Scholar]
- 26.Lloyd JK, Ahrens EA, Clark D, Dachenhaus T, Nuss KE. Automating a manual sepsis screening tool in a pediatric emergency department. Appl Clin Inform 2018;9:803–8. [DOI] [PMC free article] [PubMed] [Google Scholar]
- 27.Balamuth F, Alpern ER, Grundmeier RW, Chilutti M, Weiss SL, Fitzgerald JC, et al. Comparison of two sepsis recognition methods in a pediatric emergency department. Acad Emerg Med 2015;22: 1298–306. [DOI] [PMC free article] [PubMed] [Google Scholar]
Associated Data
This section collects any data citations, data availability statements, or supplementary materials included in this article.