Abstract
Socioeconomic factors influence brain development and structure, but most studies have overlooked neurotoxic insults that impair development, such as lead exposure. Childhood lead exposure affects cognitive development at the lowest measurable concentrations, but little is known about its impact on brain development during childhood. We examined cross-sectional associations between brain structure, cognition, geocoded measures of the risk of lead exposure, and sociodemographic characteristics in 9,712 9- and 10-year-old children. Here, we show stronger negative associations of living in high lead-risk census tracts in children from lower- versus higher-income families. With increasing risk of exposure, children from lower-income families exhibited lower cognitive test scores, smaller cortical volume, and smaller cortical surface area. Reducing environmental insults associated with lead-exposure risk might confer greater benefit to children experiencing more environmental adversity, and further understanding of the factors associated with high lead-exposure risk will be critical for improving such outcomes in children.
Childhood lead exposure is associated with lower cognitive functioning and socioeconomic status. Eleven-year-old children with elevated blood lead levels show reductions in their own social standing 27 years later relative to their parents’ standing.1 Higher concentrations of lead in blood, bone, or deciduous teeth have been linked to decrements in intellectual functioning (even at very low levels),2–6 juvenile delinquency and criminal activity,7,8 and the pathogenesis of neuropsychiatric disorders.9–12 In 2012, the National Toxicology Program concluded that blood lead concentrations below 5 μg/dL were associated with diminished IQ and academic performance, attentional problems, and problem behaviors.13
Socioeconomic status (e.g., family income) also influences brain development and cognitive functioning.14 Past research has suggested that total brain volume is positively associated with intelligence,15 and children from high-income families have significantly larger volumes of gray matter than children from low-income families.16 Small increases in family income lead to proportionally larger increases in cortical surface area in children from the poorest families than in children from higher-income families.17 Further, the association between family income and neurocognitive and academic ability is mediated by brain structure.17,18 However, these previous studies have not accounted for lead exposure, which is often elevated in children in lower-income households.4,19 Importantly, animal studies have shown that post-weaning exposure to enriched environments can alleviate the negative effects of pre-weaning20 and post-weaning lead exposure21 in rats housed in isolated and deprived environments. Thus, the neurotoxic effects of lead exposure may be exacerbated in low-income children, who may have less access to environmental enrichment.22,23
Early childhood lead exposure has been linked to reduced frontal-lobe gray-matter volume in young men24,25 and disrupted white-matter connectivity in young men and women,26 but blood lead concentrations were much higher in those studies than would be observed in contemporary children.24–26 Given that these studies analyzed lead exposure during childhood but brain structure during adulthood, little is known about how lead exposure impacts brain structure in today’s developing children and adolescents. The present study sought to quantify the relationship between geocoded lead-exposure risk and family income on brain structure and cognitive function in children in the Adolescent Brain Cognitive Development (ABCD) Study. We hypothesized that higher risk of lead exposure27,28 and lower family income would be negatively associated with brain structure and cognitive function and that these associations would be greater in children from low-income families.
Results
The ABCD Cohort and Lead Exposure Risk
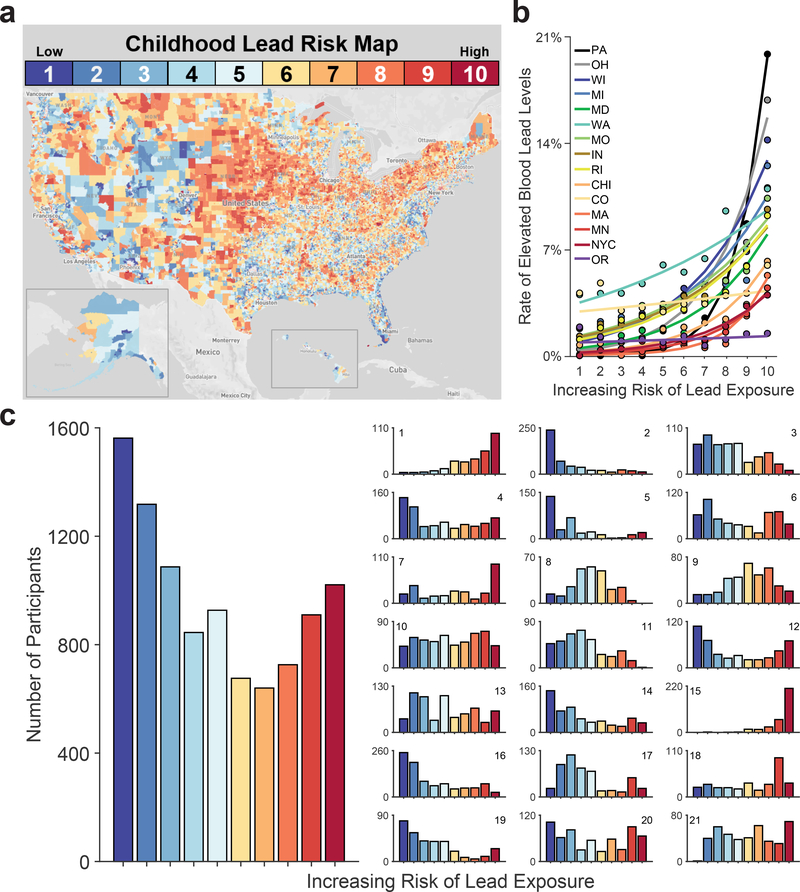
The ABCD Study is an ongoing, large-scale, 10-year longitudinal study involving 21 data collection sites across the U.S.29 The data from the ABCD Study are annually made public via the National Institute of Mental Health Data Archive.30 Of the 11,875 children with baseline data, there were complete data for the variables of interest (Supplementary Table 1) for 9,712 children (Table 1). Endogenous lead-exposure levels have not yet been measured in the ABCD participants, so we instead used geocoded lead-risk scores for each ABCD participant’s census tract.27,28 These risk estimates, computed by the Washington State Department of Health for 72,305 census tracts in the U.S., reflect deciles of a weighted sum of two derived census-tract values from the American Community Survey: the ages of homes and poverty rates, two well-established correlates of Pb exposure31,32 (Figure 1a), with housing age being more strongly weighted (0.58) than poverty rates (0.42) in these lead-risk estimates. While 40.8% of ABCD children are at a low risk for lead exposure (lead risk ≤ 3; n = 3,967), 31.8% of the children are living in intermediate-risk tracts (4 ≤ lead risk ≤ 7; n = 3,088), and 27.4% are living in high-risk tracts (lead risk ≥ 8; n = 2,657) (Table 1; Figure 1c). Across 13 states and 2 cities (Supplementary Table 2), elevated-blood-lead-level rates were significantly associated with higher lead risk, b = 0.32, F(1, 3886935) = 39.52, p < .001, indicating that lead risk serves as a valid proxy for endogenous lead exposure (Figure 1b and Extended Data Figure 1).33
Table 1.
Demographics of the ABCD cohort.
| Release 2.0 (%) | Sample with Complete Data Used in This Study (%) | ACS Target | |
|---|---|---|---|
| Sex | |||
| Male | 6,188 (52.1%) | 5,106 (52.6%) | N/A* |
| Female | 5,681 (47.8%) | 4,606 (47.4%) | N/A* |
| Missing/Undefined | 6 (0.1%) | 0 (0%) | -- |
| Income Bracket | |||
| <$50K (Low) | 3,222 (27.1%) | 2,825 (29.1%) | 39% |
| $50–100K (Mid) | 3,070 (25.9%) | 2,783 (28.7%) | 30% |
| >$100K (High) | 4,565 (38.4%) | 4,104 (42.3%) | 31% |
| Missing/Undefined | 1,018 (8.6%) | 0 (0%) | -- |
| Lead Risk | |||
| Low (1–3) | 4,373 (36.8%) | 3,967 (40.8%) | N/A |
| Intermediate (4–7) | 3,544 (29.8%) | 3,088 (31.8%) | N/A |
| High (8–10) | 3,258 (27.4%) | 2,657 (27.4%) | N/A |
| Missing/Undefined | 700 (5.9%) | 0 (0%) | -- |
| Race/Ethnicity | |||
| Asian | 252 (2.1%) | 188 (1.9%) | 5% |
| Black | 1,779 (15.0%) | 1279 (13.2%) | 17% |
| Hispanic | 2,407 (20.3%) | 1881 (19.4%) | 23% |
| Other | 1,245 (10.5%) | 1012 (10.4%) | 5% |
| White | 6,174 (52.0%) | 5352 (55.1%) | 49% |
| Missing/Undefined | 18 (0.2%) | 0 (0%) | -- |
| Total | 11,875 | 9,712 | 100% |
Lead risk was categorized as being either low (lead risk ≤ 3), intermediate (4 ≤ lead risk ≤ 7) or high (lead risk ≥ 8) (Figure 1). The targeted percentages at each level of the demographics were based on the American Community Survey (ACS).
While there were no explicit targets for sex, it was generally assumed the ABCD sample would be split evenly between sexes. Recruitment was consistently monitored for any critical deviations from this assumption.
Figure 1. Lead-Exposure Risk Scores Predict Elevated-Blood-Lead-Level Rates at the Census Tract Level.
(a) The estimated risk of lead exposure by U.S. census tract. Lower values reflect lesser risk. Map by Rad Cunningham and Sarah Frostenson.27 (b) Rates of elevated blood lead levels globally increased with estimates of lead risk across 13 states and 2 cities. Analysis employed generalized linear-mixed effects models, which tested the statistical significance of coefficients against a t-distribution. (c) Number of children in the ABCD cohort by lead-risk score. Geocoded data were based on current primary residential addresses provided by participants’ caregivers. The smaller subpanels represent individual ABCD study sites. Per the terms of the data release, sites are arbitrarily numbered. Site number is shown in the upper right or left of each subpanel. Alphabetically, the ABCD study-site cities are Ann Arbor, Michigan; Baltimore, Maryland; Boulder, Colorado; Burlington, Vermont; Charleston, South Carolina; Gainesville, Florida; Los Angeles, California; Menlo Park, California; Miami, Florida; Milwaukee, Wisconsin; Minneapolis, Minnesota; New Haven, Connecticut; Pittsburgh, Pennsylvania; Portland, Oregon; Richmond, Virginia; Rochester, New York; Salt Lake City, Utah; San Diego, California; St. Louis, Missouri; and Tulsa, Oklahoma. ABCD study sites are present in 8 of the 13 states including in the analysis in Panel B.
Lead Risk, Cognition, and Brain Structure
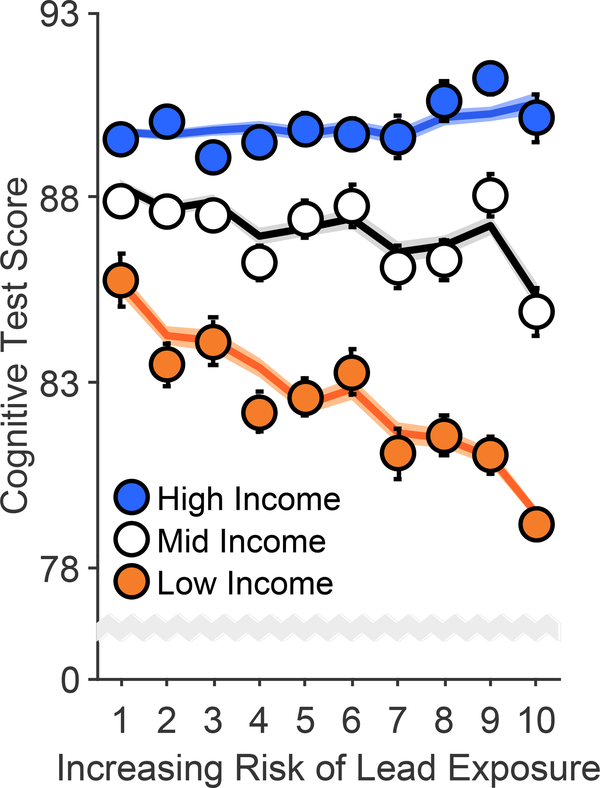
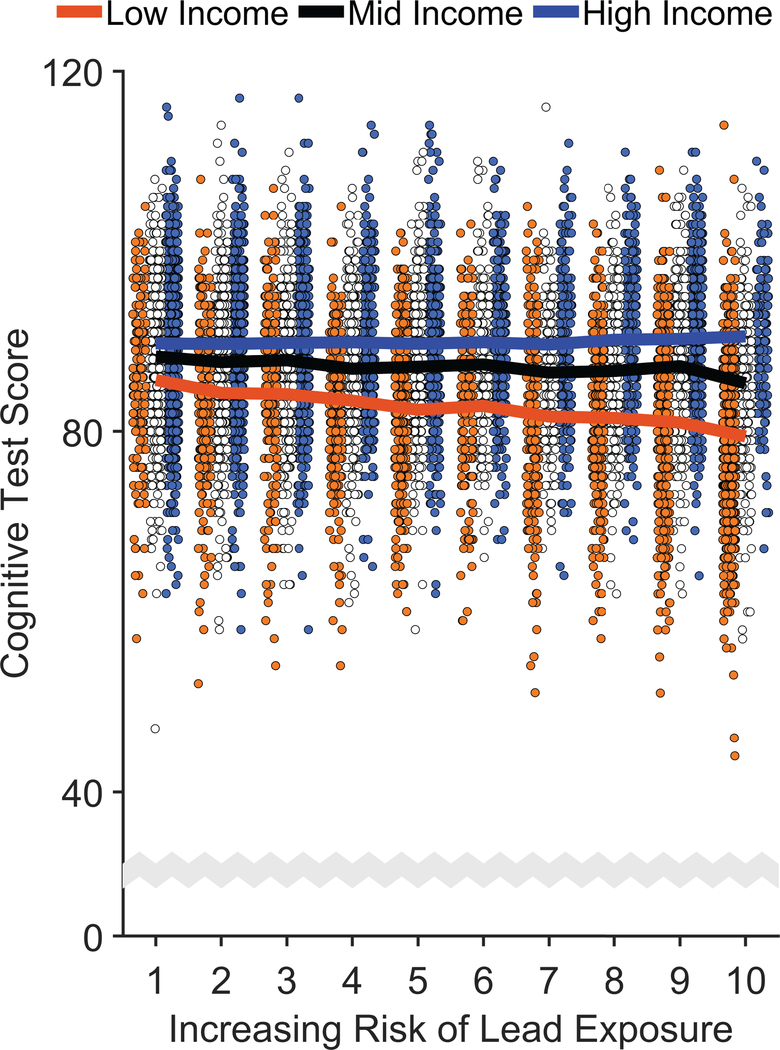
Cognition was operationalized by the total composite uncorrected standard score from the NIH Toolbox.34 Cognitive test scores were significantly greater at higher income levels, F(2, 9699) = 49.62, p < .001, and significantly lower with higher lead-risk levels, F(1, 9699) = 4.70, p = .030 (Figure 2, Extended Data Figure 2, and Supplementary Table 3), and there was a significant Family Income × Lead Risk interaction, F(2, 9699) = 7.34, p = .001. Specifically, the negative association between lead risk and cognitive test scores was significant in the low-income group, p < .001, but not in the mid- or high-income groups, ps ≥ .127. Further, while mean [95% CI] cognitive test scores of the low-income group were 9.0% [8.6%, 9.5%] lower than those of the high-income group, the low-income group living in areas with the highest lead-risk scores (lead risk = 10) exhibited an additional 3.1% [2.2%, 4.0%] reduction in cognitive testing performance.
Figure 2. Risk of Lead Exposure and Cognition.
Overall cognitive function declined most steeply with increasing risk of environmental lead exposure in children of low-income parents. Error bars represent ±1 between-subjects standard error of the observed means. The solid lines represent means of the marginal fitted values of the model; the shaded area surrounding the solid lines represent ±1 between-subjects standard error of those means. Analysis employed linear mixed-effects models, which tested the statistical significance of coefficients against a t-distribution. Age, sex, parental education, and race/ethnicity were included as covariates in this analysis.
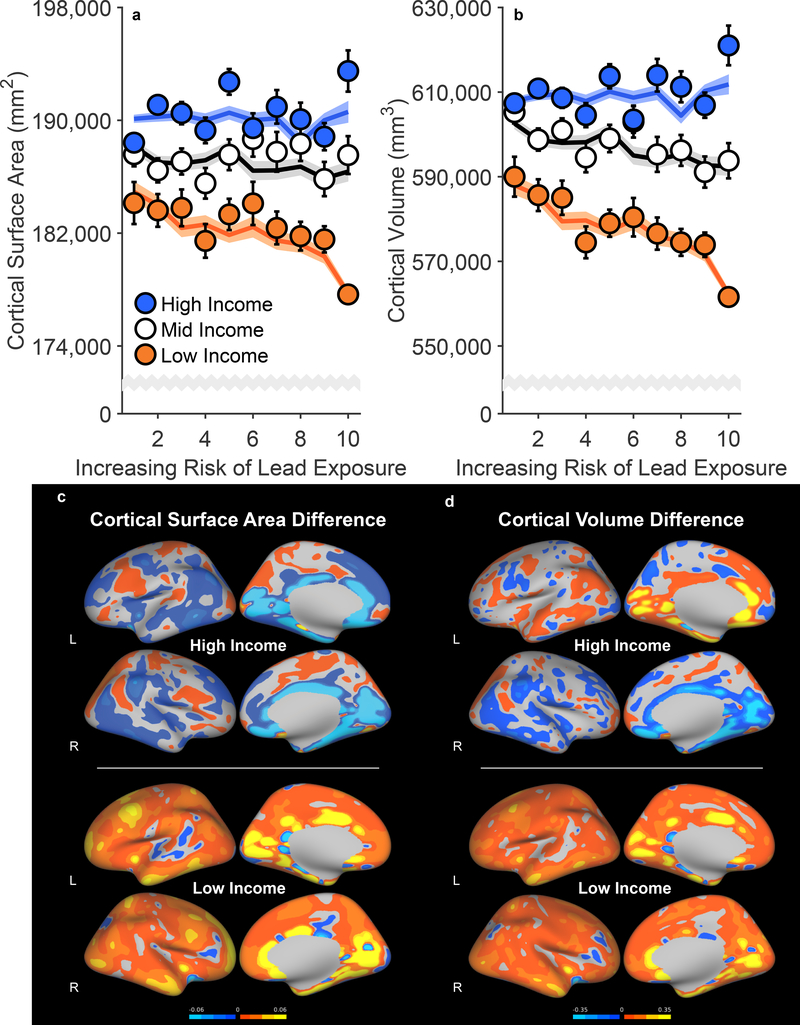
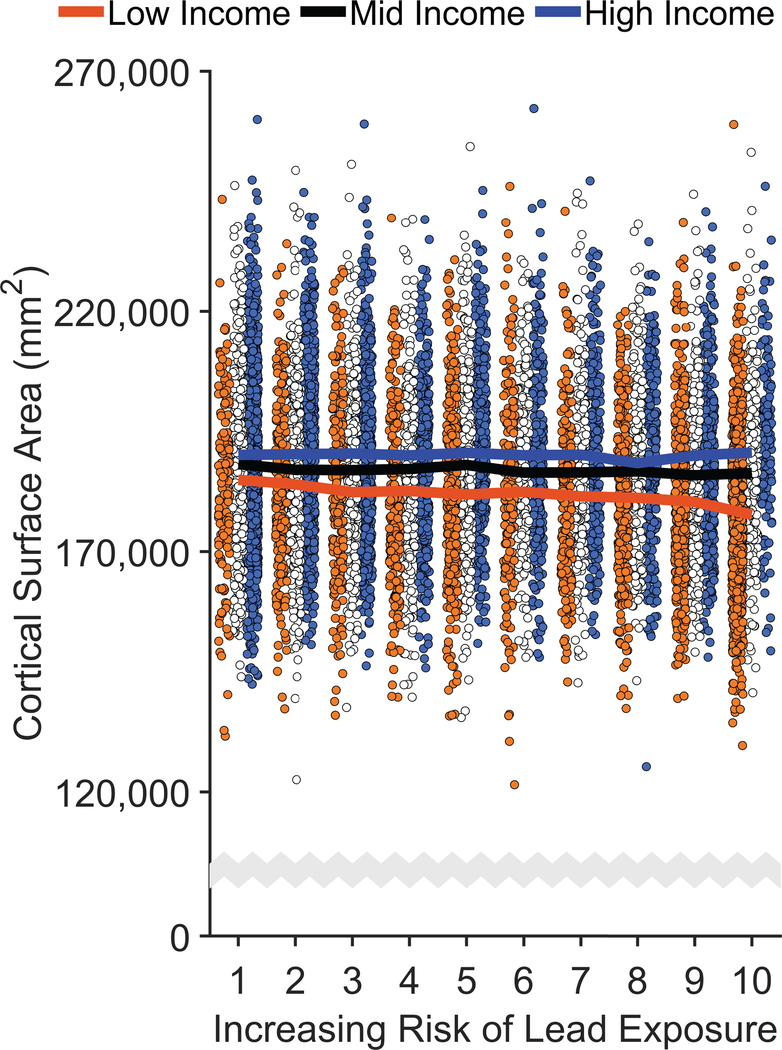
Measures of cortical thickness, cortical surface area, and cortical volume were obtained using FreeSurfer v5.3.0 on acquired T1w MRI volumes from ABCD participants.35 There were no main effects of lead risk on cortical thickness, surface area, or volume, ps ≥ .699 (Supplementary Tables 4–6), but there were main effects of income [Thickness: F(2, 9699) = 3.07, p = .047; Surface Area: F(2, 9699) = 11.00, p < .001; Volume: F(2, 9699) = 16.50, p < .001]. As predicted, there were significant Family Income × Lead Risk interactions (Figure 3 and Extended Data Figures 3 and 4). Associations between brain structure and lead risk differed as a function of family income for cortical surface area, F(2, 9699) = 3.95, p = .019, and cortical volume, F(2, 9699) = 3.03, p = .048, but not cortical thickness, F(2, 9699) = 1.46, p = .232. For cortical surface area, the lead-risk slope was significantly less than 0 for the low-income group, p = .033, but not for the mid- and high-income groups, ps ≥ .101. Mean cortical surface area of the low-income group was 4.5% [4.1%, 5.0%] lower than that of the high-income group, but the children in the low-income group living in the highest lead-risk tracts exhibited an additional 2.1% [1.3%, 2.9%] reduction in cortical surface area relative to the low-income group mean.
Figure 3. Negative Associations of Increased Risk of Lead Exposure are Greater for Children from Lower Income Families.
(a,b) Whole-brain cortical surface area (a) and cortical volume (b) declined most steeply with increasing risk of lead exposure in children of low-income parents. Error bars represent ±1 between-subjects standard error of the observed means. The solid lines represent means of the marginal fitted values of the model; the shaded area surrounding the solid lines represent ±1 between-subjects standard error of those means. Analysis employed linear mixed-effects models, which tested the statistical significance of coefficients against a t-distribution. Age, sex, parental education, and race/ethnicity were included as covariates in this analysis. (c,d) Regional cortical vertex maps of differences in cortical surface area (c) and cortical volume (d) for the high- and low-income groups. For each vertex, the means of participants living in high lead-risk census tracts (lead risk ≥ 8) in each income group were subtracted from the means of those living in low lead-risk census tracts (lead risk ≤ 3) in that same income group. Warmer colors (i.e., yellow, orange) represent greater negative differences in participants living in high versus low lead-risk tracts. L = left hemisphere; R = right hemisphere.
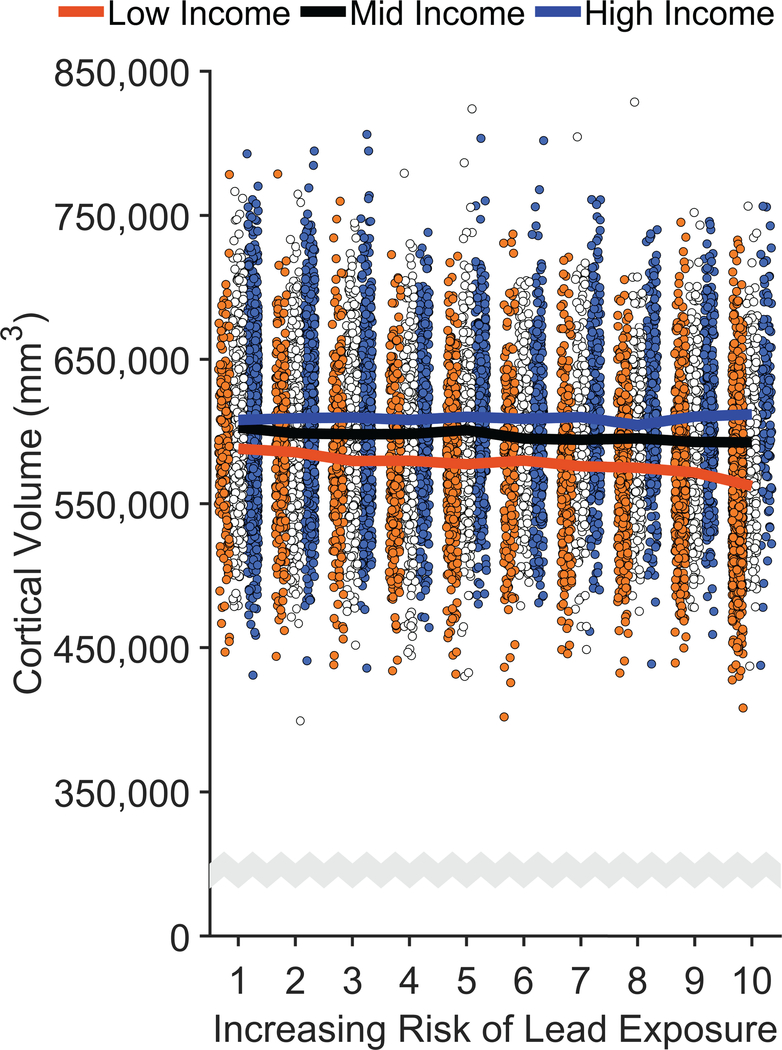
For cortical volume, the lead-risk slopes did not significantly differ from 0 for any of the groups (Low-Income: p = .060; Mid-Income: p = .255; High-Income: p = .369), but the negative slope for the Low-Income group was significantly different from those of the Mid- and High-Income groups, ps ≤ .039; the Mid- and High-Income groups did not differ from each other, p = .770. While the children across the low-income group exhibited a 5.6% [5.2%, 6.1%] reduction in cortical volume compared to those of the high-income group, the mean cortical volume of the children living in the highest lead-risk tracts was 9.6% [8.1%, 11.1%] smaller in the low-income group than in the high-income group. Vertex maps, in which the means of participants living in high lead-risk census tracts (lead risk ≥ 8) were subtracted from the means of those living in low lead-risk census tracts (lead risk ≤ 3), demonstrated global decreases in cortical surface area and volume across the entire cortex in participants in the low-income group relative to those in the high-income group (Figures 3c, 3d).
Cortical Volume-Cognition Associations
To provide a conceptual overview of the patterns in the data as well as context for the meaningfulness of individual differences in brain structure (i.e., how they relate to cognitive test scores), we conducted a set of post hoc analyses to determine the relationships between cognition and brain structure17 and how they were associated with lead risk and family income. Bivariate correlational analyses indicated that all cortical measures were significantly and positively related to cognitive test scores, ps < .001. While cortical surface area and volume were positively correlated, r = .87, cortical volume accounted for the most variance in cognitive test scores [Thickness: R2 = 0.003; Surface Area: R2 = 0.036; Volume: R2 = 0.042], so it was used here as the primary structural predictor of cognition.
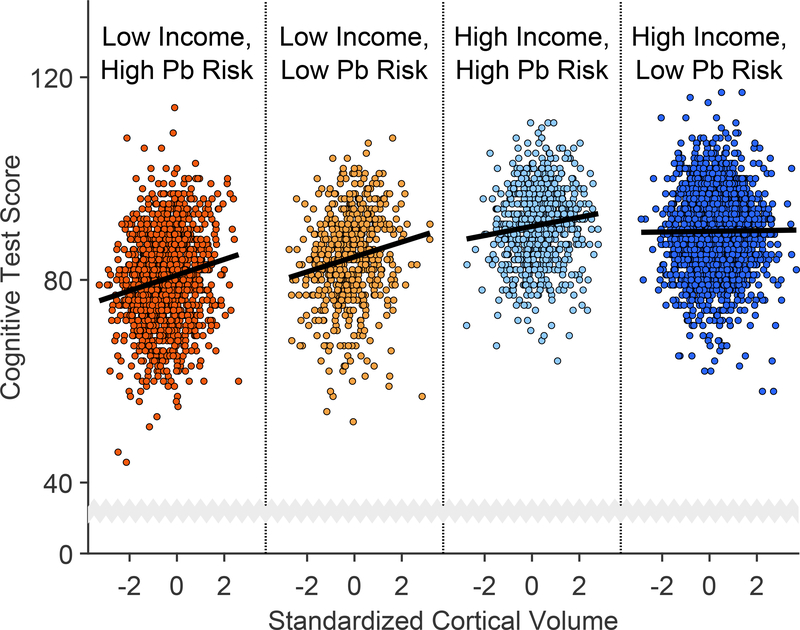
The subgroups of interest were children from low- and high-income families living in low and high lead-risk census tracts (Table 1, Figures 3c and 3d). For each subgroup, we regressed cognitive test scores on cortical volume via simple linear regression. For groups experiencing at least one environmental insult (i.e., high lead risk and/or low income), there were significant positive relationships between cognitive test performance and cortical volume (Low Income, High Risk: β = 1.55, p < .001; Low Income, Low Risk: β = 1.47, p < .001; High Income, High Risk: β = 0.91, p = .003). This was not true for the High Income, Low Risk group (β = 0.06, p = .731). Thus, these positive associations decreased in strength with decreasing levels of environmental adversity (i.e., higher incomes and/or lower lead risk) (Figure 4).
Figure 4. Cortical Volume-Cognition Associations are Strongest in the Most At-Risk Children.
Cognitive test scores increased most steeply with increases in cortical volume in children from lower income families living in census tracts with greater risks of lead (Pb) exposure. Each data point is an individual participant. The individual panels, delineated by vertical dotted lines, incorporate identical abscissa scales and are ordered left to right with respect to the strength of the standardized regression coefficient of cortical volume. Cortical volume was standardized to ease interpretation. Analysis employed simple linear regression, which tested the statistical significance of coefficients against an F-distribution.
Area Deprivation, Cognition, and Brain Structure
To evaluate whether lead risk was associated with brain and cognitive outcomes using a more comprehensive measure of socioeconomic status, we conducted secondary analyses using the area deprivation index (ADI) instead of income.36 The use of ADI in place of family income worsened the fit of the model of cognitive function (ΔAICIncome-ADI = −51.8; Supplementary Table 7). The ADI × Lead Risk interaction was significant but more moderate compared to the family-income analyses, F(2, 9699) = 3.29, p = .037. However, like family income, higher cognitive test scores were significantly associated with lower ADI scores (i.e., less disadvantage), F(2, 9699) = 25.68, p < .001.
Similarly, the ADI models of brain structure fit the data somewhat worse than the family-income models (ΔAICIncome-ADI ≤ −6.2; Supplementary Tables 8–10). ADI had a main effect on cortical surface area and cortical volume [Thickness: F(2, 9699) = 0.92, p = .398; Surface Area: F(2, 9699) = 5.57, p = .004; Volume: F(2, 9699) = 7.24, p = .001], but there were no main effects of lead risk, ps ≥ .344, or significant ADI × Lead-Risk interactions, ps ≥ .321.
Discussion
Socioeconomic factors (e.g., family income, poverty) have a considerable influence on child development and brain structure,37 but many studies have overlooked neurotoxic insults that impair neurocognitive development, such as lead exposure.2,38 It is important to note that causality cannot be inferred because of the cross-sectional, observational nature of the ABCD Study’s baseline data and because we do not currently have direct data on participants’ lead exposure levels. However, our results suggest that U.S. children from low-income families might be more vulnerable to environmental insults associated with high risks of lead exposure. The negative association between lead risk and cognitive test performance was stronger in the low-income group and not statistically significant in the middle- or high-income groups. Such effects of income disparity were also evident in brain structure. The stronger associations between cognition and cortical volume in children from low-income families living in high lead-risk tracts suggest that reductions in environmental insults associated with lead-exposure risk might more greatly benefit children experiencing higher overall environmental adversity. This finding is consistent with the steep decrements in IQ scores observed among children at blood lead concentrations below 5 μg/dL.3,38 While neighborhood poverty has also been shown to influence a variety of outcomes in children,39,40 as it did here in the context of ADI, neighborhood poverty is an independent construct compared to family poverty.39 Here, neighborhood poverty was operationalized by census-tract-level ADI, while family poverty was operationalized by parent-report household/family income. That the family-income models provided better fits to the data than the ADI models further reflects the intricate yet complex interactions between the socioeconomic standing of a child’s family and of the neighborhood in which the family resides.
Our results suggest that children from high-income families may be relatively protected from lead-associated brain and cognitive deficits. At the highest risk level (lead risk = 10), the children from low-income families exhibited 12.2% lower total cognitive test scores, 9.6% smaller cortical volumes, and 8.2% smaller cortical surface areas than the children from high-income families also living in highest-risk areas. The magnitudes of these decrements between the low- and high-income groups were consistently reduced at the lowest risk level (lead risk = 1; cognitive test scores: 4.2%; cortical volume: 2.9%; cortical surface area: 2.3%). Comparably, though not controlling for lead risk, children of families who make less than $25,000 per year have been reported to exhibit cortical surface areas that are approximately 6% smaller than children of families who make at least $150,000 per year.17 Overall, our results are also consistent with studies showing that the negative effects of pre-weaning20 and post-weaning lead exposure21 observed in rats housed in isolated and deprived environments are alleviated by post-weaning exposure to enriched environments. Thus, environmental enrichment and stimulation41 may serve as potential mechanisms to ameliorate the negative effects of environmental insults associated with risk of lead exposure.
We have earlier reported a nonlinear, decelerating relationship between higher family income and larger cortical surface area.17 The data presented here similarly convey patterns of deceleration, in that the strength of the associations between lead risk and either cognition or brain structure decreased in the children from higher-income families. While differences in cortical volume were not meaningfully associated with cognitive performance in high-income/low-risk children, a one standard deviation increase in cortical volume in low-income/high-risk children (i.e., ~9.6% increase in cortical volume) was associated with a 1.55-unit increase in cognitive performance in these children. Overall, the relationships between cortical volume and cognitive test scores were stronger in children exposed to more potential environmental insults (low income and/or high lead risk), in that the meaningfulness of how children’s cortical volume relates to cognition may partially depend on environmental factors. Actions taken to reduce environmental insults associated with risk of lead exposure could potentially confer greater benefits on brain and cognition in children from low-income families than in those from high-income families.
While there were significant Family Income × Lead Risk interactions on cognitive function, cortical surface area, and cortical volume, there was only evidence for an ADI × Lead Risk interaction on cognition. These discrepancies may reflect socioeconomic influences specific to each family rather than their home census tract, such as the relative affordability of lead remediation within a family’s own home. Alternatively, ADI may capture more of the risk for childhood lead exposure than parent-report family income (Extended Data Figures 5 and 6). However, unlike ADI, the lead-risk metric incorporates a strong predictor of lead exposure in age-of-housing. Lead-based paint in older housing units may continue to pollute the home environment,31 and wealthier families may have greater financial resources to maintain or remediate their homes. Future research should delineate the strength of different environmental predictors on different public health issues.
Overall, our results corroborate the unfortunate circumstances facing American children: low-income groups have more negative outcomes associated with lead exposure.42 Relatedly, previous research has shown that children exposed to lead and whose parents had less than a high school education showed significantly lower reading scores relative to children who met one or neither of those criteria.43 Childhood blood lead concentrations are higher in low-income than high-income populations.4,19 Because lead-based paint was banned in 1978, children who live in older, poorly-maintained housing units are at an increased risk for lead exposure from lead-based paint.31,42,44 Low-income populations are more likely to occupy older homes that contain lead hazards31 and may be disproportionately more affected by lead exposure.22,23 Efforts to reduce the risk of lead exposure and improve a child’s living environment may ultimately improve cognitive and brain development.
While census-tract-level lead-risk scores predicted blood lead concentrations in children included in public databases from the same census tracts and were associated with brain and cognitive outcomes in the ABCD cohort, lead-risk scores are not an internal dosimeter of body lead burden. All children in high-risk tracts do not necessarily have an elevated blood lead level, but some children in low-risk tracts might. The non-significant associations of lead risk with brain structure and cognition among children in high-income families may indicate that some of these children have lower blood lead levels or, alternatively, were exposed to less lead hazards, as older housing units that are well-maintained have fewer lead hazards than poorly maintained units.
In December 2018, a US federal action plan was released to identify and aid communities at risk for lead exposure.45 This goal is achievable by knowing lead exposure in all US children (i.e., which regions to target), but only some states require universal children’s screening.46 While a reasonable alternative for pinpointing the “hot zones” of lead exposure is to use archival environmental data associated with elevated exposure,32 such identification of high-risk areas is only beneficial if risk scores map onto actual blood-lead-level rates. In conjunction with a recent report on Minnesota blood-lead-level data,33 we show that the described model of lead-exposure risk27,28 serves as a reasonable proxy for actual census-tract-level exposure rates in 14 additional states and cities (also see Extended Data Figure 7), corroborating a rich literature on the applicability of community-level data to develop lead-exposure detection, mitigation, and prevention strategies.32,47,48 Unfortunately, while census tract and census block are more optimal spatial resolutions for geocoded health data,49 government agencies tend to only report such data, at best, for individual zip codes, and zip-code-level geocoding of blood lead data almost resulted in officials “missing” the Flint water crisis.50 Thus, publicly available lead-risk maps with high spatial resolution fill a void in research practice and policy implementation, as they may be used to sensibly gauge lead exposure levels, identify at-risk regions, and evaluate environmental influences on health-related outcomes in epidemiological and non-epidemiological research projects.
Lead-risk scores used here were primarily a function of housing age (weight = 58%), but it is possible that these factors may have differential strengths of prediction depending on region33,51 (e.g., very few homes in Alaska were built before the lead-paint ban 197852). Whereas the contribution of housing age to the lead-risk score was primarily driven by age of homes given the lead-paint ban,27,31 older homes may also be less likely to have lead-free plumbing.53 With continued research, census-tract-level lead-risk scores could be adjusted to account for unique or multiplicative effects of housing age given the potential for drinking-water lead exposure.
While poverty rates accounted for 42% of the lead-risk score, some correlates of poverty (e.g., lower parental education, less enrichment, malnutrition, subcomponents of ADI) may more strongly contribute than others to the associations between lead exposure/risk and neurocognitive development or that they may be more directly associated with neurocognitive development. Similarly, the Home Observation for Measurement of the Environment (HOME) Inventory (an assessment of the emotional, social, and cognitive qualities of child’s home environment54) may also have accounted for key variance in the data, as it has in other lead studies,38 but this metric was not measured in the ABCD cohort. The lead-risk and ADI metrics are a function of 2 and 17 individual census-tract-level predictors, respectively, and, even though over 85% of the variance in lead-risk scores cannot be accounted for by ADI (Extended Data Figures 5 and 6), each of these individual predictors may also be capturing residual variance of the other predictors. To elucidate how brain and cognitive development are generally associated with neurotoxicant vulnerability (i.e., lead risk), neighborhood poverty (i.e., ADI), as well as family poverty (i.e., household income), our analyses included the two composite indices. Given that (1) family-level poverty and neighborhood-level poverty can have distinct effects on developmental outcomes,39 (2) children from both high- and low-income families live in low- and high-risk tracts (Figure 4), and (3) the effects of lead persist after adjustment for multiple covariates,5,8,25,38 it will be critical to continue to evaluate how poverty and poverty-related factors (e.g., heightened risk of lead exposure) collectively influence brain and cognitive development in children. Obtaining measures of lead exposure in the ABCD cohort will also provide key information with respect to how lead exposure influences child development (e.g., whether higher incomes reduce the risk of lead exposure or are protective against the actual effects of bodily lead levels).
In the current report, each participant’s lead-risk score was based on their primary residential address at study entry (i.e., when children were 9–10 years old). Blood lead levels tend to peak when children are 2–3 years old,3 but it has been reported that IQ in older children is better predicted by concurrent than past blood lead levels.38,55 Indeed, even at very low levels of exposure, IQ is associated with concurrent blood lead levels in school-aged children.56,57 While the age at which children are most vulnerable to lead toxicity remains uncertain, evidence has suggested that school-age lead exposure may be more predictive of developmental outcomes than early childhood exposure.58 Full address histories of the ABCD participants, which are actively being collected from the participants’ parents, would further elucidate these questions.
Conclusions and Future Directions
Childhood lead exposure is a reflection of community predictors, such as poverty rates and age of housing.32 However, the evidence presented here should not be taken to imply that a child’s socioeconomic circumstances or lead-risk status create an immutable trajectory of brain and cognitive development. We do not yet know actual body burdens of lead exposure in the ABCD cohort, yet we found that children from higher-income families in high-risk geographical locations exhibit fewer negative brain and cognitive outcomes compared to the children from lower-income families. The ABCD consortium is exploring ways to enhance the measure of the body burden of lead in the cohort using past medical records, shed deciduous teeth,59 and blood. The open-data framework of the ABCD study will allow researchers to disentangle the effects of family poverty, neighborhood poverty, and lead exposure on the dynamics of brain, cognitive, and behavioral development during childhood and adolescence.
Methods
Participants
The ABCD study is a large-scale, 10-year longitudinal study involving 21 data collection sites across the U.S.29 Using school-based enrollment,60 the consortium successfully recruited and enrolled over 11,800 9- and 10-year-old children. The demographics of the ABCD cohort (Table 1) correspond well with the American Community Survey.61 Our data came from the most recent April 2019 ABCD 2.0 data release,30 which included baseline data for 11,875 children. For the variables of interest (Supplementary Table 1), there were complete data for 9,712 children. At present, there are no blood lead data from the ABCD cohort.
Centralized institutional review board (IRB) approval was obtained from the University of California, San Diego IRB. Study sites obtained approval from their local IRBs. Written informed consent was provided by each parent; each child provided written assent. All ethical regulations were complied with during data collection and analysis.
Lead Exposure and Elevated Blood Lead Level (EBLL) Data
We used a high-resolution nationwide map of lead-risk metrics to obtain a geocoded lead-risk score for each ABCD participant’s census tract.27,28 These risk estimates, generated by the Washington State Department of Health for 72,305 census tracts in the U.S., reflect deciles of a weighted sum of two derived census-tract values from the American Community Survey: the ages of homes and poverty rates, two well-established correlates of Pb exposure31,32 (Figure 1A). Housing age is more strongly weighted (0.58) than poverty rates (0.42) in the lead-risk estimates.
We used generalized mixed-effects models (binomial distribution, logit link) to determine how well the lead-risk scores27 were associated with blood-lead-level data. Census-tract-level blood-lead data were available for 13 states and 2 cities (Supplementary Table 2). Publicly available blood-lead data are typically provided in terms of the number of individuals tested and the number of those individuals who showed elevated blood-lead levels relative to some criterion (e.g., 5 μg/dL). However, to minimize potential issues for dispersion given such count data, as well as to more effectively control for total children tested given the total number elevated, the count data (number tested, number elevated) for each tract were re-coded by test result: “0” (non-elevated) or “1” (elevated). The fixed-effects structure included an overall intercept (i.e., global mean) and lead risk (centered, continuous). The random-effects structure included a random intercept and slope (as a function of lead risk) for each state/city; the by-state/city intercepts and slopes were restricted to be uncorrelated. Analyses were conducted in MATLAB 9.6.0 (R2019a, Update 2; The MathWorks, Natick MA) and MATLAB’s Statistics and Machine Learning Toolbox 11.5 (R2019a).
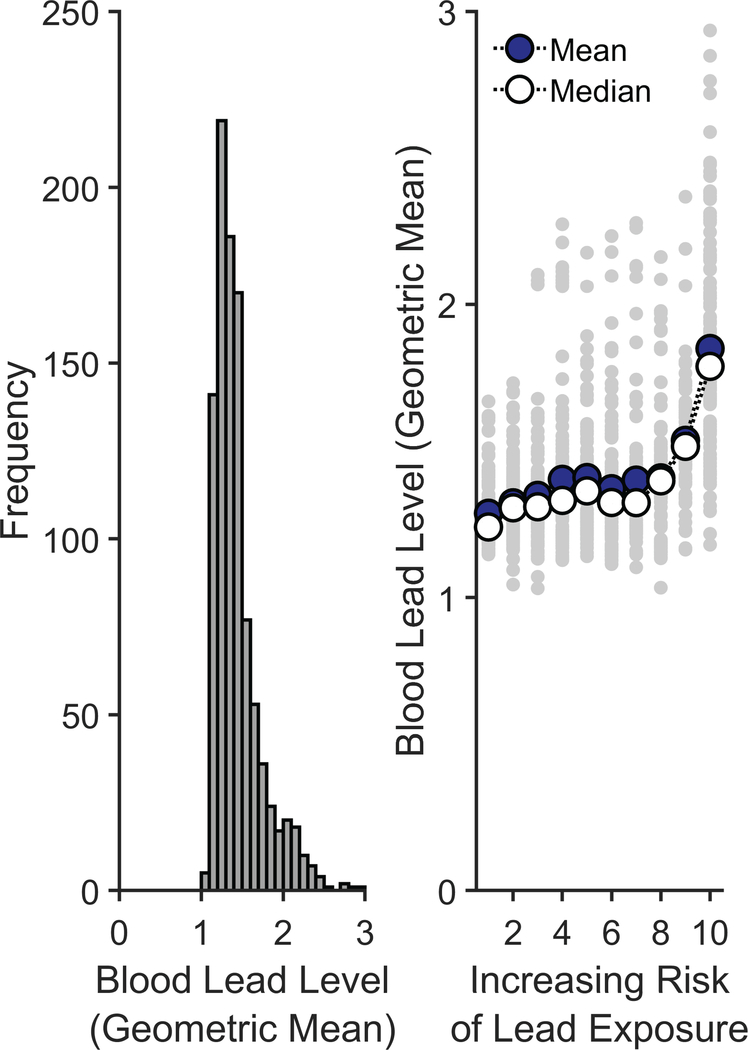
To further gauge the extent to which these lead-risk scores could predict lead exposure levels, we conducted a secondary supplemental analysis using average blood lead levels, with the results presented below. Across the 13 states and 2 cities in our analysis (Supplementary Table 2), only the state of Maryland had data that incorporated actual blood lead levels at the census-tract level. Specifically, these data are published online in terms of the geometric mean of blood lead levels. To parallel the analyses done above, geometric means of annual blood-lead-level data were collapsed across the years 2010–2014, weighted in terms of the number of children screened in each of those years. Extended Data Figure 7 (left) shows the frequency distribution of geometric mean blood lead levels across 992 Maryland census tracts that met the following criteria: (1) The census tract had at least 1 year of data which included both the number screened and the geometric mean blood lead level, and (2) the census tract data available from the Maryland Environmental Public Health Tracking portal was able to be merged with the lead-risk data. Extended Data Figure 7 (right) shows the geometric mean blood lead levels for each of the 992 census tracts as a function of the census tract’s estimated lead-risk score. As seen in the right panel of Extended Data Figure 7, there was generally a positive association between lead risk and the geometric mean of blood lead levels across census tracts. Due to the positive skewness of the data and the presence of a finite lower asymptote to the data, a Spearman’s rank-order correlation was performed. The analysis revealed a significant positive correlation between census tracts’ lead-risk scores and geometric means of blood lead levels, ρ = 0.46, p < .001, further supporting the validity of the lead-risk scores as a proxy for actual lead exposure.
ABCD Data
From the baseline ABCD data, we analyzed the composite uncorrected standard score within the NIH Toolbox34 and structural brain measures (whole-brain cortical thickness, surface area, and volume).62 Data collection procedures are described in detail elsewhere.34,62,63 Briefly, we used NIH Toolbox measures in the ABCD Study because they harmonize data collection elements across NIH-funded projects, thereby facilitating cross-study comparisons. They have been normed for samples between the ages of 3 and 85 and comprise a standardized battery of cognitive tests administered using tablet devices that are comparable with other standardized tests of cognitive function, attesting to their validity in estimating general intellectual functioning.64 The composite uncorrected standard score, which is automatically calculated within the NIH Toolbox, incorporates performance from seven different tests, which show good convergent validity compared to established gold standards of cognitive testing65: (1) the picture vocabulary test (Ages 3+, Version 2.0; a measure of language), (2) the flanker inhibitory control and attention test (Ages 8–11, Version 2.0; attention and executive function), (3) the list sorting working memory test (Ages 7+, Version 2.0; working memory), (4) the dimensional change card sort test (Ages 8–11, Version 2.0; executive function), (5) the pattern comparison processing speed test (Ages 7+, Version 2.0; processing speed), (6) the picture sequence memory test (Ages 8+, Form A, Version 2.0; episodic memory), and (7) the oral reading recognition test (Ages 3+, Version 2.0; language). Because our analyses controlled for age, sex, and race/ethnicity, which are accounted for within the age-corrected and fully-corrected NIH Toolbox scores, we analyzed the uncorrected scores here.
Measures of cortical volume, cortical surface area, and cortical thickness were obtained using FreeSurfer v5.3.0 on acquired T1w MRI volumes from ABCD participants.35 ABCD data are publicly available through the National Institute of Mental Health Data Archive (https://data-archive.nimh.nih.gov/abcd).
Statistical Analyses
We used general linear mixed-effects models to determine the relationship between lead risk, family income, brain structure, and cognition and how well lead risk specifically accounted for these relationships given a second environmental-risk measure, the area deprivation index36 (ADI). Analyses included the 9,712 children who had complete data for the variables of interest (Supplementary Table 1). A participant’s data were excluded if the primary residential address was not valid and/or not able to be geocoded into a 1–10 lead-risk score, a valid household/family income was not provided (answering “Don’t Know” or “Refuse to Answer”), or there were missing data for sex, age, parental education, race/ethnicity, ADI, the composite uncorrected score from the NIH Toolbox, or structural imaging measures (see Supplementary Table 1).
Our first set of analyses determined the extent to which family income moderated the relationship between lead risk and both cognition and brain structure. As described above, the dependent variables for these analyses were the compositive uncorrected standard score from the NIH Toolbox, mean whole-brain cortical thickness, total whole-brain cortical surface area, and total whole-brain cortical volume. Given previous neuroimaging and cognitive research within the Pediatric Imaging, Neurocognition, and Genetics Study,17,66 we controlled for the following variables: age, sex, parental education, family income, and race/ethnicity. Lead risk and age (in months) were centered, continuous factors. Parental education was also a centered, continuous factor, operationally defined as the maximum education level achieved by a parent or caregiver, with seven levels (1 = 6th grade or less; 2 = 7th–9th grade; 3 = 10th–12th grade, no diploma; 4 = high school graduate, GED or equivalent; 5 = Some college with no degree, Associate’s degree; 6 = bachelor’s degree; 7 = master’s degree, professional degree, or doctorate). Race/ethnicity was an effects-coded categorical factor with 5 levels: “White”, “Black”, “Hispanic”, “Asian”, or “Other” (e.g., Pacific Islander, multiracial). In conjunction with ABCD’s NIMH-supported Data Exploration and Analysis Portal (deap.nimhda.org), family income was a categorical factor with 3 levels (effects-coded here), based on the parents’ reported household income (Low Income: ≤ $50K; Middle Income: $50K-$100K; High Income: ≥ $100K). While lead risk was a function of a census tract’s poverty rates and age of housing, family income was specific to each family (i.e., from the parent’s self-report).
To evaluate whether lead risk was associated with brain and cognitive outcomes using a more comprehensive measure of socioeconomic status, we conducted secondary analyses using ADI instead of income.36,67 ADI was computed at the census-tract level in accordance with the coefficient values described in Kind, et al. 36, re-coded in terms of national percentile (i.e., higher values reflect greater disadvantage), and discretized into Low- (ADI: 0–32), Middle- (33–66), and High-ADI categories (67–100), comparable to the family-income analyses. The R code for computing the ADI and merging it into the ABCD data set is located at the following website: https://github.com/ABCD-STUDY/geocoding/blob/master/Gen_data_proc.R. Unlike lead risk, ADI does not incorporate housing age. Additional analyses comparing lead risk and ADI are provided below.
The random-effects structure in all analyses included a random intercept for study site and family identification number (i.e., some ABCD participants were siblings). When relevant, significant interactions were probed using MATLAB’s coefTest function. Complete model output and model-fit characteristics for each analysis are provided in Supplementary Tables 3–10. Statistical reporting in the main text is in the form of F tests computed using MATLAB’s anova function, reflecting the combined statistical significance of all coefficients of the corresponding factor. When specified, model fits were compared using the Akaike information criterion (AIC).
A series of post hoc analyses were also conducted to determine the associations between cognition and brain structure17 and how these associations differed by lead risk and family income. First, we performed bivariate correlational analyses between the three whole-brain cortical measures (thickness, surface area, volume) and cognitive test scores. Because cortical volume accounted for the most variance in cognitive test scores across the three whole-brain measures, we then regressed cognitive test scores on cortical volume (standardized across the entire sample of participants) via simple linear regression for four sub-groups (i.e., children from low- and high-income families living in low and high lead-risk census tracts). As in Table 1, high risk was defined as a lead-risk score greater than or equal to 8, while low risk was operationally defined as a lead-risk score less than or equal to 3 (also see Figure 1A). The following number of participants were in each of these subgroups: Low Income, High Risk, n = 1329; Low Income, Low Risk, n = 581; High Income, High Risk, n = 697; High Income, Low Risk, n = 2185.
For visualization purposes, vertex maps of regional cortical maps of differences in cortical surface area and cortical volume were also generated for the high- and low-income groups. For each vertex, the means of the participants living in high lead-risk census tracts (lead risk ≥ 8) in each income group were subtracted from the means of the participants living in low lead-risk census tracts (lead risk ≤ 3) in that same income group. Of the 4792 participants comprising these 4 subgroups, the vertex maps incorporated the participants with available vertex data (i.e., 4312/4792, 90%).
Correlates of lead-exposure risk and ADI
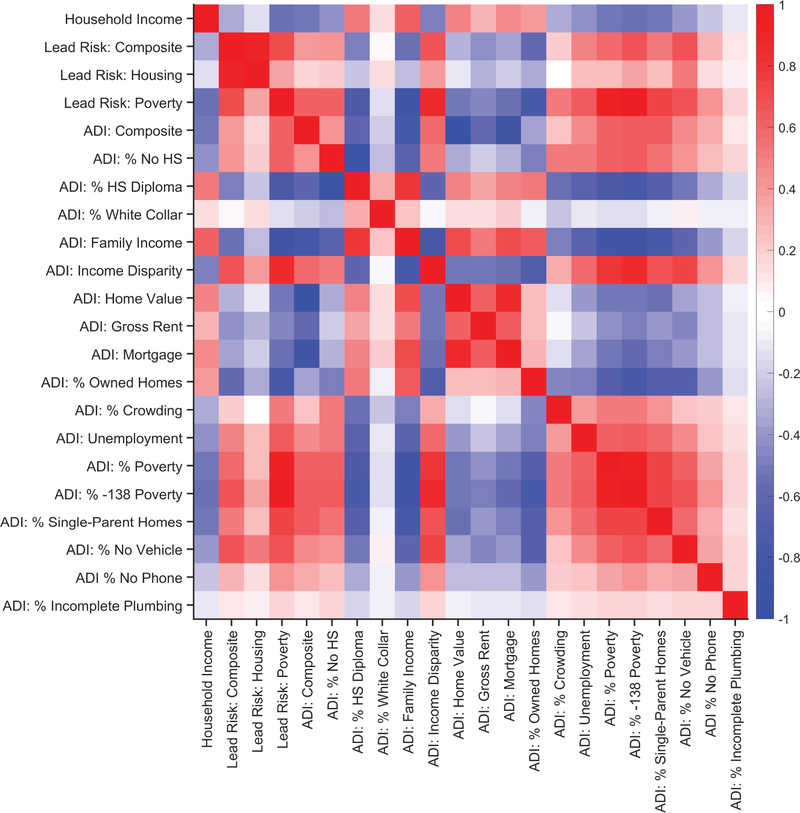
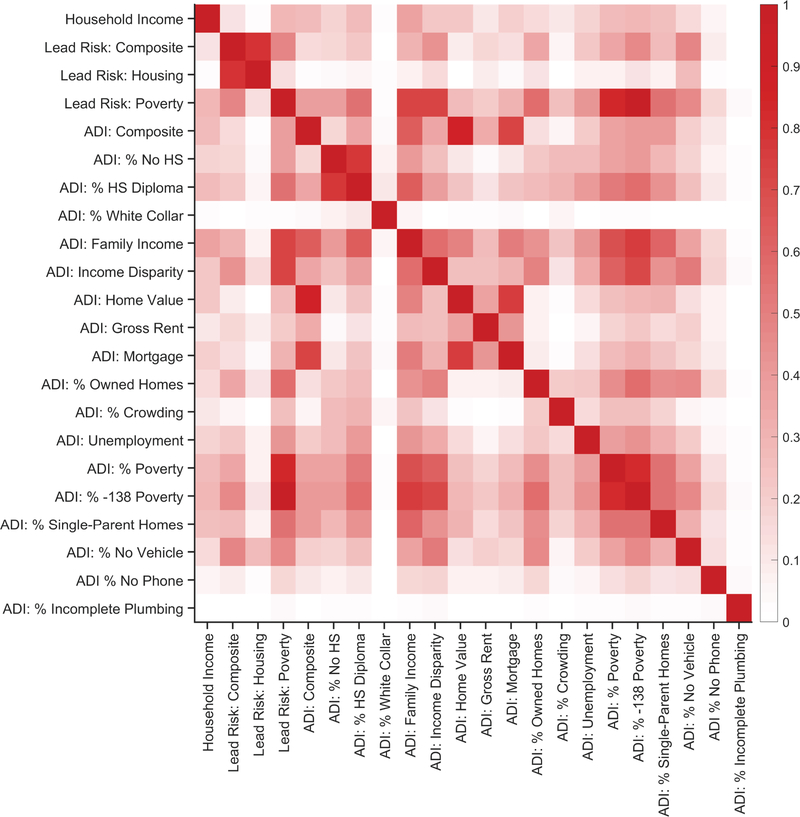
Parent-report family income, lead risk and its two subcomponents, and ADI and its 17 subcomponents were correlated (i.e., 22 total variables). Due to the mix of skewed distributions of the 22 variables, as well as the finite lower and upper asymptotes of each variable, zero-order Spearman’s rank-order correlations were performed. Extended Data Figure 5 shows the zero-order correlation matrix for these 22 variables. For ease of interpretation, Extended Data Figure 6 shows the same correlation matrix as Extended Data Figure 5, but the ρ values from the zero-order correlation matrix were squared (i.e., pseudo-R2 values). Notably, 11.5% of the variance of the lead-risk composite score was accounted for by parent-report household income; 14.1% of the variance of the lead-risk composite score was accounted for by the composite ADI score. Thus, while lead risk is significantly correlated with household income and ADI, there is a considerable amount of variance in the lead-risk score that is unaccounted for with respect to the family poverty (i.e., income) and neighborhood poverty factors (i.e., ADI).
Reporting Summary
Further information on the current research and the ABCD Study is available in the Life Sciences Reporting Summary linked to this article.
Data Availability
ABCD data are publicly available through the National Institute of Mental Health Data Archive (https://data-archive.nimh.nih.gov/abcd). The blood-lead-level data were not collected as part of the ABCD Study and were made available by the corresponding agencies, entities, or individuals identified in the Supplemental Information (Supplemental Table 2); these data are however available from the authors upon reasonable request and with permission of each of the agencies, entities, or individuals.
Extended Data
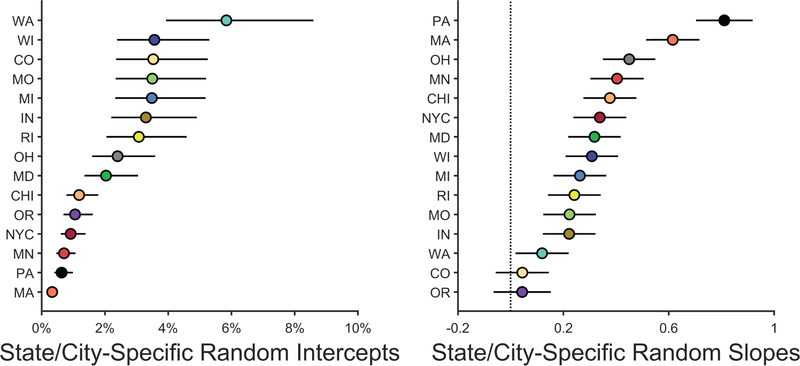
Extended Data Fig. 1. The distribution of random coefficients for each geographic region.
Each data point represents the random intercept (left) or slope (right) for each state/city (i.e., fixed effect coefficient + random effects deviation). The lines surrounding the data points represent the 95% confidence interval of the coefficient. Aside from Oregon and Colorado (for which the 95% confidence intervals included 0), there were significant increases in elevated-blood-lead-level rates with increasing lead-risk scores for each state/city (right). Analysis employed generalized linear-mixed effects models, which tested the statistical significance of coefficients against a t-distribution.
Extended Data Fig. 2. Risk of lead exposure and cognition.
Overall cognitive test scores declined most steeply with increasing risk of environmental lead exposure in children of low-income parents. The data reflect individual participants. Solid lines represent means of the marginal fitted values of the model. Analysis employed linear mixed-effects models, which tested the statistical significance of coefficients against a t-distribution. Age, sex, parental education, and race/ethnicity were included as covariates in this analysis. The scale of the ordinate differs from that in Figure 2.
Extended Data Fig. 3. Negative associations of increased risk of lead exposure are greater for children from lower-income families.
Whole-brain cortical surface area declined most steeply with increasing risk of environmental lead exposure in children of low-income parents. The data reflect individual participants. Solid lines represent means of the marginal fitted values of the model. Analysis employed linear mixed-effects models, which tested the statistical significance of coefficients against a t-distribution. Age, sex, parental education, and race/ethnicity were included as covariates in this analysis. The scale of the ordinate differs from that in Figure 3a.
Extended Data Fig. 4. Negative associations of increased risk of lead exposure are greater for children from lower-income families.
Whole-brain cortical volume declined most steeply with increasing risk of environmental lead exposure in children of low-income parents. The data reflect individual participants. Solid lines represent means of the marginal fitted values of the model. Analysis employed linear mixed-effects models, which tested the statistical significance of coefficients against a t-distribution. Age, sex, parental education, and race/ethnicity were included as covariates in this analysis. The scale of the ordinate differs from that in Figure 3b.
Extended Data Fig. 5. Associations between family income, lead-exposure risk, and area deprivation index.
Zero-order Spearman’s rank-order correlation matrix of parent-report household income, lead risk and its 2 subcomponents, and the area deprivation index (ADI) and its 17 subcomponents. Along the ordinate, from top to bottom, the variables refer to parent-report total annual household income (“Household Income”), the composite lead-risk score (“Lead Risk: Composite”), estimated percentage of homes at risk for lead exposure given lead-based paint (“Lead Risk: Housing”), percentage of individuals below −125 percent of the poverty level (“Lead Risk: Poverty”), the national ADI percentile (“ADI: Composite”), the percentage of the population at least 25 years old with less than 9 years of education (“ADI: % No HS”; HS = high school), the percentage of the population at least 25 years old with at least a high school diploma (“ADI: % HS Diploma”), the percentage of employed persons at least 16 years old in white-collar jobs (“ADI: % White Collar”), median family income (“ADI: Family Income”), income disparity as defined by Singh 67 (“ADI: Income Disparity”), median home value (“ADI: Home Value”), median gross rent (“ADI: Gross Rent”), median monthly mortgage (“ADI: Mortgage”), percentage of owner-occupied housing units (“ADI: % Owned Homes”), percentage of occupied housing units with at least 1 person per room (“ADI: % Crowding”), percentage of civilian labor force at least 16 years old who are unemployed (“ADI: Unemployment”), percentage of families below the poverty level (“ADI: % Poverty”), percentage of the population below 138% of the poverty threshold (“ADI: % −138 Poverty”), percentage of single-parent homes with children who are less than 18 years old (“ADI: % Single-Parent Homes”), percentage of occupied housing units with a motor vehicle (“ADI: % No Vehicle”), percentage of occupied housing units without a telephone (“ADI: % No Phone”), and the percentage of occupied housing units with complete plumbing (“ADI: % Incomplete Plumbing”). With the exception of parent-report household income (which was specific to each family), the lead-risk and ADI data had census-tract-level resolution.
Extended Data Fig. 6. Associations between family income, lead-exposure risk, and area deprivation index.
Zero-order Spearman’s rank-order correlation matrix of parent-report household income, lead risk and its 2 subcomponents, and the area deprivation index (ADI) and its 17 subcomponents, as in Extended Data Figure 5, except that all correlation coefficients were squared (i.e., pseudo-R2). See Extended Data Figure 5 caption for variable names.
Extended Data Fig. 7. Lead exposure risk scores predict Maryland’s blood lead levels at the census-tract level.
Left: Distribution of the census-tract-level geometric means of blood lead levels in Maryland, collapsed across the years of 2010 to 2014. Right: Geometric mean blood lead levels as a function of the estimated risk of lead exposure. The smaller gray data points represent individual census tracts. Two measures of central tendency are provided: The larger darker data points represent the means at each risk level, while the larger open data points represent the medians at each risk level. Analysis employed a Spearman’s rank-order correlation.
Supplementary Material
Acknowledgements
We would like to thank the ABCD participants and their families for their time and dedication to this project, and Gaya Dowling and Chun Chieh Fan for their comments and feedback during the development of this manuscript. We would also like to thank Wesley Thompson for statistical support, comments, and feedback during the development of this manuscript.
ABCD Acknowledgement. Data used in the preparation of this article were obtained from the Adolescent Brain Cognitive Development (ABCD) Study (https://abcdstudy.org/), held in the NIMH Data Archive (NDA). This is a multisite, longitudinal study designed to recruit more than 10,000 children age 9–10 and follow them over 10 years into early adulthood. The ABCD Study is supported by the National Institutes of Health and additional federal partners under award numbers U01DA041022, U01DA041028, U01DA041048, U01DA041089, U01DA041106, U01DA041117, U01DA041120, U01DA041134, U01DA041148, U01DA041156, U01DA041174, U24DA041123, and U24DA041147. A full list of supporters is available at https://abcdstudy.org/federal-partners/. A listing of participating sites and a complete listing of the study investigators can be found at https://abcdstudy.org/principal-investigators/. ABCD consortium investigators designed and implemented the study and/or provided data but did not necessarily participate in analysis or writing of this report. This manuscript reflects the views of the authors and may not reflect the opinions or views of the NIH or ABCD consortium investigators. The ABCD data repository grows and changes over time. The ABCD data used in this report came from https://doi.org/10.15154/1503209.
Footnotes
Competing Interests Statement
The authors declare no competing interests.
References
- 1.Reuben A et al. Association of childhood blood lead levels with cognitive function and socioeonomic status at age 38 years and with IQ change and socioeconomic mobility between childhood and adulthood. JAMA 317, 1244–1251, doi: 10.1001/jama.2017.1712 (2017). [DOI] [PMC free article] [PubMed] [Google Scholar]
- 2.Bellinger DC Very low lead exposures and children’s neurodevelopment. Current Opinion in Pediatrics 20, 172–177, doi: 10.1097/MOP.0b013e3282f4f97b (2008). [DOI] [PubMed] [Google Scholar]
- 3.Canfield RL et al. Intellectual impairments in children with blood lead concentrations below 10 ug per deciliter. The New England Journal of Medicine 348, 1517–1526, doi: 10.1056/NEJMoa022848 (2003). [DOI] [PMC free article] [PubMed] [Google Scholar]
- 4.Lanphear BP, Dietrich K, Auinger P & Cox C Cognitive deficits associated with blood lead concentrations <10 ug/dL in US children and adolescents. Public Health Reports 115, 521–529 (2000). [DOI] [PMC free article] [PubMed] [Google Scholar]
- 5.Needleman HL et al. Deficits in psychologic and classroom performance of children with elevated dentine lead levels. The New England Journal of Medicine 300, doi: 10.1056/NEJM197903293001301 (1979). [DOI] [PubMed] [Google Scholar]
- 6.Wasserman GA et al. The relationship between blood lead, bone lead and child intelligence. Child Neuropsychology 9, 22–34 (2003). [DOI] [PubMed] [Google Scholar]
- 7.Dietrich KN, Ris MD, Succop PA, Berger OG & Bornschein RL Early exposure to lead and juvenile delinquency. Neurotoxicology and Teratology 23, 511–518, doi: 10.1016/S0892--0362(01)001842 (2001). [DOI] [PubMed] [Google Scholar]
- 8.Wright JP et al. Association of prenatal and childhood blood lead concentrations with criminal arrests in early adulthood. PLOS Medicine 5, e101, doi: 10.1371/journal.pmed.0050101 (2008). [DOI] [PMC free article] [PubMed] [Google Scholar]
- 9.Braun JM, Kahn RS, Froehlich T, Auinger P & Lanphear BP Exposures to environmental toxicants and attention deficit hyperactivity disorder in U.S. children. Environmental Health Perspectives 114, 1904–1909, doi: 10.1289/ehp.9478 (2006). [DOI] [PMC free article] [PubMed] [Google Scholar]
- 10.Guilarte TR, Opler M & Pletnikov M Is lead exposure in early life an environmental risk factor for schizophrenia? Neurobiological connections and testable hypotheses. NeuroToxicology 33, 560–574, doi: 10.1016/j.neuro.2011.11.008 (2012). [DOI] [PMC free article] [PubMed] [Google Scholar]
- 11.Mazumdar M et al. Prenatal lead levels, plasma amyloid β levels, and gene expression in young adulthood. Environmental Health Perspectives 120, 702–707, doi: 10.1289/ehp.1104474 (2012). [DOI] [PMC free article] [PubMed] [Google Scholar]
- 12.Wu J et al. Alzheimer’s disease (AD)-like pathology in aged monkeys after infantile exposure to environmental metal lead (Pb): Evidence for a developmental origin and environmental link for AD. The Journal of Neuroscience 28, 3–9, doi: 10.1523/JNEUROSCI.4405-07.2008 (2008). [DOI] [PMC free article] [PubMed] [Google Scholar]
- 13.National Toxicology Program (NTP). NTP Monograph on Health Effects of Low-Level Lead. Available at: http://ntp.niehs.nih.gov/go/36443. (2012). [PubMed]
- 14.Noble KG, Houston SM, Kan E & Sowell ER Neural correlates of socioeconomic status in the developing human brain. Developmental Science 15, 516–527, doi: 10.1111/j.1467-7687.2012.01147.x (2012). [DOI] [PMC free article] [PubMed] [Google Scholar]
- 15.Luders E, Narr KL, Thompson PM & Toga AW Neuroanatomical correlates of intelligence. Intelligence 37, 156–163, doi: 10.1016/j.intell.2008.07.002 (2009). [DOI] [PMC free article] [PubMed] [Google Scholar]
- 16.Hanson JL et al. Family poverty affects the rate of human infant brain growth. PLOS ONE 8, e80954, doi: 10.1371/journal.pone.0080954 (2013). [DOI] [PMC free article] [PubMed] [Google Scholar]
- 17.Noble KG et al. Family income, parental education and brain structure in children and adolescents. Nature Neuroscience 18, 773–778, doi: 10.1038/nn.3983 (2015). [DOI] [PMC free article] [PubMed] [Google Scholar]
- 18.Hair NL, Hanson JL, Wolfe BL & Pollak SD Association of child poverty, brain development, and academic achievement. JAMA Pediatrics 169, 822–829, doi: 10.1001/jamapediatrics.2015.1475 (2015). [DOI] [PMC free article] [PubMed] [Google Scholar]
- 19.Pirkle JL et al. Exposure of the U.S. population to lead, 1991–1994. Environmental Health Perspectives 106, 745–790, doi: 10.1289/ehp.98106745 (1998). [DOI] [PMC free article] [PubMed] [Google Scholar]
- 20.Guilarte TR, Toscano CD, McGlothan JL & Weaver SA Environmental enrichment reverses cognitive and molecular deficits induced by developmental lead exposure. Annals of Neurology 53, 50–56, doi: 10.1002/ana.10399 (2003). [DOI] [PubMed] [Google Scholar]
- 21.Schneider JS, Lee MH, Anderson DW & Lidsky TI Enriched environment during development is protective against lead-induced neurotoxicity. Brain Research 896, 48–55, doi: 10.1016/S0006-8993(00)03249-2 (2001). [DOI] [PubMed] [Google Scholar]
- 22.Dietrich KN et al. Low-level fetal lead exposure effect on neurobehavioral development in early infancy. Pediatrics 80, 721–730 (1987). [PubMed] [Google Scholar]
- 23.Dietrich KN, Succop PA, Berger OG, Hammond PB & Bornschein RL Lead exposure and the cognitive development of urban preschool children: The Cincinnati lead study cohort at age 4 years. Neurotoxicology and Teratology 13, 203–211, doi: 10.1016/0892-0362(91)90012-L (1991). [DOI] [PubMed] [Google Scholar]
- 24.Brubaker CJ, Dietrich KN, Lanphear BP & Cecil KM The influence of age of lead exposure on adult gray matter volume. NeuroToxicology 31, 259–266, doi: 10.1016/j.neuro.2010.03.004 (2010). [DOI] [PMC free article] [PubMed] [Google Scholar]
- 25.Cecil KM et al. Decreased brain volume in adults with childhood lead exposure. PLOS Medicine 5, e112, doi: 10.1371/journal.pmed.0050112 (2008). [DOI] [PMC free article] [PubMed] [Google Scholar]
- 26.Brubaker CJ et al. Altered myelination and axonal integrity in adults with childhood lead exposure: A diffusion tensor imaging study. NeuroToxicology 30, 867–875, doi: 10.1016/j.neuro.2009.07.007 (2009). [DOI] [PMC free article] [PubMed] [Google Scholar]
- 27.Vox. The risk of lead poisoning isn’t just in Flint. So we mapped the risk in every neighborhood in America, <https://www.vox.com/a/lead-exposure-risk-map> (2016).
- 28.Washington Tracking Network. Childhood Lead Risk Map, <https://fortress.wa.gov/doh/wtn/WTNPortal/> (2017).
- 29.Jernigan TL, Brown SA & Dowling GJ The Adolescent Brain Cognitive Development Study. Journal of Research on Adolescence 28, 154–156, doi: 10.1111/jora.12374 (2018). [DOI] [PMC free article] [PubMed] [Google Scholar]
- 30.The ABCD Consortium. Dataset: Release 2.0 and Fix Release 2.0.1. doi: 10.15154/1503209 (2019). [DOI] [Google Scholar]
- 31.Jacobs DE et al. The prevalence of lead-based paint hazards in U.S. housing. Environmental Health Perspectives 110, A599–A606, doi: 10.1289/ehp.021100599 (2002). [DOI] [PMC free article] [PubMed] [Google Scholar]
- 32.Lanphear BP, Byrd RS, Auinger P & Schaffer SJ Community characteristics associated with elevated blood lead levels in children. Pediatrics 101, 264–271 (1998). [DOI] [PubMed] [Google Scholar]
- 33.Wheeler DC, Jones RM, Schootman M & Nelson EJ Explaining variation in elevated blood lead levels among children in Minnesota using neighborhood socioeconomic variables. Science of the Total Environment 650, 970–977, doi: 10.1016/j.scitotenv.2018.09.088 (2019). [DOI] [PubMed] [Google Scholar]
- 34.Luciana M et al. Adolescent neurocognitive development and impacts of substance use: Overview of the adolescent brain cognitive development (ABCD) baseline neurocognition battery. Developmental Cognitive Neuroscience 32, 67–79, doi: 10.1016/j.dcn.2018.02.006 (2018). [DOI] [PMC free article] [PubMed] [Google Scholar]
- 35.Hagler DJ et al. Image processing and analysis methods for the Adolescent Brain Cognitive Development Study. NeuroImage 202, 116091, doi: 10.1016/j.neuroimage.2019.116091 (2019). [DOI] [PMC free article] [PubMed] [Google Scholar]
- 36.Kind AJH et al. Neighborhood socioeconomic disadvantage and 30-day rehospitalization: A retrospective cohort study. Annals of Internal Medicine 161, 765–774, doi: 10.7326/M13-2946 (2014). [DOI] [PMC free article] [PubMed] [Google Scholar]
- 37.Bradley RH & Corwyn RF Socioeconomic status and child development. Annual Review of Psychology 53, 371–399, doi: 10.1146/annurev.psych.53.100901.135233 (2002). [DOI] [PubMed] [Google Scholar]
- 38.Lanphear BP et al. Low-level environmental lead exposure and children’s intellectual function: An international pooled analysis. Environmental Health Perspectives 113, 894–899, doi: 10.1289/ehp.7688 (2005). [DOI] [PMC free article] [PubMed] [Google Scholar]
- 39.Wolf S, Magnuson KA & Kimbro RT Family poverty and neighborhood poverty: Links with children’s school readiness before and after the Great Recession. Child and Youth Services Review 79, 368–384, doi: 10.1016/j.childyouth.2017.06.040 (2017). [DOI] [PMC free article] [PubMed] [Google Scholar]
- 40.Chetty R, Hendren N & Katz LF The effects of exposure to better neighborhoods on children: New evidence from the Moving to Opportunity Experiment. American Economic Review 106, 855–902, doi: 10.1257/aer.20150572 (2016). [DOI] [PubMed] [Google Scholar]
- 41.Farah MJ et al. Environmental stimulation, parental nurturance and cognitive development in humans. Developmental Science 11, 793–801, doi: 10.1111/j.1467-7687.2008.00688.x (2008). [DOI] [PubMed] [Google Scholar]
- 42.Muller C, Sampson RJ & Winter AS Environmental inequality: The social causes and consequences of lead exposure. Annual Review of Sociology 44, 20.21–20.20, doi: 10.1146/annurev-soc-073117-041222 (2018). [DOI] [Google Scholar]
- 43.Magzamen S et al. Quantile regression in environmental health: Early life lead exposure and end-of-grade exams. Environmental Research 137, 108–119, doi: 10.1016/j.envres.2014.12.004 (2015). [DOI] [PubMed] [Google Scholar]
- 44.Lanphear BP & Roghmann KJ Pathways of lead exposure in urban children. Environmental Research 74, 67–73, doi: 10.1006/enrs.1997.3726 (1997). [DOI] [PubMed] [Google Scholar]
- 45.U.S. Environmental Protection Agency. Federal Action Plan to Reduce Childhood Lead Exposures and Associated Health Impacts. Available at: https://www.hud.gov/sites/dfiles/HH/documents/fedactionplan_lead_final.pdf (2018).
- 46.Safer Chemicals Healthier Families. Children at Risk: Gaps in State Lead Screening Policies. Available at: https://saferchemicals.org/get-the-facts/children-at-risk/ (2017).
- 47.Sargent JD et al. Childhood lead poisoning in Massachusetts communities: Its association with sociodemographic and housing characteristics. American Journal of Public Health 85, 528–534 (1995). [DOI] [PMC free article] [PubMed] [Google Scholar]
- 48.Akkus C & Ozdenerol E Exploring childhood lead exposure through GIS: A review of the recent literature. International Journal of Environmental Research and Public Health 11, 6314–6334, doi: 10.3390/ijerph110606314 (2014). [DOI] [PMC free article] [PubMed] [Google Scholar]
- 49.Krieger N et al. Choosing area based socioeconomic measures to monitor social inequalities in low birth weight and childhood lead poisoning: The Public Health Disparities Geocoding Project (US). Journal of Epidemiology and Community Health 57, 186–199 (2003). [DOI] [PMC free article] [PubMed] [Google Scholar]
- 50.Sadler RC How ZIP codes nearly masked the lead problem in Flint, <https://theconversation.com/how-zip-codes-nearly-masked-the-lead-problem-in-flint-65626> (2016).
- 51.Miranda ML, Dolinoy DC & Overstreet MA Mapping for prevention: GIS models for directing childhood lead poisoning prevention programs. Environmental Health Perspectives 110, 947–953 (2002). [DOI] [PMC free article] [PubMed] [Google Scholar]
- 52.State of Alaska Epidemiology Bulletin. Blood Lead Testing Among Children Aged <72 Months - Alaska, 2013–2018. Available at: http://www.epi.alaska.gov/bulletins/docs/b2019_2016.pdf (2019).
- 53.Roy S & Edwards MA Preventing another lead (Pb) in drinking water crisis: Lessons from the Washington D.C. and Flint MI contamination events. Current Opinion in Environmental Science & Health 7, 34–44, doi: 10.1016/j.coesh.2018.10.002 (2019). [DOI] [Google Scholar]
- 54.Elardo R & Bradley RH The home observation for measurement of the environment (HOME) scale: A review of research. Developmental Review 1, 113–145, doi: 10.1016/0273-2297(81)90012-5 (1981). [DOI] [Google Scholar]
- 55.Chen A, Dietrich KN, Ware JH, Radcliffe J & Rogan WJ IQ and blood lead from 2 to 7 years of age: Are the effects in older children the residual of high blood lead concentration in 2-year-olds? Environmental Health Perspectives 113, 597–601, doi: 10.1289/ehp.7625 (2005). [DOI] [PMC free article] [PubMed] [Google Scholar]
- 56.Menezes-Filho JA et al. Environmental co-exposure to lead and manganese and intellectual deficit in school-aged children. International Journal of Environmental Research and Public Health 15, 2418, doi: 10.3390/ijerph15112418 (2018). [DOI] [PMC free article] [PubMed] [Google Scholar]
- 57.Lucchini RG et al. Inverse association of intellectual function with very low blood lead but not with manganese exposure in Italian adolescents. Environmental Research 118, 65–71, doi: 10.1016/j.envres.2012.08.003 (2012). [DOI] [PMC free article] [PubMed] [Google Scholar]
- 58.Hornung RW, Lanphear BP & Dietrich KN Age of greatest susceptibility to childhood lead exposure: A new statistical approach. Environmental Health Perspectives 117, 1309–1312, doi: 10.1289/ehp.0800426 (2009). [DOI] [PMC free article] [PubMed] [Google Scholar]
- 59.Arora M et al. Determining prenatal, early childhood and cumulative long-term lead exposure using micro-spatial deciduous dentine levels. PLOS ONE 9, e97805, doi: 10.1371/journal.pone.0097805 (2014). [DOI] [PMC free article] [PubMed] [Google Scholar]
References (Online Methods)
- 60.Garavan H et al. Recruiting the ABCD sample: Design considerations and procedures. Developmental Cognitive Neuroscience 32, 16–22, doi: 10.1016/j.dcn.2018.04.004 (2018). [DOI] [PMC free article] [PubMed] [Google Scholar]
- 61.U.S. Census Bureau. American Community Survey. Available at: https://www.census.gov/programs-surveys/acs/about.html.
- 62.Casey BJ et al. The Adolescent Brain Cognitive Development (ABCD) study: Imaging acquisition across 21 sites. Developmental Cognitive Neuroscience 32, 43–54, doi: 10.1016/j.dcn.2018.03.001 (2018). [DOI] [PMC free article] [PubMed] [Google Scholar]
- 63.Barch DM et al. Demographic, physical and mental health assessments in the adolescent brain and cognitive development study: Rationale and description. Developmental Cognitive Neuroscience 32, 55–66, doi: 10.1016/j.dcn.2017.10.010 (2018). [DOI] [PMC free article] [PubMed] [Google Scholar]
- 64.Bauer PJ & Zelazo PD IX. NIH Toolbox Cognition Battery (CB): summary, conclusions, and implications for cognitive development. Monogr Soc Res Child Dev 78, 133–146, doi: 10.1111/mono.12039 (2013). [DOI] [PubMed] [Google Scholar]
- 65.Weintraub S et al. Cognition assessment using the NIH Toolbox. Neurology 80, S54–S64 (2013). [DOI] [PMC free article] [PubMed] [Google Scholar]
- 66.Akshoomoff N et al. The NIH Toolbox cognition battery: Results from a large normative developmental sample (PING). Neuropsychology 28, 1–10, doi: 10.1037/neu0000001 (2014). [DOI] [PMC free article] [PubMed] [Google Scholar]
- 67.Singh GK Area deprivation and widening inequalities in US mortality, 1969–1998. American Journal of Public Health 93, 1137–1143 (2003). [DOI] [PMC free article] [PubMed] [Google Scholar]
Associated Data
This section collects any data citations, data availability statements, or supplementary materials included in this article.
Supplementary Materials
Data Availability Statement
ABCD data are publicly available through the National Institute of Mental Health Data Archive (https://data-archive.nimh.nih.gov/abcd). The blood-lead-level data were not collected as part of the ABCD Study and were made available by the corresponding agencies, entities, or individuals identified in the Supplemental Information (Supplemental Table 2); these data are however available from the authors upon reasonable request and with permission of each of the agencies, entities, or individuals.


