

SUMMARY
A major challenge in biology is to understand how complex gene expression patterns are encoded in the genome. While transcriptional enhancers have been studied extensively, few transcriptional silencers have been identified and they remain poorly understood. Here we used a novel strategy to screen hundreds of sequences for tissue-specific silencer activity in whole Drosophila embryos. Strikingly, almost all transcriptional silencers we identified were also active enhancers in other cellular contexts. These elements are bound by more transcription factors than non-silencers. A subset of these silencers form long-range contacts with promoters. Deletion of a silencer caused derepression of its target gene. Our results challenge the common practice of treating enhancers and silencers as separate classes of regulatory elements and suggest the possibility that thousands or more bifunctional CRMs remain to be discovered in Drosophila and 104-105 in human.
Keywords: enhancers, silencers, cis-regulatory elements, transcriptional regulation, repression, promoter looping
Graphical Abstract
eTOC BLURB
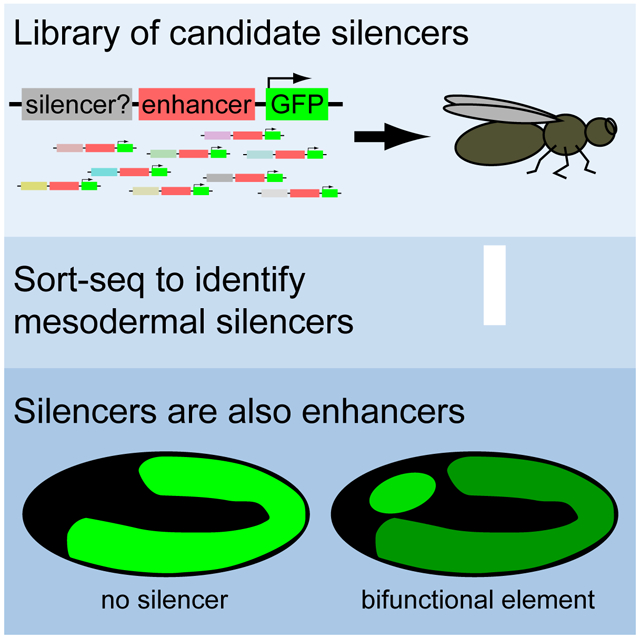
Gisselbrecht et al. performed a screen in developing Drosophila embryos for genomic sequences that can act as transcriptional silencers. They report that nearly all silencers are enhancers in other tissues or at other developmental stages. Their silencers fall into two classes, one of which forms physical chromosomal contacts with promoters.
INTRODUCTION
Precise spatiotemporal control of gene expression is mediated by two types of cis-regulatory modules (CRMs): transcriptional enhancers and silencers (Ogbourne and Antalis, 1998). Investigations of transcriptional regulation in metazoans have focused primarily on cis-regulatory elements that activate gene expression. Transcriptional enhancers play crucial roles in gene regulation by activating gene expression in a tissue-specific manner in development, and in adult cells in response to cellular signals or environmental stimuli. However, it is also important that gene expression not be turned on or up-regulated inappropriately.
Transcriptional silencers – not to be confused with inactive (“silent”) chromatin – are active negative regulatory elements that repress transcription of otherwise active promoters (Ogbourne and Antalis, 1998). They play crucial roles in contributing to the specification of precise gene expression patterns, such as sharp expression domains in a developing organism, by preventing ectopic expression. Like enhancers, silencers are thought to act by providing an array of sequence-specific binding sites on which regulatory proteins can assemble, in this case repressive transcription factors (TFs) (“repressors”). A distinction has been observed between short-range repressors, which typically act within 150 bp of activating TFs to limit their activity, and long-range repressors that can suppress activity of distal enhancers and promoters (Courey and Jia, 2001); silencers are candidate target elements for this latter class of repressors. Whereas enhancers have been characterized extensively, silencers are poorly understood and few have been identified across Metazoa.
Moreover, despite the common treatment of enhancers and silencers as two distinct groups of regulatory elements, a few elements in a variety of eukaryotic systems (Bessis et al., 1997; Jiang et al., 1993; Kallunki et al., 1998; Kehayova et al., 2011; Koike et al., 1995; Prasad and Paulson, 2011; Schaeffer et al., 1995; Simpson et al., 1986; Stathopoulos and Levine, 2005) (e.g., two in Drosophila melanogaster, four in mouse) have been found to exhibit both activities; i.e., they are bifunctional elements that can act as either an enhancer or a silencer, depending on the tissue type or cellular conditions. While many TFs can act as either activators or repressors, depending on the context of the cis-element (Ogbourne and Antalis, 1998) or interactions with other regulators (Fry and Farnham, 1999), bifunctionality of a cis-regulatory module does not require such TFs, since different activators or repressors could bind the same element in different tissues. It has remained unknown how general this property might be and how many such bifunctional elements a typical metazoan genome might contain.
Unlike for enhancer assays, no scalable screening technology is currently available to assay silencer activity in a metazoan. Drosophila melanogaster serves as a powerful model organism for investigations of spatiotemporal gene regulation in a developing animal. The silencer activities of two Drosophila CRMs have been described in the embryonic mesoderm (Jiang et al., 1993; Stathopoulos and Levine, 2005). Furthermore, in vivo genomic occupancies of numerous TFs and chromatin marks have been profiled by chromatin immunoprecipitation (ChIP)-chip or ChIP-Seq (Roy et al., 2010), and the activities of thousands of enhancers (Gallo et al., 2011) have been assayed, in Drosophila embryos. Thus, we reasoned that the developing Drosophila embryonic mesoderm would serve as a valuable model system in which to develop an approach to screen for silencers and then to inspect those silencers for enhancer activity in other tissues. Screening for bifunctional CRMs requires the ability to assay a cis-element for both enhancer activity in one cell type and silencer activity in a different cell type. In order to perform such experiments in vitro, it is necessary to have a candidate cell type for silencer activity; unfortunately, the current state of knowledge is insufficient to be able to predict silencer activity with the information currently available for specific cell lines (van Riel, 2014). We have therefore chosen to assay silencer activity in vivo, using cells isolated from whole embryos, to permit the discovery of silencers across a range of candidate cell types.
We have adapted our previously described technology for highly parallel screening of candidate enhancer sequences in Drosophila embryos (Gisselbrecht et al., 2013) to enrich for sequences displaying active silencing in the embryonic mesoderm. We found that, although we included several different types of genomic sequence in our candidate silencer library, nearly all of the sequences that we found to exhibit mesodermal silencing activity were enhancers in alternate cellular contexts, such as a different cell type or developmental stage. We discovered more bifunctional cis-regulatory modules (CRMs) that act as both enhancers and silencers, depending on the cellular context, than were previously known across all biological systems.
To investigate possible mechanisms of silencer action, we generated high-resolution ‘Hi-C’ chromosome conformation maps, and found evidence for direct physical contacts between silencers and regulated promoters. Several genetic and epigenetic features are enriched in the set of validated silencers that we have identified; however, no combination of commonly profiled chromatin marks provides sufficient predictive power to confidently identify silencers in the absence of experimental testing, suggesting that there may be multiple different classes of silencers comprising different sequence features and chromatin marks. We propose that the widely observed notion of silencers as a separate class of regulatory element from enhancers is an oversimplification, and that dual readout of regulatory information from bifunctional CRMs may be a common phenomenon in transcriptional regulation.
RESULTS
Highly parallel screening for silencer activity
We have adapted our previously described enhancer-FACS-Seq technology for highly parallel screening of elements for enhancer activity in Drosophila embryos (Gisselbrecht et al., 2013), into ‘silencer-FACS-Seq’ (sFS) technology, which enriches for elements that tissue-specifically silence reporter gene expression (see Methods). Briefly, we generated a reporter vector, pSFSdist, which drives GFP expression under the control of an element from a library of candidate silencers, positioned at least 100 bp upstream of a strong, ubiquitous enhancer (ChIPCRM2078; Gisselbrecht et al., 2013). This vector contains a target sequence for a site-specific recombinase, permitting us to assay all tested elements in the same genomically integrated context (Fig. 1A-C). Flies carrying single insertions from the reporter library are crossed to a strain in which expression of the exogenous marker protein rat CD2 is driven in a tissue or cell type of interest, and the resulting informative embryos are dissociated to produce a single-cell suspension. By sorting for CD2+ cells in which GFP expression is reduced from the level driven by the strong ubiquitous enhancer in the absence of silencing activity, we enrich for cells containing silencers active in the cell type of interest, which we then recover and identify by high-throughput sequencing. Insertion of an element with known mesodermal silencing activity (Jiang et al., 1993) into this vector consistently yielded a larger fraction of CD2+GFPreduced cells (Fig. 1E) than were observed when a negative control sequence (derived from E. coli genomic DNA) was used (Fig. 1D).
Figure 1. A highly parallel screen for genomic elements with transcriptional silencer activity in a specified cell type in vivo.

(A) In silencer FACS-Seq (sFS), a library of candidate silencers is used to create a pool of reporter constructs, which are integrated into the Drosophila genome at a defined location. Heterozygous transformant males are crossed to females expressing the CD2 transgene in a tissue of interest, here the embryonic mesoderm. Embryos are collected, aged, and dissociated; cells are stained for CD2 and then cells containing a reporter construct driving reduced GFP expression are sorted and characterized by high-throughput sequencing. Silencer activity in library elements causes enrichment in this population.
(B) The design of the integrated reporter construct.
(C) A stage 11 embryo stained for GFP (green) and CD2 (magenta) shows widespread, high-level GFP expression inside and outside the mesoderm, which is marked with CD2.
(D-F) FACS analysis of CD2+ cells from embryo populations carrying no active silencer (D), a positive control with known mesodermal silencer activity (E), or a library of candidate silencers (F). In the negative control, half of cells come from reporter-negative embryos and express no GFP (green dots) and half express high levels of GFP, causing a shift in the ratio of green to yellow fluorescence (red dots). The reduced GFP population shown in blue represents only noise/scatter from the main populations. Active silencers cause an increase in this population, as seen in (E) and (F).
Selection of elements to test for silencer activity in Drosophila embryos
We designed a library of 591 genomic elements (Table S1), chosen to represent a variety of chromatin states or enhancer activity patterns, to test for silencer activity in the embryonic mesoderm at stages 11–12 (5.5–7.5 hours after embryo deposition). Since general features of silencers are unknown, we designed our library to test three main hypotheses about what kinds of sequences act as silencers in this developmental context.
First, we noted that two bifunctional CRMs had been identified previously in Drosophila (Jiang et al., 1993; Stathopoulos and Levine, 2005) that function as enhancers in one context and as silencers in other contexts. As this phenomenon is known to occur in multiple eukaryotic systems from a small number of examples, and could be important to understanding the architecture of regulatory DNA, we wanted to assess the generality of this phenomenon. Therefore, we selected CRMs from the REDfly and CAD2 databases (Bonn et al., 2012; Gallo et al., 2011) that exhibited no or highly restricted mesodermal expression at embryonic stage 11. We furthermore filtered out elements associated with genes that show widespread mesodermal expression at this stage.
Second, a potential mechanistic signature of transcriptional silencers is binding of well-characterized transcriptional corepressors, by analogy to the prediction of enhancers by binding of the coactivator CBP (Visel et al., 2009). We therefore included genomic elements identified by chromatin immunoprecipitation (Celniker et al., 2009) as binding sites for the corepressors Groucho or CtBP. As Groucho has canonically been associated with long-range repression and CtBP with short-range repression (Courey and Jia, 2001), we predicted that Groucho binding sites would be a richer source of silencer activity in our assay, in which we place candidate silencers more than 100 bp upstream of the enhancer driving reporter gene activity.
Third, we selected genomic regions associated with markers of both enhancers and repressed chromatin structure in whole-mesoderm or whole-embryo experiments (Bonn et al., 2012; Rosenbloom et al., 2015; Thomas et al., 2011). We reasoned that silencers are active regulatory elements, distinct from the silenced chromatin that results from their activity, yet must recruit factors that exert repressive functions, and therefore may show association with both classes of chromatin marks. Moreover, these "bivalent" chromatin states might represent sequences of the abovementioned type, that act as enhancers in one cell type and silencers in another. In this class we included two sets of sequences: (1) DNase I hypersensitive sites (DHSs) that colocalize with ChIP signal for the well-studied repressive chromatin mark histone H3 trimethyllysine 27 (H3K27me3) in sorted mesoderm (Bonn et al., 2012), and (2) coincident mesodermal peaks for H3K27me3, the canonical enhancer mark histone H3 monomethyllysine 4 (H3K4me1), and histone H3 acetyllysine 27 (H3K27ac), which has been associated with active enhancers and promoters (Roadmap Epigenomics Consortium et al., 2015; Zhou et al., 2011). All sequences identified from genome-wide ChIP methods were filtered for absence of widespread mesodermal expression of associated nearby genes (see Methods).
Finally, we included 15 sequences for which enhancer chromosomal contact sequencing (4C-Seq) data for sorted mesodermal cells were available (Ghavi-Helm et al., 2014). We also included three positive control sequences previously shown to have mesodermal silencing activity, and two types of putative negative controls: broadly active mesodermal enhancers, and length-matched regions of E. coli genomic sequence.
Screening for silencer activity in whole Drosophila embryos
We screened our library of genomic elements for silencer activity in embryonic mesoderm in two rounds (see Methods for details). Testing of this library yielded a readily detectable population of mesodermal cells in which green fluorescent protein (GFP) expression was reduced (Fig. 1F); we refer to the elements enriched in these cells as “sFS-positive elements”. Of the 591 sequence elements chosen for inclusion in this library, 501 were genomically integrated into transgenic flies after injection of the pooled library.
We identified overlap with transcription start sites (TSSs) as a highly enriched feature of sFS-positive elements (odds ratio = 3.49, P <10−5, Fisher's exact test), which likely reveals the presence of promoter competition. Competition among promoters for association with active enhancers is one mechanism that has been proposed to account for the specificity with which enhancers target genes for activation (Atkinson and Halfon, 2014; Fulco et al., 2016), and has been shown to restrict enhancer-driven activation of gene expression in reporter assays (Ohtsuki et al., 1998). Overall, the initial set of 41 ‘hits’ that overlapped promoter regions was significantly enriched for mapped instances of the TATA box (Zhu and Halfon, 2009) (P < 0.05, Fisher's exact test). While these are technical positives in our silencer screen, since our goal was to analyze CRMs that silence gene expression by other means, we omitted any sequences that overlapped promoter regions from subsequent analyses. Moreover, many of the library elements we tested overlapped other library elements; we merged these for downstream analysis. After filtering to remove elements that overlapped promoters and collapsing overlapping genomic regions, 29 out of a total of 352 genomic regions tested for mesodermal silencer activity were positive in our sFS screen (Table S2).
Validation of results from sFS screen
In order to validate the results from our sFS screen, we generated pure transgenic lines from a subset of library elements and then assayed their silencer activity by FACS analysis of embryos resulting from these individual reporter strains (Figure 2A,B). Next, we investigated whether the silencers detected by our sFS screen could also silence the activity of enhancers other than the strong, ubiquitous enhancer used in our sFS screen. Thus, we assessed silencing by several sFS-positive elements visually by placing these elements upstream of the following mesoderm-specific enhancers and imaging the resulting GFP expression (Figure 2C-F and see below). ChIPCRM2613 is an intronic enhancer of the panmesodermal gene heartless, and drives reporter gene expression throughout the presumptive mesoderm from the beginning of gastrulation (Gisselbrecht et al., 2013). The Mef2 I-ED5 enhancer drives expression in the fusion-competent myoblasts beginning in late stage 11 (Duan et al., 2001). In every case examined (15 out of 15), at least one of these additional enhancers showed reduced activity in the mesoderm in the context of the tested element (Figure S1 and see below). These results not only verify the silencing activity of these sFS-positive elements, but also demonstrate that silencers are not specific for a particular enhancer.
Figure 2. Validation of individual sFS results.

(A) Flow cytometry of cells prepared from a population of embryos carrying a single library element (bivalent 214, called negative by sFS) shows no increase in the GFPreduced cell population (blue dots).
(B) An sFS-positive element (CtBP3049) reduces GFP expression driven by the ubiquitous enhancer.
(C-D) Age-matched embryos fixed, stained, and imaged in parallel with identical exposure conditions show strong GFP expression driven in the gastrulating mesoderm at embryonic stage 7 by ChIPCRM2613 (C), which is significantly reduced in the presence of the CtBP3049 element (D).
(E-F) A similar reduction of activity driven by the Mef2 I-ED5 enhancer in fusion-competent myoblasts at stage 12 (E) is seen when the CtBP3049 element is present (F). Images are representative of populations of embryos; note that control images are repeated in subsequent figures for optimal comparison of age-matched embryos processed in parallel.
Validated silencers are transcriptional enhancers in other cellular contexts
We analyzed the resulting set of mesodermal silencers to determine which genomic features that we explicitly sampled in the design of our element library were predictive of silencer activity. Despite the inclusion in our sFS library of ChIP peaks for transcriptional corepressors and for a repressive chromatin mark, the only screened element types that were significantly enriched among the active mesodermal silencers were positive controls and non-mesodermal enhancers (Fig. 3A; P = 0.020 for positive controls, 0.0026 for non-mesodermal enhancers, Fisher's exact test). In fact, 22/29 regions containing mesodermal silencers had been previously reported to have enhancer activity. Testing of the remaining seven silencers for enhancer activity revealed that 6/7 also function as enhancers in the embryo (Fig. 3B-G): 5/6 were entirely non-mesodermal, while one showed restricted mesodermal expression (Figure 3F). Altogether, 28/29 of the elements we found to act as mesodermal silencers also exhibited enhancer activity in a different cellular context. Overall, more than 10% (26/200) of previously known enhancers tested in our assay exhibited mesodermal silencer activity. To our knowledge, this constitutes more bifunctional transcriptional regulatory elements than were previously known across all biological systems.
Figure 3. Transcriptional silencers are bifunctional elements with enhancer activity in other contexts.

(A) Sources of genomic sequence chosen for testing by sFS (left) and exhibiting silencer activity detectable by our assay (right). Despite the presence of known corepressors and repressive histone marks, the only significantly enriched sources of mesodermal silencers were positive controls and nonmesodermal enhancers. *: P < 0.05, Fisher's exact test.
(B-G) Six out of seven elements in which we detect silencer activity which were not previously characterized enhancers show embryonic enhancer activity in various tissues, of which 5/6 are nonmesodermal.
hg: hindgut, vnc: ventral nerve cord, epi: epidermis, tr: trachea, hs: head segment, vm: ventral mesoderm.
A different class of bifunctional CRMs was reported recently (Erceg et al., 2017), in which developmental enhancers have an additional function as Polycomb response elements (PREs). PREs provide genomic binding sites for sequence-specific DNA binding proteins that recruit protein subunits of Polycomb repressive complexes (Kassis et al., 2017), and could in principle play a role in silencing target genes. Therefore, we tested the hypothesis that the silencer activity of enhancers discovered in our assay resulted from PRE activity. Only 4/29 regions displaying mesodermal silencer activity overlapped PREs as defined by Erceg et al. on the basis of ChIP for the PRE-binding factors Pho and dSfmbt, vs. 24/323 mesodermal non-silencers (P > 0.2, Fisher's exact test), indicating that PREs are not a major source of mesodermal silencers.
Our results suggest a view of enhancers as CRMs with distinct spatiotemporal patterns of both activation and repression. To further assess the generality of this phenomenon, we visualized the effects of a subset of our newly discovered mesodermal silencers on enhancers active broadly in the mesoderm at different developmental stages. This enabled us to simultaneously evaluate a variety of spatiotemporal domains of silencer and enhancer activity (Figure 4 and Figure S1).
Figure 4. Bifunctional CRMs exhibit spatiotemporal patterns of activation and repression.

(A) The CAD2_CRM2819 element exhibits moderate silencing of transcription driven by multiple enhancers at distinct timepoints.
(B) The e_CoreAbdominalCRE exhibits no detectable silencing in gastrulating embryos (left images) but silences strongly at stage 11-12, when the sFS assay was performed.
(C) The hkb_0.6kbRIRV element exhibits little silencing at stage 12 but very strong silencing during gastrulation, as well as driving expression in the midgut primordia (enh, arrowheads).
(D) The oc_otd186 element is a stronger silencer in the posterior germband than in the anterior germband (small arrows highlight the boundary in these representative embryos) during gastrulation; this spatial pattern of silencer activity is also temporally modulated, as silencing in later embryos is uniformly moderate. We confirmed that this difference does not represent a specific silencer-enhancer interaction by testing the activity of this element in the context of an additional early and late enhancer (bottom row) and observed an identical spatiotemporal pattern. Arrowheads (enh) highlight the previously characterized head expression pattern associated with this element.
(E) The lz_CrystalCellEnhancer appears to show specific enhancer-silencer interactions. Silencing of ChIPCRM2613-driven expression at stage 7 is stronger than silencing of Mef2 I-ED5- or ChIPCRM2497-driven expression at stage 12, but ChIPCRM7759-driven expression at stage 7 appears unaffected. Arrowheads (enh) highlight the known activity of this element in the primordium of the crystal cells. Images are representative of populations of embryos; note that control images are repeated in subsequent figures for optimal comparison of age-matched embryos processed in parallel.
Several elements exhibited apparently uniform silencing activity across the mesoderm and at different stages (Figure 4A and Figure S1B,E). The most commonly observed temporal pattern was a lack of silencing activity at gastrulation, and strong silencing during the later stages at which we performed sFS (Figure 4B and Figure S1A,C,D,F-H). We also observed an element, hkb_0.6kbRIRV, that silenced much more strongly early than late in embryonic development; this element simultaneously acted as an enhancer in its previously characterized pattern in the midgut primordia (Häder et al., 2000)(Figure 4C). One element, the oc otd186 enhancer which we observed to drive expression in the head as described previously (Gao and Finkelstein, 1998), exhibited spatially patterned silencing within the mesoderm during gastrulation but not later in development; silencing was moderate (P < 0.01, t-test) in the anterior portion of the germband, but much stronger in the posterior portion, as seen in the context of two different early pan-mesodermal enhancers (Figure 4D and Figure S2). Two different later-acting mesodermal enhancers showed moderate, uniform silencing across the anteroposterior extent of the germband (Figure 4D). Finally, one tested element exhibited enhancer-specific silencing activity (Figure 4E). The lz Crystal Cell Enhancer (Muratoglu et al., 2007) was a moderately weak silencer when tested on different late-acting mesodermal enhancers and a strong silencer at gastrulation in the context of ChIPCRM2613, yet completely failed to silence activity driven during gastrulation by ChIPCRM7759. These results highlight that silencers exhibit a similarly diverse range of spatiotemporal regulatory patterns to those of enhancers.
Gene regulatory effects of the identified silencers in their native genomic context
To investigate whether silencer activity observed in reporter assays reflects activity of the putative silencer in its native chromosomal context, we first profiled the average mesodermal transcription in the genomic neighborhood of silencers or other functional elements (Figure 5A). Using published RNA-Seq data from sorted mesodermal cells (Gaertner et al., 2012), we aggregated reads within 500-bp windows over a 25-kb region centered on each element, representing the typical size of chromatin state domains (Matthews and White, 2019) observed in a high-resolution Drosophila Hi-C experiment (Eagen et al., 2017). We then averaged over all elements in a class to create a meta-profile of transcript levels surrounding each class of cis-regulatory element. As expected, transcription near a previously published set of mesodermal enhancers (Gisselbrecht et al., 2013) is elevated (Figure 5A). In contrast, transcription near silencers is below the baseline level of transcription observed near a negative control set of genomic regions (see Methods) (Figure 5A). Both effects decay to background levels in the meta-profiles over a scale of approximately 5 kb, suggesting that silencers act within approximately the same distance range as transcriptional enhancers. The bifunctional PREs reported by Erceg et al. are also associated with strongly elevated transcription, but this effect appears to spread more broadly on the chromatin domain scale, suggesting that bifunctional PREs might act by a mechanism that is distinct from that of the silencers we identified in our sFS screen.
Figure 5. A subset of silencers are targets of the mesodermal repressor Snail in their native genomic context.

(A) Mean mesodermal transcript levels in the genomic neighborhood of silencers (blue line) is reduced relative to background genomic elements (grey), while enhancers (magenta) and PREs (red) show locally increased transcription.
(B) Expression of hkb mRNA is significantly derepressed in sorted mesodermal cells homozygous for a deletion of the hkb_0.6RIRV element as compared to wild type mesodermal cells. Mean ± 1 s.e.m. of normalized expression ratio in biological triplicate experiments. P < 0.01, paired-sample t-test.
(C) Silencers are bound by significantly greater numbers of TFs than elements that did not exhibit silencer activity in sFS (Wilcoxon rank sum test).
(D) ChIP-Seq signal for Snail is significantly greater at silencers than at non-silencers (Wilcoxon rank sum test).
(E) Design of a Snail site knockout (KO) experiment. Minimal mutations predicted to disrupt Snail binding were introduced into Sna-bound silencers, which were tested by reporter assay in parallel with wild type elements.
(F) Silencer activity measured by reporter assay (fraction of mesodermal cells with reduced GFP expression) is reduced by Sna site KO in 4 silencers, each of which had one, two, or three Sna sites in the wild type silencer. oc: oc_SBg, gsb: gsb_fragIV, ths: ths_Neu4_early_embryonic_enhancer, brk: brk_NEE-long, neg ctrl: 1-kb E. coli genomic DNA, *: FDR < 0.1, ***: FDR < 0.001, paired sample t-test with Benjamini-Hochberg multiple hypothesis testing correction.
(G) Several known targets of Sna-bound silencers (see Methods) are significantly derepressed in whole snail loss-of-function embryos at stage 7, while targets of Sna-unbound silencers are not derepressed. *: FDR < 0.1, (Rembold et al., 2014)
Next, to further demonstrate the functional importance of the silencers we identified in our sFS screen, we used CRISPR-Cas9 genome editing to generate a Drosophila strain containing a deletion of the hkb_0.6RIRV element. This element was originally reported as an enhancer driving expression of the gap gene huckebein (hkb) at the termini of the blastoderm embryo (Häder et al., 2000), and we identified it as a mesodermal silencer in our screen (see Methods). We sorted mesodermal cells from embryos homozygous for this deletion and from wild type control embryos, and found that hkb RNA is significantly upregulated in the homozygous mutant mesoderm (Figure 5B, P < 0.01, paired-sample t-test), supporting a role for this element in silencing its endogenous target gene during normal embryonic development.
Chromatin features of active silencers
Various types of epigenomic features, including chromatin accessibility, post-translational modifications of histones, and occupancy by TFs and chromatin-modifying enzymes, have been associated with different categories of functional elements in the genome, such as active promoters and enhancers (Calo and Wysocka, 2013; Roadmap Epigenomics Consortium et al., 2015; Ernst and Kellis, 2010; Filion et al., 2010; Heintzman et al., 2007; Roy et al., 2010). However, relatively little is currently known about the chromatin features of active silencers (van Riel, 2014). We therefore explored the epigenomic environment at our set of 29 mesodermal silencers by assessing the enrichment or depletion of signal from various published epigenomic datasets (see Methods), as compared to elements that did not display silencer activity in our sFS screen.
We hypothesized that since bifunctional elements are more functionally complex than CRMs that act only as enhancers, they may exhibit a more complex suite of TF interactions across various tissues. Indeed, we observed that validated silencers are strongly enriched for overlap with highly occupied target (HOT) regions, defined by Roy et al. as exceeding a TF complexity score threshold of ~10 overlapping, bound factors (Roy et al., 2010) (Figure 5C, P < 10−4, Wilcoxon rank sum test). Since silencing activity is likely mediated through the effects of bound sequence-specific transcriptional repressors, we searched our set of 29 mesodermal silencers for enriched combinations of evolutionarily conserved DNA binding site motif occurrences for TFs annotated as repressors (Table S3) (see Methods). The only motif combination significantly enriched (AUROC > 0.65, Benjamini-Hochberg false discovery rate Q < 0.1) among silencers was a three-way combination of the motifs for the TFs Snail, Dorsal, and Tramtrack-PF, which were found together in 12/29 mesodermal silencers (vs. 28/290 sFS-negative elements assessed; AUROC = 0.669, Q = 0.069).
Snail is a well-known repressor of non-mesodermal genes in the developing mesoderm (Leptin, 1991; Nieto, 2002). Dorsal (Jiang et al., 1993) and Tramtrack (Ciglar et al., 2014) have also been shown to have roles in mesodermal gene repression. Analysis of ChIP data for Snail (He et al., 2011) revealed significant enrichment for Snail occupancy at silencers (Figure 5D; P < 10−5, Wilcoxon rank sum test). To validate that this enrichment reflects Snail activity at silencers, we mutated predicted Snail binding sites in 4 silencer elements with high levels of Snail ChIP signal and compared the silencer activity of mutant to wild type sequences within whole embryos in our FACS-based reporter assay (Figure 5E-F). All 4 elements showed significantly reduced silencer activity (FDR < 0.1, paired-sample t-test with Benjamini-Hochberg correction). Mutating sites for an unrelated TF, as a negative control, caused no significant reduction in silencer activity (Figure S3). Intriguingly, while Snail has been well-characterized as a short-range repressor acting within 150 bp (Gray et al., 1994), all the Snail binding sites that we found to be required for full silencer activity are more than 400 bp away from the silenced enhancer in our reporter construct, indicating that Snail can act as a repressor at distances longer than those described for short-range repression.
Finally, we examined evidence for direct action of Snail binding to silencers on the expression of the silencers’ endogenous target genes. Since the majority of elements exhibiting silencer activity in this study were originally reported as enhancers, we could identify published target genes of these bifunctional elements and examine the effect of loss of snail function on their expression (Rembold et al., 2014). Target genes of 12 elements bound by Snail in ChIP-Seq data (He et al., 2011) showed significant derepression (FDR < 0.1 as reported in Rembold et al., 2014) in sna mutant embryos. In contrast, no target of any of 14 Snail-unbound elements was significantly derepressed (Figure 5G). Therefore, we conclude that the known role of Snail in mesodermal repression explains the activity of a large minority (41%) of the observed silencers, while the transcriptional regulators mediating silencing activity through the majority of the silencers remain to be determined.
In an attempt to identify a "silencer signature" analogous to the previously described chromatin signatures of enhancers and promoters (Heintzman et al., 2007), we assembled published ChIP data (Bonn et al., 2012; Celniker et al., 2009; Gaertner et al., 2012), from whole embryos or from sorted mesoderm where available, for several chromatin marks previously associated with active or repressed chromatin states and performed hierarchical clustering of all 352 tested genomic regions according to these histone modification chromatin profiles (Figure S4A). As expected, clusters of elements with greater signal for the repressive marks H3K27me3 and H3K9me3 are enriched for silencers, while other clusters are depleted of them. We also observed, however, that many non-silencers belonged to these clusters, and that some silencers belonged to other clusters that were instead enriched for non-silencers, suggesting that these commonly profiled chromatin marks do not constitute a general chromatin signature of silencers. Similarly, neither the Groucho nor CtBP corepressors were significantly enriched at silencers.
For a subset of silencers (18/29), our individual FACS validation data provided us with a measure of the strength of silencer activity, in terms of the percentage of cells in the GFPreduced population. Using these quantitative estimates of silencer activity, we found that H3K27me3 and H3K9ac, a mark which previously had been associated with bivalent promoters and active enhancers (Ernst et al., 2011; Karmodiya et al., 2012), are significantly correlated with silencer strength across these 18 elements (Figure S4B-D, FDR < 0.1, Spearman correlation test with Benjamini-Hochberg correction), possibly reflecting the fact that mesodermal silencers are active enhancers in other cellular contexts. Altogether, we found that no single mark or combination of marks that we tested from among publicly available histone modification profiles accurately discriminates active silencers as a whole from other types of cis-elements.
Evidence for direct action of silencers on regulated promoters
It has been well established that enhancers can act directly on their target promoters by looping to create direct, three-dimensional physical contacts between genomic elements widely separated in sequence space (Miele and Dekker, 2008; Wang and Chang, 2018). Such contacts have also been shown to play a role in repression by heterochromatin (Dernburg et al., 1996) and at PREs (Ogiyama et al., 2018). Silencers could, in principle, act directly to recruit repressive activities to regulated promoters, or alternatively by sequestering enhancers that would otherwise interact with promoters, or by yet other mechanisms that do not involve focal contacts to regulated elements, such as nucleating a repressive chromatin state which spreads along the chromosome.
We therefore examined data from assays of genomic contacts based on proximity ligation (Miele and Dekker, 2008) to attempt to distinguish among these hypotheses. We observed mesodermal silencer activity in a CRM previously characterized by circular chromosome conformation capture (4C) (Ghavi-Helm et al., 2014). This element makes mesodermally enriched contacts with two regions that overlap the promoters of genes that are not expressed in the mesoderm (Figure 6A), suggesting the possibility that silencing may be mediated by direct silencer-promoter looping.
Figure 6. Evidence for a looping-based mechanism of silencer activity at promoters.

(A) We found mesodermal silencer activity for a CRM closely associated with the ventral mesoderm gene Pox meso and previously shown by 4C to make mesoderm-specific contacts with two different mesodermally inactive promoters.
(B) Schematic showing the generation of sets of negative control regions for library element Hi-C contacts, preserving the distribution of sizes and genomic distances of contacts measured in the Hi-C data.
(C) Genomic regions contacting Sna-unbound silencers are significantly enriched for promoters, as compared to regions contacting non-silencers or Sna-bound silencers (blue bars, left). Corresponding negative control regions are not significantly enriched for contacting promoters (grey bars, right). *: P < 0.05 by Fisher's exact test.
(D) Mesodermal expression of genes with promoters contacted by tested sFS library elements is anticorrelated with H3K27me3 ChIP signal at those elements. *: FDR < 0.1, Spearman correlation test with Benjamini-Hochberg multiple hypothesis testing correction.
(E) Genomic regions contacting silencers are not enriched for overlapping CRMs. Blue and grey bars, as in panel C.
(F) Genomic regions contacting silencers do not show increased occupancy by K4-monomethylated histone H3 in whole embryos, as would be expected if mesodermal silencers were acting directly on non-mesodermal enhancers. Blue and grey bars, as in panel C. *: FDR < 0.1, Spearman correlationWilcoxon rank sum test with Benjamini-Hochberg multiple hypothesis testing correction.
To test the generality of this potential mechanism, we generated Hi-C data from sorted mesodermal and non-mesodermal cells at embryonic stages 11–12, the same developmental stages that we assayed by sFS. We identified mesodermally enriched contacts at 1-kb resolution in each of two paired replicates using the chromoR package (Shavit and Lio, 2014) and compared the results to mesodermally enriched 4C contacts previously reported (Ghavi-Helm et al., 2014). The frequency of random contacts observed in Hi-C assays is greater with closer genomic distance. Therefore, to control for such nonspecific interactions in our analysis, we generated negative control sets of "contact regions" by reflecting each observed contact around the viewpoint region, as previously described (Rao et al., 2014) (Figure 6B and see Methods). Each Hi-C replicate showed significantly greater overlap with 4C contacts than with negative control regions (P < 10−5, Fisher's exact test), indicating that our Hi-C contacts agree with published genomic contacts.
We then examined the features of these mesodermally enriched silencer contacts, as these are potentially targets of silencing activity. We first created a list of these potential targets by filtering for contacts that were observed in both of our Hi-C replicates and that overlap sFS-tested elements, and then examined the (epi)genomic features of these regions. Since the TF Snail (Sna) has previously been associated with short-range repression and "antilooping" (Chopra et al., 2012; Stathopoulos and Levine, 2005), we compared the features of regions contacted by Sna-bound mesodermal silencers, Sna-unbound mesodermal silencers, and elements that did not act as silencers in mesoderm. Regions that made mesoderm-specific contacts to Sna-unbound mesodermal silencers are significantly enriched for overlapping transcription start sites, as compared to those contacting either Sna-bound silencers (FDR < 0.1) or non-silencers (FDR < 0.01, Fisher's exact test with Benjamini-Hochberg multiple hypothesis testing correction; Figure 6C), indicating that the Sna-unbound mesodermal silencers contact promoters. This suggests that Snail-unbound silencers are targeted primarily by long-range repressors, whereas Snail-bound silencers show almost no promoter contacts, consistent with previous reports of short-range repression and antilooping associated with this TF.
Next, we inspected whether the expression levels of silencer-contacted genes were consistent with silencer activity. For genes whose promoters made contacts with any of the 352 tested library elements, we compared RNA-Seq data from sorted mesodermal cells (Gaertner et al., 2012) with the elements’ histone marks that showed significant correlation with silencer activity (Figure S4). The level of H3K27me3 found at a library element was significantly anticorrelated with mesodermal expression of genes contacted by that element (Figure 6D, *: FDR < 0.1, Spearman correlation test with Benjamini-Hochberg multiple hypothesis testing correction), supporting the model of contact-based repression by silencers.
We next sought to test the alternate model that silencers directly contact enhancers that would otherwise be active. Thus, we examined the contacted regions for overlap with CRMs that have been reported to act as enhancers, according to the REDfly database (Gallo et al., 2011). We separately tested each of the three sets of library elements (Sna-bound silencers, Sna-unbound silencers, and non-silencers), and observed no significant enrichment or depletion of CRM contact in any of the sets (Figure 6E). We further reasoned that direct action by silencers on enhancers would result in enrichment of the enhancer mark H3K4me1 in regions that contact silencers. In this scenario, this enrichment should be apparent in histone mark data from whole embryos and across a broad range of timepoints, reflecting their enhancer activity in non-mesodermal tissues and/or other developmental stages. However, we instead observed a significant depletion of H3K4me1 at Sna-unbound silencer contacts vs. non-silencer contacts (P < 0.01, Wilcoxon rank sum test, Figure 6F), which does not support the model of silencers interacting directly with enhancers. Taken together, our results support models in which distinct classes of transcriptional silencers act by antilooping (Figure 7A) or by acting directly on the promoters of repressed genes (Figure 7B). While we cannot rule out the existence of silencers that might sequester enhancers from contacting promoters, our results do not support this alternate mechanism (Figure 7C).
Figure 7. Models for silencer activity.

Bifunctional elements analyzed in this study act as silencers in mesoderm and enhancers in non-mesodermal cells.
(A) Sna-bound silencers appear to act by short-range repression, over distance scales of several hundred bp, to prevent nearby enhancers from activating transcription of target genes.
(B) Sna-unbound silencers loop to promoters, and may repress the same genes that they activate in other cellular contexts or different genes.
(C) Our results do not support the model of long-range repression in which silencers would loop to enhancers to sequester them from acting on the promoters of their target genes.
DISCUSSION
Understanding how CRMs work to control gene expression has been an important biological question for decades. Investigators have addressed this question through various genomic methods focusing on enhancers and their interactions with promoters. In this study, we have developed a highly parallel reporter assay carried out in whole, developing animals to identify a set of transcriptional silencers on the basis of their tissue-specific function. Analysis of RNA-Seq data indicated that genes located near these silencers in their endogenous context are expressed at lower levels. Deletion of one of these elements at its native genomic locus by CRISPR-Cas9 genome editing demonstrated the importance of that element for the proper expression level of its target gene. We also integrated a wide variety of data types from previously published datasets, including ChIP of histone modifications and specific factors, with newly generated tissue-specific 3D chromosomal physical interaction data to assess enriched features of our set of tissue-specific silencers and explore potential mechanisms.
We found that many enhancers are in fact bifunctional elements, capable of up- and down-regulating gene expression in different cellular contexts. While this phenomenon has been observed previously in studies of individual regulatory elements, the extent of CRM bifunctionality had not been appreciated. It is important to note that many CRMs that failed to show silencing activity in our screen are known enhancers that are not active in the tissue tested. Silencers are therefore an identifiable set of active elements, distinct from "quenched" or inactive enhancers that neither activate nor repress gene expression.
Importantly, while prior studies have found histone modifications associated with enhancer activity, our study suggests that despite the extensive genome-scale ChIP profiling studies by numerous investigators and consortia, the available chromatin profiling data are not sufficient to identify silencers. This is possibly explained by the existence of various silencer classes. Alternatively, there are dozens of chromatin marks that have not been characterized extensively which may mark silencers. Expanded efforts in profiling larger sets of tissue-specific chromatin marks might reveal a signature of active silencers. Similarly, we were surprised that corepressor occupancy was not a good predictor of silencers. One potential explanation is that many of these elements may be silencers in other cell types or at other developmental stages than were assayed here, since corepressor ChIP data were generated in whole embryos across a broad range of ages. Another possibility is that different subclasses of CRMs with silencer activity might be endowed with subclass-specific chromatin and/or TF signatures. The list of 29 silencers discovered by our sFS assay provides a training set that can be used for further study of regulatory features that govern silencing.
We observed enriched Snail binding at a subset of mesodermal silencers. Snail is a well-characterized short-range repressor protein acting in the mesoderm (Stathopoulos and Levine, 2005), and has been proposed to act by preventing regulated elements from looping to promoters (Chopra et al., 2012). Our results are consistent with this general model; however, the effects of Snail repression spread over hundreds of base pairs and into neighboring regulatory elements in our reporter assay, in contrast to previously reported limits of short-range repression (Gray and Levine, 1996). Thus, our results indicate that Snail can act by different modes of repression, which to our knowledge had not been observed previously.
We provide evidence supporting a model of silencer activity in which a subset of silencers make direct 3D contacts with the promoters of regulated genes. These physical interactions are important to consider when interpreting genome-wide maps of chromosome conformation. Not all promoter-interacting regions will be acting as enhancers, and it will be necessary to develop approaches that integrate a wide range of genomic data types in order to identify and functionally characterize cis-regulatory elements, including distinguishing those acting as enhancers versus silencers.
It has recently been shown that many developmental enhancers also act as PREs (Erceg et al., 2017). Despite some common features, including evidence for looping to target promoters (Ogiyama et al., 2018) and this study, this set of bifunctional enhancer elements is nearly distinct from the elements we have characterized here that act as both enhancers and silencers, and appears to act by distinct mechanisms. It was previously reported that a Drosophila insulator element has a second role in mediating long-range enhancer-promoter interactions (Fujioka et al., 2009). We suggest that a taxonomy of regulatory elements as enhancers, silencers, insulators, etc. is likely an oversimplification, and that it is more useful to think generally of cis-regulatory modules, which can activate and repress, recruit chromatin modifiers and remodelers, and/or structure the 3D genome, in a context-sensitive fashion.
Pfeiffer et al. estimated that there may be over 50,000 enhancers in the D. melanogaster genome (Pfeiffer et al., 2008), while other studies estimated there may be on the order of 105-106 enhancers in the human genome (Heintzman et al., 2009; Thurman et al., 2012). We detected mesodermal silencer activity in over 10% of tested non-mesodermal enhancers. If these elements are representative of the broader enhancer population, this result suggests that there may be thousands of such bifunctional elements across a range of tissues in Drosophila, and perhaps 104-105 in human; since many of the elements we tested could be silencers in a cell type we did not examine or at a later developmental stage, these numbers are likely even higher. The sFS approach could be adapted in future studies to screen for bifunctional elements in mammals.
Our results suggest that most, if not all, silencers are also enhancers in a different cell type. CRM bifunctionality complicates the understanding of how gene regulation is specified in the genome and how it is read out in different cell types. The observation that the vast majority of complex trait- and disease-associated variants identified from genome-wide association studies (GWAS) map to noncoding sequences, most of which occur within DNase I hypersensitive sites (Maurano et al., 2012), emphasizes the importance of understanding these elements. Characterization of bifunctional elements will help in elucidating how precise gene expression patterns are encoded in the genome and aid in the interpretation of cis-regulatory variation.
STAR★METHODS
LEAD CONTACT AND MATERIALS AVAILABILITY
Further information and requests will be fulfilled by the corresponding author Martha L. Bulyk (mlbulyk@genetics.med.harvard.edu). Materials generated for this study will be shared without restrictions.
EXPERIMENTAL MODEL AND SUBJECT DETAILS
For the sFS screen, pSFSdist reporter constructs was injected into y w nos:ϕC31int; attP40 embryos by Rainbow Transgenic Flies, Inc. (Camarillo, CA). Transgenic male progeny of injected flies were recovered and crossed to twi:CD2 virgin females to generate populations of informative embryos, exactly as previously described (Gisselbrecht et al., 2013). For individual validation of sFS results, we recovered a random sample of library element transgenic fly strains by crossing to y w; dpp14 Bl / CyO, collecting balanced transgene insertions, and self-crossing. To visualize patterned mesodermal silencing or test the potential enhancer activity of elements, we introduced reporter constructs into flies as above. Targeted deletion was performed by injecting a cocktail of CRISPR-Cas9 ribonucleoproteins produced in vitro into OreR flies.
METHOD DETAILS
Generation of reporter vector pSFSdist
Previously (Gisselbrecht et al., 2013) we had blunt-end cloned the 1.8-kb HindIII-SpeI fragment of pPelican (Barolo et al., 2000) (containing a nuclear-localized GFP reporter construct with a gypsy insulator element upstream of the MCS and minimal promoter) into our Drosophila transformation vector pWattB to create the cloning intermediate pWBG1i. Here, we amplified the near-ubiquitous enhancer ChIPCRM2078 identified in that study (dm3 coordinates chr3R:7177448-7178447) from OreR genomic DNA with the primers GGGGGAATTCATTTTTTGCATGTCCTGCCG and GGGGGTACCGCCGATGACTCAGTGGTTAAG, cloned this into the EcoRI and KpnI sites of pWBG1i, and Gateway-converted the resulting pWBG1i-2078 plasmid by blunt-end cloning the Gateway Reading Frame A cassette into the SphI site (distal to ChIPCRM2078, relative to the Hsp70 promoter driving GFP expression) to create pSFSdist (Figure S5).
Design of the candidate silencer library
Nine categories of elements were initially included in the candidate silencer library:
Nonmesodermal enhancers — All annotated cis-regulatory modules (CRMs) were downloaded from the REDfly database (Gallo et al., 2011) on January 17, 2014. These were filtered for length ≤1,100 bp, expression shown in a tissue (i.e., not assayed only in cell culture), lack of mesodermal CRM activity terms, and association with genes that show either no mesodermal expression or sharply restricted mesodermal expression at embryonic stage 11 (when silencing would be assayed). Three additional elements with names containing "NEE" or with the expression term "neurectoderm" were manually added to this set. We removed CRMs entirely contained within other CRMs in our set, and combined overlapping CRMs where this was possible without exceeding 1,100 bp.
Restricted mesodermal enhancers — We downloaded all CRMs from REDfly with expression terms "muscle founder cell," "somatic muscle," or "cardioblast," filtered them for length, assessed each CRM and associated gene for restricted expression (on the theory that CRMs associated with genes with widespread mesodermal expression could not have widespread mesodermal silencing activity), and then collapsed redundant and overlapping CRMs as above. We downloaded the CAD2 database (Bonn et al., 2012) and removed anything with source term "REDfly" (as redundant), anything with expression terms M (mesoderm) or S (somatic mesoderm) at stages 9–12 (as unlikely to show widespread mesodermal silencing), and anything with no evidence of expression. For gene-assigned CRMs, we removed anything assigned to a gene with widespread mesodermal expression at stages 10-12. For unassigned CRMs, we associated each window with nearby genes, where "nearby" is defined as any gene overlapping the window, proximal to an intergenic portion of the window, or overlapping a gene which matches one of the first two criteria; we then removed CRMs associated with genes with widespread or ubiquitous expression, or where the only associated genes had no evidence for an expression pattern.
Groucho ChIP-chip windows — We downloaded two modENCODE Groucho ChIP-chip datasets (modENCODE_597 and modENCODE_623) as binding site .csv files. We filtered the smaller dataset for windows of sequence which overlapped windows in the larger dataset by >100 bp, then length-filtered the resulting common set. We associated each window with nearby genes as above, then downloaded polypeptide and transcript expression terms from FlyBase for the complete list of 520 genes associated with any GRO window by these metrics. We removed any sequence window associated with a gene that has no associated expression terms (to minimize the chance of including genes with unannotated widespread mesodermal expression) or expression terms containing "ubiquitous," "mesoderm," or "muscle."
Positive controls — We included three regions previously shown to have dominant silencing activity in the Drosophila embryonic mesoderm: the zen VRE (Jiang et al., 1993) and ind modules A and BC (Stathopoulos and Levine, 2005).
Negative controls — We included two classes of negative control sequence in our library: CRMs associated with genes with widespread mesodermal expression at stage 11, and ~1-kb regions of E. coli genomic DNA. For the former, we filtered the CAD2 database (Bonn et al., 2012) for CRMs (≤1,100 bp) with well-documented widespread mesodermal expression at st.11 (expression terms M; S,V,C [meaning somatic, visceral, and cardiac mesoderm]; or S,V, in which case we examined the referenced studies to determine if expression appears widespread) and selected additional elements with widespread mesodermal expression from our own prior studies. For the latter, we randomly selected regions of the E. coli genome between 900 and 1,100 bp with G+C content similar to Drosophila noncoding sequence (between 39% and 43% G+C).
"Bivalent" chromatin — We downloaded mapped BiTS-ChIP data (Bonn et al., 2012) showing sequencing reads from isolated mesodermal chromatin immunoprecipitated with total histone H3, H3K4me1, H3K27me3, and H3K27ac. We used MACS (Zhang et al., 2008) separately on each replicate with the -- nomodel parameter to identify extended peaks of histone modification enrichment relative to total H3. Using bedtools (Quinlan Aaron, 2014), we intersected replicates to create high-confidence peak sets, then found the intersection of H3K4me1, H3K27me3, and H3K27ac. After filtering for length ≥200 and ≤1,100 bp, we associated windows with nearby genes as above and removed those that have an associated gene with no expression terms or with an expression term including "ubiquitous." We manually assessed expression patterns of genes associated with the remaining sequence windows and removed those with ubiquitous or widespread mesodermal expression.
DNase I Hypersensitive Sites (DHSs) with repressive marks — We downloaded DNase Accessibility Regions for st.11 (bdtnpDnaseAccS11) from UCSC Table Browser (in dm3 coords, Apr. 2006) (Rosenbloom et al., 2015; Thomas et al., 2011) and intersected them with BiTS-ChIP H3K27me3 enriched peaks defined above. We filtered for length and expression of associated genes as above, adding a requirement for an expression term including "embryonic." As there remained an unmanageably large number of candidate sequences, we used three criteria to prioritize. We counted candidate sequences associated with each gene associated with any candidate sequence, and chose those that represent unique hits for genes of potential interest. These were highly enriched for intragenic windows, so we also prioritized intergenic windows from the broader list. Finally, we included windows of sequence overlapping CtBP ChIP-chip peaks (see below).
CtBP ChIP-chip windows — We downloaded the modENCODE dCtBP ChIP-chip dataset (modENCODE_607) as a binding site .csv file and filtered for length and expression of associated genes as above. We again identified sequence windows representing unique hits to genes of potential interest; these were also highly enriched for intragenic windows, so we chose all intergenic windows on the filtered list for inclusion, then sorted the unique hits by occupancy score and included the highest-scoring ones.
Insulator elements — By changing the configuration of a reporter plasmid (i.e., moving the tested element proximal or distal to the driving enhancer, relative to the promoter), it is possible to distinguish silencer activity from enhancer-blocking insulator activity (Petrykowska et al., 2008). Therefore, for forward-compatibility of our experiments, we included a set of candidate insulator elements in our library. We therefore downloaded BEAF32 ChIP-chip data (Jiang et al., 2009 and modENCODE_21) and intersected all five datasets to identify the highest-confidence peaks. We similarly downloaded and intersected CTCF ChIP-chip data (modENCODE_769 and modENCODE_770), then intersected both of these high-confidence peak sets with each other and with CP190 peaks (modENCODE_22) to generate a list of "Class I insulators" as defined by Nègre et al. (Nègre et al., 2010). We then filtered for length (as above) and for non-overlap with H3K4me3 peaks in the BiTS-ChIP data. We also selected 6 insulator elements curated from the literature by Nègre et al. for inclusion (see Table S1).
For the second round of sFS (see below), we generated a subset of the first-round library by removing any element that overlapped a promoter, as defined below (see Validation of sFS results). We also added 12 elements for which published mesodermal 4C data are available (Ghavi-Helm et al., 2014). We selected elements overlapping HOT regions and those with high H3K9me3 and H3K27me occupancy, features that were enriched in silencers in round 1, in hopes of finding silencers with mesodermal contact information.
To ease the identification of tested elements, we appended a 12-nucleotide barcode to each. These were designed by selecting 12-base sequences that each differ from all others by at least three mismatches, then filtering against a large collection of metazoan TF protein-binding microarray data (Hume et al., 2015; Mariani et al., 2017) for no 8mers with E-scores > 0.35 (Berger et al., 2006) and against a library of Drosophila TF PWMs for no PWM scores > 0.8 (Lenhard and Wasserman, 2002). Barcodes passing all of these filters and not containing BmtI restriction enzyme sites were randomly assigned to library elements.
PCR primer design was with MacVector 11.1.2 (MacVector, Apex, NC) for most library elements, starting from the default parameters and then loosening them until a pair was found. Pairs are prioritized by primer quality (GC content, low repetitive content, pair similarity) and by position (attempting to center the target window within the amplified region, except in cases of densely packed or overlapping targets). For dCtBP ChIP peaks and 4C viewpoints, a Primer3-based computational approach was used initially, again starting with very strict parameters and progressively loosening them until a pair was found. This was run on all 92 dCtBP-derived windows, and succeeded on 78; the remaining 14 were designed with MacVector (MacVector, Apex, NC) as above. Forward primers were prepended with the common SEQ1 primer (Gisselbrecht et al., 2013) followed by the barcode for the corresponding window and a BmtI site; reverse primers were prepended with the common SEQ2 primer and the corresponding barcode. The entire library was then amplified in a two-step PCR amplification process and cloned into pDONR and then into pSFSdist, as in (Gisselbrecht et al., 2013).
Performing silencer-FACS-Seq experiments
We performed two rounds of sFS experiments. For each round, a library of pSFSdist reporter constructs was injected into y w nos:ϕC31int; attP40 embryos by Rainbow Transgenic Flies, Inc. (Camarillo, CA). Transgenic male progeny of injected flies were recovered and crossed to twi:CD2 virgin females (Dunin-Borkowski and Brown, 1995) to generate populations of informative embryos, exactly as previously described (Gisselbrecht et al., 2013). Since the transgenic males carry the library in their germline at only one construct per haploid genome, half of the embryos resulting from crossing these males with females homozygous for twi:CD2 are expected to lack GFP.
We previously described a method for isolation of single cells from Drosophila embryos, at stage 11, that we modified by including an additional incubation step for staining the cells with commercially available Alexa647-conjugated anti(rat CD2) antibody (AbDSerotec, cat. #MCA154A647) (Gisselbrecht et al., 2013). Briefly, we used the same technique in which the cells are stained on ice with a solution composed of 1:40 dilution of the antibody in Schneider medium +8% FBS and 2 μg/mL DAPI. The samples are then washed, filtered with Nytex mesh and the cells processed by FACS. We used the same standard gates as in our previously described method (Gisselbrecht et al., 2013) to isolate viable single cells. The P1 gate (side scatter [SSC-A] vs. forward scatter [FSC-A]) selects cells over debris and yolk granules, the P2 gate (forward scatter amplitude [FSC-A] vs. height [FSC-H]) selects single cells, while the P3 gate (DAPI signal vs. forward scatter plot [FSC-A]) selects live cells. Selection of CD2+ cells is achieved as previously described (far red [APC-A] signal vs. forward scatter [FSC-A]). In addition to using the preexisting "CD2+GFP+" gate, we designed two other yellow [PE-A] vs. green [FITC-A] fluorescence gates for the capture of mesodermal cells in which GFP expression is either completely repressed ("CD2+GFP−") (yellow [PE-A] vs. green [FITC-A] fluorescence) or reduced ("CD2+GFPreduced"), in order to distinguish GFP-lacking cells from those in which GFP expression is reduced. However, as the bulk of GFP− cells carrying no GFP transgene will not have the vector sequences used for PCR recovery of library elements (see below), we sorted both low-GFP populations together in the first round of sFS to capture all cells in which GFP expression is silenced completely or partially.
Figure 1 shows GFP expression profiling (green vs. yellow fluorescence) for 11,031 CD2+ cells from negative control embryos (D), 13,501 cells from positive control embryos (E), and 16,654 cells from embryos containing the candidate silencer library (F). Figure 2 shows such results for 12,878 CD2+ cells from validated negative silencer embryos (A) and 17,891 CD2+ cells from validated positive silencer embryos (B).
Figure S6A shows FACS output for cells isolated from embryos transgenic for a negative control library element in pSFSdist ("MB158" 1-kb E. coli genomic sequence), for the absence of inhibition of GFP expression in twi:CD2+ (mesodermal) cells; Figure S6B shows identical output for cells obtained from our library of candidate silencers inhibiting GFP expression in embryos that express CD2 under the twi promoter.
As discussed below, spot-validation of randomly selected elements from the first round of sFS showed poor specificity; we hypothesized that sorting all CD2+GFP− and CD2+GFPreduced cells together may be introducing noise to our analysis. Moreover, even the strongest silencers tested individually showed only an increase in the CD2+GFPreduced population and not a significant new CD2+GFP− population. We therefore sorted CD2+GFPreduced cells (dark blue in Figure S6B) for round 2 of sFS, with improved validation results as discussed in Results.
Library elements present in each analyzed population were recovered and sequenced exactly as previously described (Gisselbrecht et al., 2013). Briefly, a crude extract of sorted cell genomic DNA serves as template for nested PCR amplification, including 17 cycles with outside primers derived from vector sequence followed by 28 cycles with the SEQ1 and SEQ2 primers present on all library elements. Size-selected PCR products were sonicated and prepared for Illumina sequencing by standard protocols. All finished sequencing libraries were assessed by Agilent 2200 TapeStation and submitted to the Partners Center for Personalized Genetic Medicine for concentration measurement by PicoGreen fluorescence and qPCR, followed by equimolar index pooling and sequencing (50-base paired-end reads) on the Illumina HiSeq 2000.
Validation of sFS results
After the first round of sFS experiments, we recovered a random sample of library element transgenic fly strains for initial validation by crossing individual transgenic male flies, removed from the population cages used to collect embryos after the end of cell sorting experiments, to virgin females of the second chromosome balancer line y w; dpp14 Bl / CyO. After several days, transgenic males were removed and their inserts recovered and identified by PCR and Sanger sequencing; potentially informative lines were recovered and made homozygous by collecting balanced transgene insertions and self-crossing. We selected 20 of these lines to cover a range of possible outcomes from the described analysis: significantly enriched in the CD2+GFPreduced population, significantly depleted, or neither. We prepared population cages as for library sorting, using twi:CD2 virgin females and males of one informative homozygous line for each cage; we also prepared cages in parallel with positive and negative control silencers. (Positive control: zen VRE (Jiang et al., 1993); negative control: Ecoli_control15, 1 kb of E. coli genomic DNA.) We then prepared CD2-stained cells as above, and performed analytical flow cytometry using the same equipment we used for preparative FACS. Our key readout of silencer activity was the fraction of CD2+ cells that fell within a GFPreduced gate designed to exclude the majority of both GFP+ (unsilenced) and GFP− cells (non-expressing or non-transgenic cells, as from the rare non-virgin twi:CD2 female). We measured this fraction for at least two collections of each genotype, typically counting 105 events (>104 viable cells). A library element was considered validated positive if the range of GFPreduced fractions did not overlap that observed for the negative control. Out of the 20 randomly recovered windows tested, 9 scored positive in one or both of the two sFS experiments. Of the 11 sFS negatives, all 11 were negative on individual validation. However, only 5/9 positives validated positive by FACS (see Table S2).
We therefore decided to individually validate all sFS-positive elements from this round to assemble a high-confidence set of validated mesodermal silencers. However, in our initial exploration of the sFS-positive library elements, we noticed that several sequences included as negative controls scored positive, that these largely overlapped the transcriptional start sites (TSSs) of mesodermally expressed genes, and that there was overall a large and significant enrichment for TSS overlap in the set of sequences scoring positive. We suspect that this reflects promoter competition (Ohtsuki et al., 1998), an unavoidable artifact of this experimental design. We therefore filtered the 79 sFS-positive windows to remove those likely to contain core promoter elements. Briefly, we compiled a set of TSS positions by extracting them from several transcript annotation files downloaded from FlyBase (Attrill et al., 2016) version 5.57: all start positions from the all-transcript, all-miscRNA, and all-ncRNA files, plus pre_miRNA start positions from all-miRNA. We assembled coordinates comprising a region of +/− 40 nucleotides around each TSS, and removed those library elements that overlap any of these regions by 10 or more nucleotides. This left 38 sFS-positive non-promoter sequences to validate, 6 of which had already been tested as randomly recovered lines.
For each of the remaining 32 library elements to validate, PCR product from the original library preparation multiwell plates was purified by agarose gel electrophoresis or AMPure bead purification, BP-cloned into pDONR, sequence-verified, and LR-cloned into pSFSdist. Each resulting plasmid was injected into y w nos:phiC31int; attP40 embryos (Gisselbrecht et al., 2013), and white+ heterozygous progeny were recovered and crossed to twi:CD2 virgin females for production of cells for FACS validation as above. This resulted in a high-confidence set of 15 validated, mesodermal silencers. See Table S2 for results of all validation FACS experiments.
We performed a similar spot-validation of randomly retrieved library elements from the second round of sFS (“round 2”) (see Table S2). Four sFS-positive elements were tested and 4/4 showed significant silencing; four sFS-negative elements were tested, and 3/4 gave ranges of CD2+GFPreduced cell fractions that overlapped those from negative control embryos, while the remaining 1/4 was not significantly different (P > 0.05, t-test). We therefore considered the modified protocol reliable and included all round 2 sFS positives, along with individually validated round 1 sFS positives, as "silencers" for all subsequent analyses. After collapsing overlapping genomic regions, we tested a total of 352 genomic regions for mesodermal silencer activity, of which 29 were found positive (see Table S2).
To visualize patterned mesodermal silencing, we generated variants of pSFSdist in which the ubiquitously active ChIPCRM2078 is replaced with one of four more specific mesodermal enhancers: ChIPCRM2613 or ChIPCRM7759, which drive early, widespread mesodermal expression (Gisselbrecht et al., 2013); Mef2 I-ED5, which drives expression specifically in the fusion competent myoblasts of the developing mesoderm (Duan et al., 2001); or ChIPCRM2497, which drives widespread expression in the somatic and cardiac mesoderm from approximately stage 10 (Gisselbrecht et al., 2013). Elements to be tested (a positive control, a negative control, and newly discovered silencers) were Gateway LR-cloned into these vectors and introduced into flies as above; transgenic embryos from homozygous lines or from outcrosses to twi:CD2 were collected, fixed, and stained for GFP expression as previously described (Gisselbrecht et al., 2013). For imaging of fluorescence intensity, embryos were collected, fixed, and stained in parallel with negative control (i.e. enhancer reporter with no active silencer) embryos, imaged with identical exposure times, and processed for presentation without adjustment of brightness, contrast, or gamma. Identical regions of each of 2 to 4 age-matched embryos per genotype were chosen; distribution of pixel values for the indicated regions (magenta boxes, Figures S2) were measured in Photoshop and median green channel intensity is shown. Silenced expression values were compared to values from age-matched negative control embryos by one-tailed heteroscedastic T-test.
To assess spatial distribution of silencing (Figure S2), we used the picture analyzing software ImageJ (Schneider et al., 2012) to measure pixel intensity along the mesoderm, following the shape of the mesoderm in a given embryo. For every embryo, a curve was drawn and its width adjusted to cover the mesoderm, from the base of the developing head to the end of the tail of the embryo. For each pixel along the curve, measured was the mean pixel intensity on a line perpendicular to the tangent of the curve, in the green channel only. The data was then processed to convert the X axis values from pixel number to percentage of the measured section of the mesoderm (percent germband length) to compare among embryos.
Assessing enhancer activity of newly discovered silencers that were not previously known to be enhancers
Of the 29 regions containing silencers reported herein, 22 were originally included in our library of elements to test on the basis of previously characterized enhancer activity (see Fig. 3). The 7 silencers not previously known to be enhancers were assayed by sFS based on their containing ChIP-chip peaks for the corepressors CtBP or Gro, or on the availability of mesodermal 4C data. To test the potential enhancer activity of these elements, they were LR-cloned into our pEFS vector (Gisselbrecht et al., 2013). Transformant lines containing these reporter constructs were generated as above, and embryos were fixed, stained, and imaged as previously described (Gisselbrecht et al., 2013).
Assessing activity of mutated silencers
Silencers for mutational analysis were scanned with a position weight matrix (PWM) for Sna or Dve obtained from CIS-BP (Weirauch et al., 2014) and high-scoring, conserved motif matches were selected. Minimal point mutations were chosen to strongly reduce motif matching, and sequences pre- and post-mutation were scanned with a list of representative Drosophila TF binding motifs from (Gisselbrecht et al., 2013); mutations that created or destroyed binding sites for putative relevant factors were eliminated from consideration. The following mutations were introduced into the indicated elements by site-directed mutagenesis (all in dm6 coordinates):
brk_NEE-long 3X Sna site KO: chrX:7,297,337C->G; chrX:7,297,424C->A; chrX:7,297,456G->T
gsb_fragIV 2X Sna site KO: chr2R:25,057,021G->C; chr2R:25,057,096C->G
oc_SBg 1X Sna site KO: chrX:8,654,207G->T
ths_EEE 3X Sna site KO: chr2R:11,794,330C->G; chr2R:11,794,505G->C; chr2R:11,794,565C->A
ind_moduleA 1X Dve site KO: chr3L:15,039,353-4CC->TT
e_coreAbdCRE 1X Dve site KO: chr3R:21,241,465-6GG->AA
dpp_85.8MX 1X Dve site KO: chr2L:2,456,819-20GG->AA
hkb_0.6kbRIRV 2X Dve site KO: chr3R:4,348,255-6GG->AA; chr3R:4,348,858-9GG->AA
Mutated silencers were then cloned into pSFS and introduced into flies, and pure lines recovered. Mutant and corresponding wild type silencer reporters were assayed by FACS in parallel as described above for silencer validation.
CRISPR-Cas9 targeted deletion of hkb_0.6RIRV element and sorting of mutant mesoderm
We used the online tool “flyCRISPR” (Gratz et al., 2014) to find CRISPR target sites with the highest stringency settings available, to select 20-nucleotide long sites with no predicted off-target sites. The Protospacer adjacent motif (PAM) was set to be NGG only and the “maximum stringency” was selected to be the maximum available which uses a strict algorithm based on off-target cleavage effects observed in cell lines (Gratz et al., 2014). The DNA sequence provided to “flyCRISPR” was selected after inspection on the UCSC genome browser: the two gRNAs necessary for a knock-out were sought near the extremities of the region tested by sFS, in approximate concordance with a local island of increased conservation. The two gRNA sequences used were CTAAAAGATATCTGCTTTCT and CGACTGAAGTTTAGTTACGC. Cas9 protein (Alt-R S.p. Cas9 Nuclease 3NLS), CRISPR RNA (crRNA), and transactivating RNA (tracrRNA) were purchased from IDT (Coralville, IA) and assembled according to IDT protocols following the necessary 2:2:1 molar ratios of crRNA:tracrRNA:Cas9, to a final concentration of 2 mg/mL Cas9 protein. This mixture was injected into the posterior pole of syncitial blastoderm OreR embryos, and surviving male adults were crossed to TM3 virgin females to recover candidate deletion chromosomes. PCR with flanking primers (TCCCACGATAGGATTAGTAGTGT and TGTAAAACATGCATTGGACATGCT) was used to identify lines carrying the desired deletion, and sequencing of the PCR product identified the induced event as a precise deletion of chr3R:4,348,172-4,348,985 (dm6). This chromosome is internally designated MB381-9-3.
A stock was generated containing twi:CD2 on the second chromosome and MB381-9-3 / TM3 twi:Gal4 UAS-EGFP on the third chromosome. Single-cell suspensions at embryonic stages 11–12 were prepared and stained for CD2, as described above, from this stock and the wild type twi:CD2 control. CD2+GFP− cells were sorted from both strains into Trizol, and total RNA was prepared and analyzed in parallel by RT-qPCR to quantitate the relative abundance of mRNA for hkb and for three ubiquitously expressed control genes: daughterless (da), armadillo (arm), and Ribosomal protein L32 (RpL32).
QUANTIFICATION AND STATISTICAL ANALYSIS
Statistical analysis of sFS sequencing reads
Illumina sequencing reads were filtered by pattern matching (in Perl) for beginning with the SEQ1 or SEQ2 primer sequences, representing reads from one end of a PCR-amplified library element. 15.29% of reads (averaged across all libraries) passed this filter. The next 12 nucleotides of each of these reads were extracted and compared to the list of library barcodes; 98.25% matched. Counts for each library element were pooled from both (paired-end) reads of each library to achieve the final measure of abundance ("insert count") for that element in that library.
Paired-end reads for each library element were filtered based on their correlation with non-end reads (i.e. sequencing reads that did not comprise a barcode sequence). For this, and in order for all the reads to be mapped onto the dm3 genome, SQ3 and SQ5 primer sequences were removed, along with barcodes. The reads were then aligned onto the dm3 genome using bowtie (Langmead et al., 2009). The aligned non-end reads from each tested library element were counted using bedtools. Finally, end read counts and non-end read counts for each detected element of the library were compared. Correlation for each week was measured and, overall, the average R2 value was ~0.90. Outliers were used to identify library element barcodes not associated with genomic sequence, presumably representing primer-dimer inclusion in the reporter library; these elements were omitted from downstream analysis.
In our previous work (Gisselbrecht et al., 2013) and using the data therein we tested various analysis methods and found that the original DESeq R package (Anders and Huber, 2010) best predicted the results of individual validation of tested windows. We therefore used that package to compare insert counts for inserts recovered from CD2+ cells in which GFP is reduced or absent to those from "input" cells (sorted CD2+ or CD2− cells without regard for GFP expression status). Each week's sorting was treated as a separate experiment; the CD2+GFPreduced samples from three days of sorting were treated as biological replicates and compared to six input samples (CD2+ and CD2− each from three days of sorting). As extremely low-abundance regions can give anomalously high enrichment/depletion signals, we filtered for "reliably detected" windows by including only those detected in at least one input sample from every day of sorting. As a control, we compared recovered insert counts from CD2+ and CD2− cells. As these are sorted from the same population of embryos without regard to reporter activity, they should show no difference except due to experimental noise; Figure S7 shows an example of the distribution of values seen in this negative control analysis (A) and, for comparison, the results of an experiment used to call silencers (B). As a further test of the reliability of this method, we compared the results of two independent weeks of sorting, for the subset of library elements reliably detected in both weeks, by displaying the results of one analysis colored by the results of the independent experiment. This shows that, while significant depletion calls are highly variable between experiments, significantly enriched library elements are highly concordant. We therefore considered any library element to score positive by sFS if it was significantly enriched (adjusted p-value < 0.1) in the CD2+GFPreduced cell population in either or both of the independent weeks of experiments.
Downstream analysis of the set of high-confidence validated silencers
1. Enrichment of input data types.
Each tested element belonged to one of ten categories, as described above ("Design of the candidate silencer library"). We compared the prevalence of each category among high-confidence validated silencers to its prevalence among non-TSS-overlapping windows confidently detected in either or both of the two experimental repetitions. Statistical significance of enrichment or depletion was calculated using the fisher.test function in R.
2. Mean expression profile around element sets.
The set of 29 mesodermal silencers identified in this study ("silencers") was extended to 25-kb regions centered on each element center. A set of mesodermal enhancers identified by eFS ("enhancers" Gisselbrecht et al., 2013) was identically extended to 25 kb and filtered to remove overlapping regions, yielding a set of 50 genomic regions. The set of ChIP peaks for Pho-RC components identified by Erceg et al. (Erceg et al., 2017) ("PREs") was identically extended and filtered, yielding a set of 982 regions. Finally, a set of 1,000 genomic windows matched to the silencers by GC content and overlap with coding sequence ("background") was generated using the GENRE tool (Mariani et al., 2017; Shokri et al., 2019) and extended and filtered as above. Each element of a given set was divided into 500-bp bins, and mesodermal RNA-Seq reads (Gaertner et al., 2012) overlapping each bin were counted with bedtools. The profiles shown in Figure 5A were generated by averaging, for each distance from element center, the two RNA-Seq replicates for all elements in a set for both bins (upstream and downstream) at that distance.
3. Enrichment of histone marks and TF ChIP signal.
Mesoderm-specific histone modification ChIP-Seq datasets were downloaded from the European Nucleotide Archive (Bonn et al., 2012) or from GEO (Gaertner et al., 2012). Reads mapping to each tested library element (i.e., each non-TSS-overlapping element confidently detected in either or both of the two experiments, each comprising three biological replicates) were counted and, where available, normalized by dividing by total H3 ChIP read count. Whole embryo histone modification ChIP-Seq datasets were downloaded from modENCODE (Celniker et al., 2009) as bedfiles. ChIP-chip or ChIP-Seq data for individual TFs and corepressors were assembled from modENCODE and other sources (Ciglar et al., 2014; Koenecke et al., 2016; Rembold et al., 2014). Mean signal over all tested library elements was calculated using bedtools. Enrichment or depletion was measured by calculating the area under the receiver-operator characteristic curve (AUROC), considering high-confidence validated silencers to be "true positives," using the auROC function of the limma package in R. Statistical significance was assessed using the wilcox.test function (equivalent to the Mann-Whitney U test). P-values were corrected for multiple hypothesis testing using the p.adjust function in R with the "fdr" method. TF complexity scores and HOT regions were downloaded from (Roy et al., 2010) and enrichment of TF complexity score at silencers was tested as above. Clustering was performed with the heatmap function in R, with 1 - Pearson correlation as distance metric and Ward's minimum variance as heirarchical clustering method; major clusters were defined by examining the resulting heatmap before annotating silencer/nonsilencer calls. For correlation analysis, each silencer element that was individually FACS validated had a silencer activity score assigned to it by dividing the fraction of CD2+ cells falling in the GFPreduced gate in each replicate by the equivalent fraction from a negative control experiment performed in parallel and averaging across all replicates. Scores from overlapping regions were averaged to get a single score for each collapsed region. Significant rank correlation or anticorrelation was tested with the cor.test function in R (method="spearman") and p-values were corrected as above.
4. Motif enrichment.
We curated a list of 93 repressive TF binding site motifs (see Table S3). Gene lists were downloaded from FlyBase (download date: February 3, 2015) with the Molecular Function Gene Ontology term GO:0043565 (sequence-specific DNA binding) and either the Biological Process term GO:0000122 (negative regulation of transcription from RNA polymerase II promoter) or the Biological Process term GO:0045892 (negative regulation of transcription, DNA-templated). These were combined and intersected with the list of Drosophila TFs with experimentally determined DNA binding site motifs from CisBP (Weirauch et al., 2014), UniPROBE (Hume et al., 2015), and FlyFactorSurvey (Zhu et al., 2011). For TFs with multiple similar PWMs available, a single representative (learned from ChIP data, where available) was chosen; where a single TF (or its isoforms or heterodimers) gave two unalignable motifs, both were included. We then used the Lever algorithm (Warner et al., 2008) to search for combinations of 1, 2, or 3 motifs enriched among silencers relative to sFS-negative tested elements. We consider a motif or motif combination significantly enriched if it has AUROC ≥ 0.65 and FDR ≤ 0.1.
5. Segmenting silencers by Snail binding.
We defined Snail-bound silencers as elements overlapping Snail ChIP peaks in both ChIP-Seq replicates in (He et al., 2011) (n = 12), and defined Sna-unbound silencers as the half of the silencers with lowest mean binding signal in both replicates (n = 14).
6. Hi-C in sorted cells.
Single cell suspensions were prepared from twi:CD2 homozygous embryos as described above, with the addition of a fixation step after antibody staining. Cells were fixed by addition of formaldehyde to a final concentration of 1% and incubation for 10 minutes at room temperature, followed by quenching with 125mM glycine. Fixed cells were washed and sorted for CD2 expression as described above. Approximately 1.1×10⁷ cells were pooled for each replicate Hi-C experiment. Hi-C libraries were generated using the DpnII enzyme as described (Belaghzal et al., 2017). Hi-C libraries were sequenced on an Illumina HiSeq 4000 platform and 50-base paired-end reads were obtained.
The Hi-C data was mapped to dm3 genome assembly using the cMapping pipeline. Downstream analysis was done using a set of scripts called cWorld. The source code of these software are publicly available at https://github.com/dekkerlab/cMapping and https://github.com/dekkerlab/cworld-dekker. A detailed description of the internals of these tools were published in (Lajoie et al., 2015). The ligation junctions coming from the Hi-C experiments were mapped iteratively using bowtie2 version 2.1.0. The read pairs are mapped independently to determine the interacting loci. Initially, the first 25 nucleotides, from the 5' end, of each read, from both sides: read 1 and read 2, were mapped to the genome. Reads that do not map uniquely are extended 5 nucleotides. This iteration continues until a unique alignment is found. The reads that do not map uniquely are discarded. This produces a list of interacting pairs. BAM files were filtered to remove secondary alignments and read pairs mapping to the same DpnII restriction fragment. One mesodermal and one nonmesodermal replicate removed ~10% of reads in this latter filter, while the other pair of replicates removed 40–50%; we therefore compared samples with similar read fractions. All samples were analyzed using the chromoR package (Shavit and Lio, 2014): each file was read in using the buildCIM command, individual chromosome arm matrices were corrected using the correctCIM command, and mesodermal matrices were compared to nonmesodermal matrices (pairwise as described above) using the compareCIM command with default parameters to generate lists of differential contacts. These lists were filtered for contacts of sFS library elements or 4C viewpoints (Ghavi-Helm et al., 2014) using bedtools. (Table S4)
Differential contacts of 4C viewpoints (Ghavi-Helm et al., 2014) were downloaded and filtered for mesodermally enriched contacts. A set of controls for the published 4C contacts, matched for region size and distribution of distances to viewpoints, was generated by reflecting the contacts around the viewpoint centers (Figure 6B). Any contact for which this operation produced a control not contained on the chromosome arm was omitted from subsequent analysis. Published contacts detected as mesodermally enriched by Hi-C, and controls for which mesodermally enriched Hi-C contacts were detected, were counted: Hi-C replicate 1 detected 111 published 4C contacts and 51 controls (P < 10−5, Fisher's exact test), and Hi-C replicate 2 detected 147 published 4C contacts and 78 controls (P < 10−5, Fisher's exact test).
A set of controls for mesodermally enriched Hi-C contacts of sFS library elements was generated as described above for 4C viewpoints. Mean whole embryo H3K4me1 ChIP signal was calculated for contacts as described above for library elements; significance of enrichment/depletion at silencer contacts (or controls) vs. non-silencer contacts (or controls) was assessed with the Wilcoxon rank sum test as above.
Contact and control lists were filtered for overlapping TSSs as described above; reads mapping to exons of contact genes were counted from published sorted mesoderm RNA-Seq data (Gaertner et al., 2012) and converted to Reads Per Kilobase per Million reads (RPKM). Significant rank correlation or anticorrelation of contact gene expression to library element histone modification ChIP signals was tested with the cor.test function in R (method="spearman") and p-values were corrected as above.
Normalization of qPCR data from sorted cells
The ratio of hkb mRNA abundance in MB381-9-3 homozygous mesodermal RNA to that in wild type mesodermal RNA was calculated directly (as 1/2ΔCq), and normalized for input cell number and RNA content by dividing by the average of abundance ratios identically calculated for da, arm, and RpL32. We determined the normalized ratio separately from cells prepared from three independent collections of embryos and report the mean and 1 s.e.m. of the three experiments. To test statistical significance, the normalized Cq (hkb Cq / mean of control Cqs) was determined for each sample and the three MB381-9-3 values were compared to wild type values by paired-sample t-test.
DATA AND SOFTWARE AVAILABILITY
Data
All data resulting from our sFS screen are available in Table S2. Processed Hi-C data for sFS library elements are in Table S4.
Raw image data are available on Mendeley: http://dx.doi.org/10.17632/cn5ycthbss.1
sFS and Hi-C sequencing reads are available with GEO Accession # GSE137958.
Scripts
All custom scripts used in this study are available upon request.
Supplementary Material
Table S1. Library elements, related to Figure 1
Table S2. sFS results (with validation), related to Figure 2
Table S3. Repressor TF motifs, related to Figure 5
Table S4. Hi-C results, related to Figure 6
HIGHLIGHTS.
Silencers are bifunctional and can act as enhancers in other cellular contexts
A subset of silencers form long-range contacts to promoters
Deletion of a silencer by genome editing caused de-repression of its target gene
Results suggest that thousands of bifunctional elements in fly remain to be discovered
ACKNOWLEDGMENTS
We thank Katy Weinand, Yiling Qiu and Grigoriy Losyev for technical assistance; Ricardo Ramirez and Yuliya Sytnikova for helpful discussion; Kian Hong Kock for critical reading of the manuscript. This work was funded by NIH grant R01 HG009723 (M.L.B.). J.M.R. was funded by the Bioinformatics and Integrative Genomics training grant from NHGRI (T32 HG002295).
Footnotes
DECLARATION OF INTERESTS
The authors declare no competing interests.
Publisher's Disclaimer: This is a PDF file of an unedited manuscript that has been accepted for publication. As a service to our customers we are providing this early version of the manuscript. The manuscript will undergo copyediting, typesetting, and review of the resulting proof before it is published in its final form. Please note that during the production process errors may be discovered which could affect the content, and all legal disclaimers that apply to the journal pertain.
REFERENCES
- Anders S, and Huber W (2010). Differential expression analysis for sequence count data. Genome Biol 11, R106. [DOI] [PMC free article] [PubMed] [Google Scholar]
- Atkinson TJ, and Halfon MS (2014). REGULATION OF GENE EXPRESSION IN THE GENOMIC CONTEXT. Computational and Structural Biotechnology Journal 9, e201401001. [DOI] [PMC free article] [PubMed] [Google Scholar]
- Attrill H, Falls K, Goodman JL, Millburn GH, Antonazzo G, Rey AJ, Marygold SJ, and the FlyBase, c. (2016). FlyBase: establishing a Gene Group resource for Drosophila melanogaster. Nucleic Acids Res 44, D786–D792. [DOI] [PMC free article] [PubMed] [Google Scholar]
- Barolo S, Carver LA, and Posakony JW (2000). GFP and beta-Galactosidase Transformation Vectors for Promoter/Enhancer Analysis in Drosophila. Biotechniques 29, 726–732. [DOI] [PubMed] [Google Scholar]
- Belaghzal H, Dekker J, and Gibcus JH (2017). Hi-C 2.0: An optimized Hi-C procedure for high-resolution genome-wide mapping of chromosome conformation. Methods 123, 56–65. [DOI] [PMC free article] [PubMed] [Google Scholar]
- Berger MF, Philippakis AA, Qureshi AM, He FS, Estep PW 3rd, and Bulyk ML (2006). Compact, universal DNA microarrays to comprehensively determine transcription-factor binding site specificities. Nat Biotechnol 24, 1429–1435. [DOI] [PMC free article] [PubMed] [Google Scholar]
- Bessis A, Champtiaux N, Chatelin L, and Changeux J-P (1997). The neuron-restrictive silencer element: A dual enhancer/silencer crucial for patterned expression of a nicotinic receptor gene in the brain. Proceedings of the National Academy of Sciences 94, 5906. [DOI] [PMC free article] [PubMed] [Google Scholar]
- Bonn S, Zinzen RP, Girardot C, Gustafson EH, Perez-Gonzalez A, Delhomme N, Ghavi-Helm Y, Wilczyήski B, Riddell A, and Furlong EEM (2012). Tissue-specific analysis of chromatin state identifies temporal signatures of enhancer activity during embryonic development. Nature genetics 44, 148. [DOI] [PubMed] [Google Scholar]
- Calo E, and Wysocka J (2013). Modification of Enhancer Chromatin: What, How, and Why? Mol Cell 49, 825–837. [DOI] [PMC free article] [PubMed] [Google Scholar]
- Celniker SE, Dillon LAL, Gerstein MB, Gunsalus KC, Henikoff S, Karpen GH, Kellis M, Lai EC, Lieb JD, MacAlpine DM, et al. (2009). Unlocking the secrets of the genome. Nature 459, 927. [DOI] [PMC free article] [PubMed] [Google Scholar]
- Chopra VS, Kong N, and Levine M (2012). Transcriptional repression via antilooping in the Drosophila embryo. Proceedings of the National Academy of Sciences 109, 9460. [DOI] [PMC free article] [PubMed] [Google Scholar]
- Ciglar L, Girardot C, Wilczyński B, Braun M, and Furlong EEM (2014). Coordinated repression and activation of two transcriptional programs stabilizes cell fate during myogenesis. Development 141, 2633. [DOI] [PMC free article] [PubMed] [Google Scholar]
- Courey AJ, and Jia S (2001). Transcriptional repression: the long and the short of it. Genes & development 15, 2786–2796. [DOI] [PubMed] [Google Scholar]
- Dernburg AF, Broman KW, Fung JC, Marshall WF, Philips J, Agard DA, and Sedat JW (1996). Perturbation of Nuclear Architecture by Long-Distance Chromosome Interactions. Cell 85, 745–759. [DOI] [PubMed] [Google Scholar]
- Duan H, Skeath JB, and Nguyen HT (2001). Drosophila Lame duck, a novel member of the Gli superfamily, acts as a key regulator of myogenesis by controlling fusion-competent myoblast development. Development 128, 4489. [DOI] [PubMed] [Google Scholar]
- Dunin-Borkowski OM, and Brown NH (1995). Mammalian CD2 Is an Effective Heterologous Marker of the Cell Surface in Drosophila. Developmental biology 168, 689–693. [DOI] [PubMed] [Google Scholar]
- Eagen KP, Aiden EL, and Kornberg RD (2017). Polycomb-mediated chromatin loops revealed by a subkilobase-resolution chromatin interaction map. Proceedings of the National Academy of Sciences 114, 8764. [DOI] [PMC free article] [PubMed] [Google Scholar]
- Erceg J, Pakozdi T, Marco-Ferreres R, Ghavi-Helm Y, Girardot C, Bracken AP, and Furlong EEM (2017). Dual functionality of cis-regulatory elements as developmental enhancers and Polycomb response elements. Genes & development 31, 590–602. [DOI] [PMC free article] [PubMed] [Google Scholar]
- Ernst J, and Kellis M (2010). Discovery and characterization of chromatin states for systematic annotation of the human genome. Nature Biotechnology 28, 817. [DOI] [PMC free article] [PubMed] [Google Scholar]
- Ernst J, Kheradpour P, Mikkelsen TS, Shoresh N, Ward LD, Epstein CB, Zhang X, Wang L, Issner R, Coyne M, et al. (2011). Mapping and analysis of chromatin state dynamics in nine human cell types. Nature 473, 43. [DOI] [PMC free article] [PubMed] [Google Scholar]
- Filion GJ, van Bemmel JG, Braunschweig U, Talhout W, Kind J, Ward LD, Brugman W, de Castro IJ, Kerkhoven RM, Bussemaker HJ, et al. (2010). Systematic Protein Location Mapping Reveals Five Principal Chromatin Types in Drosophila Cells. Cell 143, 212–224. [DOI] [PMC free article] [PubMed] [Google Scholar]
- Fry CJ, and Farnham PJ (1999). Context-dependent Transcriptional Regulation. Journal of Biological Chemistry 274, 29583–29586. [DOI] [PubMed] [Google Scholar]
- Fujioka M, Wu X, and Jaynes JB (2009). A chromatin insulator mediates transgene homing and very long-range enhancer-promoter communication. Development 136, 3077. [DOI] [PMC free article] [PubMed] [Google Scholar]
- Fulco CP, Munschauer M, Anyoha R, Munson G, Grossman SR, Perez EM, Kane M, Cleary B, Lander ES, and Engreitz JM (2016). Systematic mapping of functional enhancer–promoter connections with CRISPR interference. Science 354, 769. [DOI] [PMC free article] [PubMed] [Google Scholar]
- Gaertner B, Johnston J, Chen K, Wallaschek N, Paulson A, Garruss Alexander S., Gaudenz K, De Kumar B, Krumlauf R, and Zeitlinger J (2012). Poised RNA Polymerase II Changes over Developmental Time and Prepares Genes for Future Expression. Cell Reports 2, 1670–1683. [DOI] [PMC free article] [PubMed] [Google Scholar]
- Gallo SM, Gerrard DT, Miner D, Simich M, Des Soye B, Bergman CM, and Halfon MS (2011). REDfly v3.0: toward a comprehensive database of transcriptional regulatory elements in Drosophila. Nucleic Acids Res 39, D118–D123. [DOI] [PMC free article] [PubMed] [Google Scholar]
- Gao Q, and Finkelstein R (1998). Targeting gene expression to the head: the Drosophila orthodenticle gene is a direct target of the Bicoid morphogen. Development 125, 4185. [DOI] [PubMed] [Google Scholar]
- Ghavi-Helm Y, Klein FA, Pakozdi T, Ciglar L, Noordermeer D, Huber W, and Furlong EEM (2014). Enhancer loops appear stable during development and are associated with paused polymerase. Nature 512, 96. [DOI] [PubMed] [Google Scholar]
- Gisselbrecht SS, Barrera LA, Porsch M, Aboukhalil A, Estep Iii PW, Vedenko A, Palagi A, Kim Y, Zhu X, Busser BW, et al. (2013). Highly parallel assays of tissue-specific enhancers in whole Drosophila embryos. Nature Methods 10, 774. [DOI] [PMC free article] [PubMed] [Google Scholar]
- Gratz SJ, Ukken FP, Rubinstein CD, Thiede G, Donohue LK, Cummings AM, and O’Connor-Giles KM (2014). Highly Specific and Efficient CRISPR/Cas9-Catalyzed Homology-Directed Repair in Drosophila. Genetics 196, 961. [DOI] [PMC free article] [PubMed] [Google Scholar]
- Gray S, and Levine M (1996). Short-range transcriptional repressors mediate both quenching and direct repression within complex loci in Drosophila. Genes & development 10, 700–710. [DOI] [PubMed] [Google Scholar]
- Gray S, Szymanski P, and Levine M (1994). Short-range repression permits multiple enhancers to function autonomously within a complex promoter. Genes & development 8, 1829–1838. [DOI] [PubMed] [Google Scholar]
- Häder T, Wainwright D, Shandala T, Saint R, Taubert H, Brönner G, and Jäckle H (2000). Receptor tyrosine kinase signaling regulates different modes of Groucho-dependent control of Dorsal. Current Biology 10, 51–54. [DOI] [PubMed] [Google Scholar]
- He Q, Bardet AF, Patton B, Purvis J, Johnston J, Paulson A, Gogol M, Stark A, and Zeitlinger J (2011). High conservation of transcription factor binding and evidence for combinatorial regulation across six Drosophila species. Nature genetics 43, 414. [DOI] [PubMed] [Google Scholar]
- Heintzman ND, Hon GC, Hawkins RD, Kheradpour P, Stark A, Harp LF, Ye Z, Lee LK, Stuart RK, Ching CW, et al. (2009). Histone modifications at human enhancers reflect global cell-type-specific gene expression. Nature 459, 108–112. [DOI] [PMC free article] [PubMed] [Google Scholar]
- Heintzman ND, Stuart RK, Hon G, Fu Y, Ching CW, Hawkins RD, Barrera LO, Van Calcar S, Qu C, Ching KA, et al. (2007). Distinct and predictive chromatin signatures of transcriptional promoters and enhancers in the human genome. Nat Genet 39, 311–318. [DOI] [PubMed] [Google Scholar]
- Hume MA, Barrera LA, Gisselbrecht SS, and Bulyk ML (2015). UniPROBE, update 2015: new tools and content for the online database of protein-binding microarray data on protein–DNA interactions. Nucleic Acids Res 43, D117–D122. [DOI] [PMC free article] [PubMed] [Google Scholar]
- Jiang J, Cai H, Zhou Q, and Levine M (1993). Conversion of a dorsal-dependent silencer into an enhancer: evidence for dorsal corepressors. The EMBO journal 12, 3201–3209. [DOI] [PMC free article] [PubMed] [Google Scholar]
- Jiang N, Emberly E, Cuvier O, and Hart CM (2009). Genome-Wide Mapping of Boundary Element-Associated Factor (BEAF) Binding Sites in Drosophila melanogaster Links BEAF to Transcription. Mol Cell Biol 29, 3556–3568. [DOI] [PMC free article] [PubMed] [Google Scholar]
- Kallunki P, Edelman GM, and Jones FS (1998). The neural restrictive silencer element can act as both a repressor and enhancer of L1 cell adhesion molecule gene expression during postnatal development. Proceedings of the National Academy of Sciences 95, 3233. [DOI] [PMC free article] [PubMed] [Google Scholar]
- Karmodiya K, Krebs AR, Oulad-Abdelghani M, Kimura H, and Tora L (2012). H3K9 and H3K14 acetylation co-occur at many gene regulatory elements, while H3K14ac marks a subset of inactive inducible promoters in mouse embryonic stem cells. BMC Genomics 13, 424. [DOI] [PMC free article] [PubMed] [Google Scholar]
- Kassis JA, Kennison JA, and Tamkun JW (2017). Polycomb and Trithorax Group Genes in Drosophila. Genetics 206, 1699. [DOI] [PMC free article] [PubMed] [Google Scholar]
- Kehayova P, Monahan K, Chen W, and Maniatis T (2011). Regulatory elements required for the activation and repression of the protocadherin-α gene cluster. Proceedings of the National Academy of Sciences 108, 17195. [DOI] [PMC free article] [PubMed] [Google Scholar]
- Koenecke N, Johnston J, Gaertner B, Natarajan M, and Zeitlinger J (2016). Genome-wide identification of Drosophila dorso-ventral enhancers by differential histone acetylation analysis. Genome Biology 17, 196. [DOI] [PMC free article] [PubMed] [Google Scholar]
- Koike S, Schaeffer L, and Changeux JP (1995). Identification of a DNA element determining synaptic expression of the mouse acetylcholine receptor delta-subunit gene. Proceedings of the National Academy of Sciences 92, 10624. [DOI] [PMC free article] [PubMed] [Google Scholar]
- Lajoie BR, Dekker J, and Kaplan N (2015). The Hitchhiker’s guide to Hi-C analysis: Practical guidelines. Methods 72, 65–75. [DOI] [PMC free article] [PubMed] [Google Scholar]
- Langmead B, Trapnell C, Pop M, and Salzberg SL (2009). Ultrafast and memory-efficient alignment of short DNA sequences to the human genome. Genome Biology 10, R25. [DOI] [PMC free article] [PubMed] [Google Scholar]
- Lenhard B, and Wasserman W (2002). TFBS: Computational framework for transcription factor binding site analysis. Bioinformatics 18, 1135–1136. [DOI] [PubMed] [Google Scholar]
- Leptin M (1991). twist and snail as positive and negative regulators during Drosophila mesoderm development. Genes & development 5, 1568–1576. [DOI] [PubMed] [Google Scholar]
- Mariani L, Weinand K, Vedenko A, Barrera LA, and Bulyk ML (2017). Identification of Human Lineage-Specific Transcriptional Coregulators Enabled by a Glossary of Binding Modules and Tunable Genomic Backgrounds. Cell Systems 5, 187–201.e187. [DOI] [PMC free article] [PubMed] [Google Scholar]
- Matthews NE, and White R (2019). Chromatin Architecture in the Fly: Living without CTCF/Cohesin Loop Extrusion? BioEssays 0, 1900048. [DOI] [PubMed] [Google Scholar]
- Maurano MT, Humbert R, Rynes E, Thurman RE, Haugen E, Wang H, Reynolds AP, Sandstrom R, Qu H, Brody J, et al. (2012). Systematic Localization of Common Disease-Associated Variation in Regulatory DNA. Science 337, 1190. [DOI] [PMC free article] [PubMed] [Google Scholar]
- Miele A, and Dekker J (2008). Long-range chromosomal interactions and gene regulation. Molecular BioSystems 4, 1046–1057. [DOI] [PMC free article] [PubMed] [Google Scholar]
- Muratoglu S, Hough B, Mon ST, and Fossett N (2007). The GATA factor Serpent cross-regulates lozenge and u-shaped expression during Drosophila blood cell development. Developmental biology 311, 636–649. [DOI] [PMC free article] [PubMed] [Google Scholar]
- Nègre N, Brown CD, Shah PK, Kheradpour P, Morrison CA, Henikoff J, Feng X, Ahmad K, Russell S, White RAH, et al. (2010). A Comprehensive Map of Insulator Elements for the Drosophila Genome. PLoS Genet 6, e1000814. [DOI] [PMC free article] [PubMed] [Google Scholar]
- Nieto MA (2002). The snail superfamily of zinc-finger transcription factors. Nature Reviews Molecular Cell Biology 3, 155. [DOI] [PubMed] [Google Scholar]
- Ogbourne S, and Antalis TM (1998). Transcriptional control and the role of silencers in transcriptional regulation in eukaryotes. Biochemical Journal 331, 1–14. [DOI] [PMC free article] [PubMed] [Google Scholar]
- Ogiyama Y, Schuettengruber B, Papadopoulos GL, Chang J-M, and Cavalli G (2018). Polycomb-Dependent Chromatin Looping Contributes to Gene Silencing during Drosophila Development. Mol Cell 71, 73–88.e75. [DOI] [PubMed] [Google Scholar]
- Ohtsuki S, Levine M, and Cai HN (1998). Different core promoters possess distinct regulatory activities in the Drosophila embryo. Genes & development 12, 547–556. [DOI] [PMC free article] [PubMed] [Google Scholar]
- Petrykowska HM, Vockley CM, and Elnitski L (2008). Detection and characterization of silencers and enhancer-blockers in the greater CFTR locus. Genome research 18, 1238–1246. [DOI] [PMC free article] [PubMed] [Google Scholar]
- Pfeiffer BD, Jenett A, Hammonds AS, Ngo T-TB, Misra S, Murphy C, Scully A, Carlson JW, Wan KH, Laverty TR, et al. (2008). Tools for neuroanatomy and neurogenetics in Drosophila. Proceedings of the National Academy of Sciences 105, 9715. [DOI] [PMC free article] [PubMed] [Google Scholar]
- Prasad MS, and Paulson AF (2011). A combination of enhancer/silencer modules regulates spatially restricted expression of cadherin-7 in neural epithelium. Developmental Dynamics 240, 1756–1768. [DOI] [PMC free article] [PubMed] [Google Scholar]
- Quinlan Aaron R (2014). BEDTools: The Swiss-Army Tool for Genome Feature Analysis. Current Protocols in Bioinformatics 47, 11.12.11–11.12.34. [DOI] [PMC free article] [PubMed] [Google Scholar]
- Rao Suhas S.P., Huntley Miriam H., Durand Neva C., Stamenova Elena K., Bochkov Ivan D., Robinson James T., Sanborn Adrian L., Machol I, Omer Arina D., Lander Eric S., et al. (2014). A 3D Map of the Human Genome at Kilobase Resolution Reveals Principles of Chromatin Looping. Cell 159, 1665–1680. [DOI] [PMC free article] [PubMed] [Google Scholar]
- Rembold M, Ciglar L, Yáñez-Cuna JO, Zinzen RP, Girardot C, Jain A, Welte MA, Stark A, Leptin M, and Furlong EEM (2014). A conserved role for Snail as a potentiator of active transcription. Genes & development 28, 167–181. [DOI] [PMC free article] [PubMed] [Google Scholar]
- Roadmap Epigenomics Consortium, Kundaje A, Meuleman W, Ernst J, Bilenky M, Yen A, Heravi-Moussavi A, Kheradpour P, Zhang Z, Wang J, et al. (2015). Integrative analysis of 111 reference human epigenomes. Nature 518, 317. [DOI] [PMC free article] [PubMed] [Google Scholar]
- Rosenbloom KR, Armstrong J, Barber GP, Casper J, Clawson H, Diekhans M, Dreszer TR, Fujita PA, Guruvadoo L, Haeussler M, et al. (2015). The UCSC Genome Browser database: 2015 update. Nucleic Acids Res 43, D670–D681. [DOI] [PMC free article] [PubMed] [Google Scholar]
- Roy S, Ernst J, Kharchenko PV, Kheradpour P, Negre N, Eaton ML, Landolin JM, Bristow CA, Ma L, Lin MF, et al. (2010). Identification of Functional Elements and Regulatory Circuits by Drosophila modENCODE. Science 330, 1787–1797. [DOI] [PMC free article] [PubMed] [Google Scholar]
- Schaeffer HJ, Forsthoefel NR, and Cushman JC (1995). Identification of enhancer and silencer regions involved in salt-responsive expression of Crassulacean acid metabolism (CAM) genes in the facultative halophyte Mesembryanthemum crystallinum. Plant Molecular Biology 28, 205–218. [DOI] [PubMed] [Google Scholar]
- Schneider CA, Rasband WS, and Eliceiri KW (2012). NIH Image to ImageJ: 25 years of Image Analysis. Nature methods 9, 671–675. [DOI] [PMC free article] [PubMed] [Google Scholar]
- Shavit Y, and Lio P (2014). Combining a wavelet change point and the Bayes factor for analysing chromosomal interaction data. Molecular BioSystems 10, 1576–1585. [DOI] [PubMed] [Google Scholar]
- Shokri L, Inukai S, Hafner A, Weinand K, Hens K, Vedenko A, Gisselbrecht SS, Dainese R, Bischof J, Furger E, et al. (2019). A Comprehensive Drosophila melanogaster Transcription Factor Interactome. Cell Reports 27, 955–970.e957. [DOI] [PMC free article] [PubMed] [Google Scholar]
- Simpson J, Schell J, Montagu MV, and Herrera-Estrella L (1986). Light-inducible and tissue-specific pea lhcp gene expression involves an upstream element combining enhancer- and silencer-like properties. Nature 323, 551. [Google Scholar]
- Stathopoulos A, and Levine M (2005). Localized repressors delineate the neurogenic ectoderm in the early Drosophila embryo. Developmental biology 280, 482–493. [DOI] [PubMed] [Google Scholar]
- Thomas S, Li X-Y, Sabo PJ, Sandstrom R, Thurman RE, Canfield TK, Giste E, Fisher W, Hammonds A, Celniker SE, et al. (2011). Dynamic reprogramming of chromatin accessibility during Drosophila embryo development. Genome Biology 12, R43. [DOI] [PMC free article] [PubMed] [Google Scholar]
- Thurman RE, Rynes E, Humbert R, Vierstra J, Maurano MT, Haugen E, Sheffield NC, Stergachis AB, Wang H, Vernot B, et al. (2012). The accessible chromatin landscape of the human genome. Nature 489, 75. [DOI] [PMC free article] [PubMed] [Google Scholar]
- van Riel JJG (2014). Identification of epigenomic patterns to annotate regulatory elements in the human genome. In Department of Biomedical Sciences (Utrecht University), pp. 35. [Google Scholar]
- Visel A, Blow MJ, Li Z, Zhang T, Akiyama JA, Holt A, Plajzer-Frick I, Shoukry M, Wright C, Chen F, et al. (2009). ChIP-seq accurately predicts tissue-specific activity of enhancers. Nature 457, 854. [DOI] [PMC free article] [PubMed] [Google Scholar]
- Wang KC, and Chang HY (2018). Epigenomics. Circulation Research 122, 1191–1199. [DOI] [PMC free article] [PubMed] [Google Scholar]
- Warner J, Philippakis A, Jaeger S, He F, Lin J, and Bulyk M (2008). Systematic identification of mammalian regulatory motifs’ target genes and their functions. Nature Methods 5, 347–353. [DOI] [PMC free article] [PubMed] [Google Scholar]
- Weirauch Matthew T., Yang A, Albu M, Cote AG, Montenegro-Montero A, Drewe P, Najafabadi Hamed S., Lambert Samuel A., Mann I, Cook K, et al. (2014). Determination and Inference of Eukaryotic Transcription Factor Sequence Specificity. Cell 158, 1431–1443. [DOI] [PMC free article] [PubMed] [Google Scholar]
- Zhang Y, Liu T, Meyer CA, Eeckhoute J, Johnson DS, Bernstein BE, Nusbaum C, Myers RM, Brown M, Li W, et al. (2008). Model-based Analysis of ChIP-Seq (MACS). Genome Biology 9, R137. [DOI] [PMC free article] [PubMed] [Google Scholar]
- Zhou VW, Goren A, and Bernstein BE (2011). Charting histone modifications and the functional organization of mammalian genomes. Nature Reviews Genetics 12, 7. [DOI] [PubMed] [Google Scholar]
- Zhu LJ, Christensen RG, Kazemian M, Hull CJ, Enuameh MS, Basciotta MD, Brasefield JA, Zhu C, Asriyan Y, Lapointe DS, et al. (2011). FlyFactorSurvey: a database of Drosophila transcription factor binding specificities determined using the bacterial one-hybrid system. Nucleic Acids Res 39, D111–D117. [DOI] [PMC free article] [PubMed] [Google Scholar]
- Zhu Q, and Halfon MS (2009). Complex organizational structure of the genome revealed by genome-wide analysis of single and alternative promoters in Drosophila melanogaster. BMC Genomics 10, 9. [DOI] [PMC free article] [PubMed] [Google Scholar]
Associated Data
This section collects any data citations, data availability statements, or supplementary materials included in this article.
Supplementary Materials
Table S1. Library elements, related to Figure 1
Table S2. sFS results (with validation), related to Figure 2
Table S3. Repressor TF motifs, related to Figure 5
Table S4. Hi-C results, related to Figure 6
Data Availability Statement
Data
All data resulting from our sFS screen are available in Table S2. Processed Hi-C data for sFS library elements are in Table S4.
Raw image data are available on Mendeley: http://dx.doi.org/10.17632/cn5ycthbss.1
sFS and Hi-C sequencing reads are available with GEO Accession # GSE137958.
Scripts
All custom scripts used in this study are available upon request.