Abstract
Glia have been implicated in Alzheimer’s disease (AD) pathogenesis. Variants of the microglia receptor TREM2 increase AD risk and activation of “disease-associated microglia” (DAM) is dependent on TREM2 in mouse models of AD. We surveyed gene expression changes associated with AD pathology and TREM2 in 5XFAD mice and human AD by snRNA-seq. We confirmed the presence of Trem2-dependent DAM and identified a novel Serpina3n+C4b+ reactive oligodendrocyte population in mice. Interestingly, remarkably different glial phenotypes were evident in human AD. Microglia signature was reminiscent of IRF8-driven reactive microglia in peripheral nerve injury. Oligodendrocyte signatures suggested impaired axonal myelination and metabolic adaptation to neuronal degeneration. Astrocyte profiles indicated weakened metabolic coordination with neurons. Notably, the reactive phenotype of microglia was less palpable in TREM2 R47H and R62H carriers than in non-carriers, demonstrating a TREM2 requirement in both mouse and human AD, despite the marked species-specific differences.
Alzheimer’s disease (AD) is the most common form of dementia. Pathologically, amyloid beta (Aβ) peptides produced by neurons form extracellular aggregates that initiate disease; intraneuronal tau hyperphosphorylation and aggregation ensue, causing neuronal and synaptic dysfunction and cell death1. Reactive astrocytosis and microgliosis are secondary cellular responses to pathology that occur in diseased brain regions2 and may have both negative and positive effects3,4.
A slew of -omics studies in recent years has yielded complementary snapshots of glial responses to pathology in the AD brain5,6,7,8,9. These studies have largely concluded that microglia undergo the most prominent changes in diseased brains, due to a combination of increased microglia numbers along with a robust transcriptional activation signature on a per-microglia basis. Such activated microglia, which have been referred to as disease-associated microglia (DAM), has a transcriptional signature quite distinct from that of homeostatic microglia that markedly declines in mouse models of AD10,11,12.
Studies of genetic risk for sporadic AD have suggested that microglia not only respond to disease but modulate disease course13. Most notably, a hypomorphic variant in the microglial receptor TREM2, R47H, increases the risk of AD several fold, as do other TREM2 variants, such as R62H, although with reduced penetrance14. Mechanistically, loss of TREM2 function in AD mouse models restricts the ability of microglia to surround Aβ plaques15,16, proliferate, and convert to DAM10,15,17, which in turn leads to more profound neuritic dystrophy18,19. These findings suggest that changes in the AD brain are a combination of direct Aβ-mediated pathology and secondary responses by TREM2-dependent activated microglia.
Methods to study single nuclei have recently been developed, enabling transcriptomic analysis of essentially all brain cell types20,21. Single nuclei analysis of human AD brain specimens has revealed a microglial transcriptional response that partially recapitulates the mouse DAM signature along with perturbation of oligodendrocytes and myelination that is gender-dependent20. Nonetheless, little is known about how TREM2-dependent microglial functions impact the AD brain as a whole.
In this study, we comprehensively surveyed transcriptional changes associated with AD pathology and TREM2 deficit in brains from 5XFAD mice undergoing Aβ accumulation22 as well as brain specimens from AD patients with or without the R62H and R47H TREM2 variants by single-nucleus RNA sequencing (snRNA-seq). We found that transcriptional signatures of the human AD response identified in microglia, astrocytes and oligodendrocytes were remarkably different from those observed in mice. However, AD patients carrying the R47H and, to a minor extent, the R62H variant of TREM2 showed a defective microglial transcriptional activation, demonstrating that TREM2 impacts microglia function in both a mouse model of Aβ accumulation and human AD.
Results
snRNA-seq reveals a Trem2-dependent microgliosis at early stages of Aβ accumulation
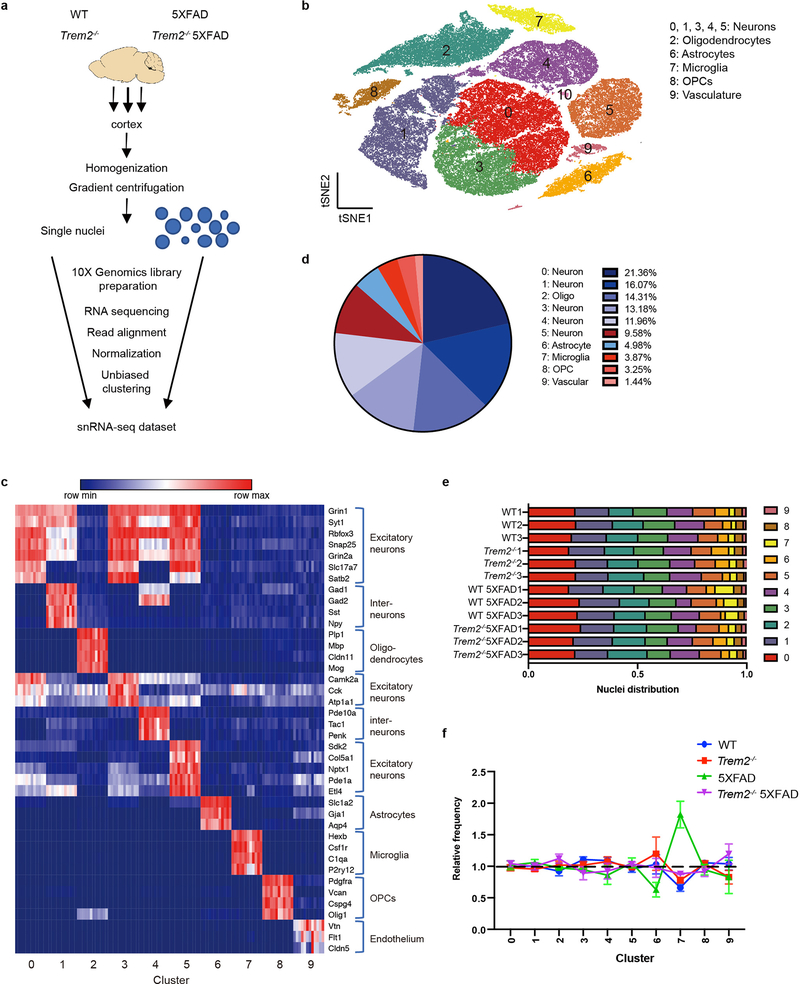
To investigate the impact of Aβ and microglial activation across cell types in mouse, we performed snRNA-seq on 7-month-old 5XFAD, Trem2-deficient 5XFAD (Trem2−/− 5XFAD), wild-type (WT), and Trem2−/− mice (3 mice/genotype) (Fig. 1a, Extended Data Fig. 1a). A total of 73,419 individual nuclei were arranged by t-distributed stochastic neighbor embedding (t-SNE) in two dimensions for visualization. Unsupervised clustering revealed a total of 11 distinct clusters across all samples (Fig. 1b). These clusters were manually identified based on expression of known cell-type specific markers (Fig. 1c, Extended Data Fig. 1b) as neurons (Clusters 0, 1, 3, 4, 5), oligodendrocytes (Cluster 2), astrocytes (Cluster 6), microglia (Cluster 7), oligodendrocyte precursor cells (OPCs, Cluster 8), and endothelial cells (Cluster 9) (Fig. 1d). Containing few nuclei, Cluster 10 could not be assigned and was omitted from further analyses. For all four genotypes, all clusters were similarly represented in each of the 3 mice analyzed and most nuclei had similar numbers of unique molecular identifiers (UMIs) (Fig. 1e and Extended Data Fig. 1c). Notably, the microglia cluster was much larger in the 5XFAD cortex than in the Trem2−/− 5XFAD and non-5XFAD cortices (Fig. 1e,f), further evidence that Aβ pathology induces an expansion of microglia that is partially TREM2-dependent.
Fig. 1. snRNA-seq distinguishes major brain cell types and shows microgliosis in the 5XFAD brains.
a, Diagram of snRNA-seq pipeline. b, t-SNE plot showing 11 distinguished clusters, 0–10, with cell type identities as determined by expression of specific markers (Extended Data Fig. 1b). Cluster 10 had very low frequency and did not have a clear marker profile and was thus omitted from analysis. n=3 biologically independent mouse brain samples per genotype; 73,419 total cells. c, Heat map showing expression of specific markers in every sample identifying each cluster in b. Each column represents one individual mouse. Within a cluster, mice from left to right: WT1-3, Trem2−/−1–3, WT 5XFAD1-3, Trem2−/− 5XFAD1-3. Clusters are identified with the same markers in every mouse. d, Pie chart showing the frequency of each cluster across all genotypes. Neuronal clusters are shown in blue hues and non-neuronal clusters are shown in red hues. e, Bar graph showing the frequency of each cluster in every sample. All clusters are similarly represented among the 3 mice analyzed for each genotype. f, Relative frequency of clusters in each genotype, normalized to overall frequency in d. Cluster 7 (microglia) was highly enriched in 5XFAD. n=3 biologically independent mouse brain samples per genotype. Data are presented as mean ± SEM.
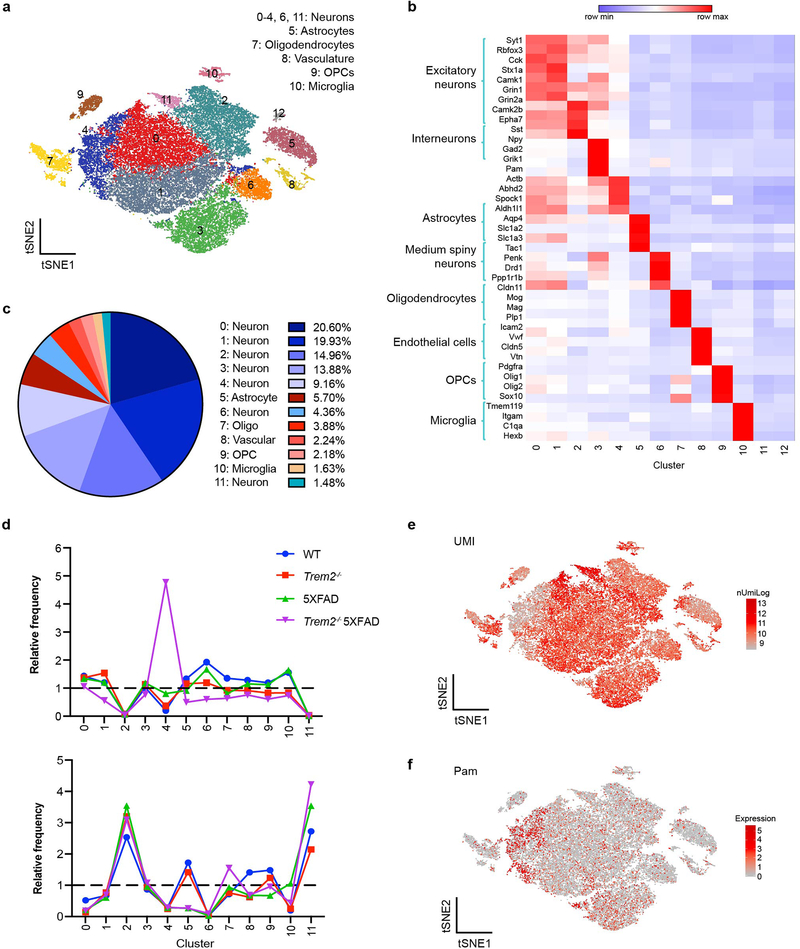
We also surveyed 15-month-old mice with an advanced stage of pathology by snRNA-seq of nuclei pooled from the cortices or the hippocampi of 3 mice per genotype (Extended Data Fig. 2a–c). Most clusters were similarly represented in all samples, with the exception of certain neuron clusters overrepresented in the cortex or in the hippocampus (Extended Data Fig. 2d). Interestingly, the difference between microglial clusters in 5XFAD and Trem2−/− 5XFAD cortices was minimal at this stage (Extended Data Fig. 2d); this suggests that, although delayed by Trem2-deficiency, microgliosis can reach a plateau at late stages of disease when aging becomes the major factor. Moreover, we noticed that the Trem2−/− 5XFAD cortex contained a neuronal cluster with significantly fewer UMIs but relatively high expression of peptidylglycine alpha-amidating monooxygenase (Pam) (Extended Data Fig. 2e,f), which may represent dystrophic neurons that accumulate over time as a result of ineffective microglial control of AD pathology due to lack of Trem218,19.
DAM signature is Trem2-dependent at early and late stages of Aβ accumulation
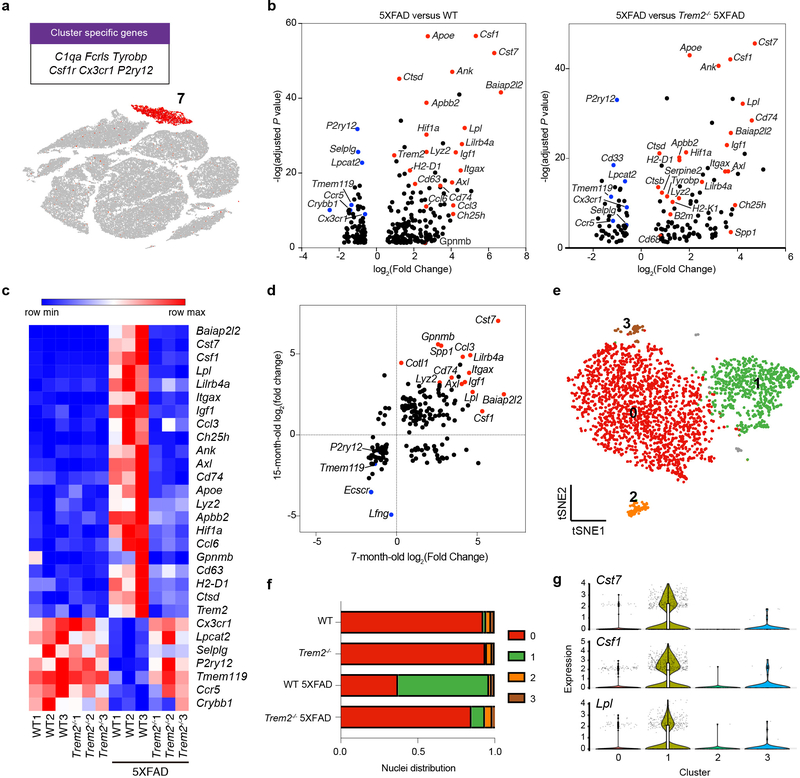
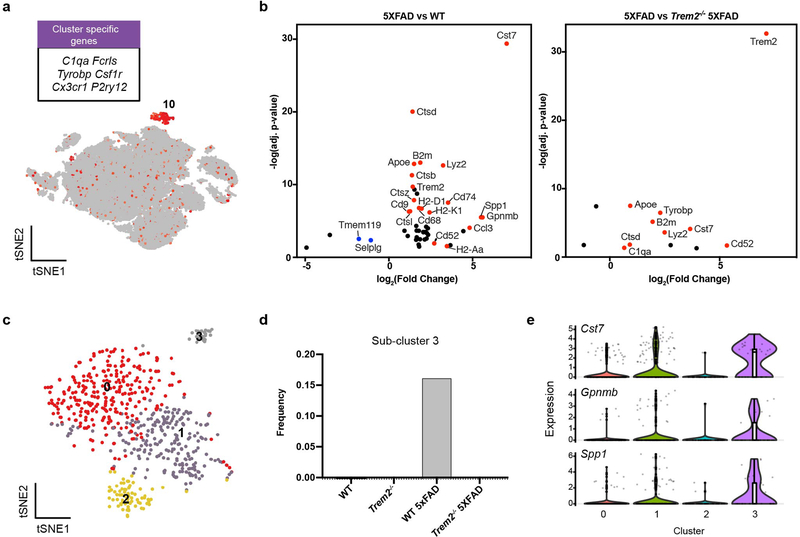
We next focused on differentially expressed genes (DEGs) on a per-cluster basis, specifically comparing 5XFAD vs. WT (Aβ effects) and 5XFAD vs. Trem2−/− 5XFAD (Trem2 dependence) in both 7-month-old (Fig. 2a–c) and 15-month-old datasets (Extended Data Fig. 3a,b). We first performed a detailed analysis of microglia-specific changes. DAM genes, including Cst7, Csf1, Apoe, Trem2, Lpl, Lilrb4a, MHC-I (H2-d1), MHC-II (Cd74), and various cathepsin genes were notably upregulated in 5XFAD compared to WT mice. Homeostatic genes, such as P2ry12, Selplg, Tmem119, and Cx3cr1 were downregulated. These results were highly concordant between the 7-month- and 15-month-old datasets (Fig. 2d) and with previously published single cell RNA-seq data of sorted microglia10,11,12. Furthermore, we found significantly higher expression of Cst7, Csf1, MHC-I (H2-K and b2m), among other genes, in 5XFAD than in Trem2−/− 5XFAD microglia, recapitulating the Trem2-dependent upregulation of these genes reported in the literature. Taking advantage of the single-cell resolution of our data, we re-clustered microglia of 7-month-old mice to distinguish 4 sub-clusters (Fig. 2e). Of these, sub-cluster 1 was highly represented in 5XFAD mice, less so in Trem2−/− 5XFAD mice and barely detectable in WT and Trem2−/− mice (Fig. 2f). This sub-cluster specifically expressed DAM genes (Fig. 2g), indicating that both Aβ and Trem2 are required for DAM. Similarly, re-clustering of microglia from 15-month-old mice revealed that one distinct sub-cluster was exclusively represented in 5XFAD mice and enriched in DAM genes (Extended Data Fig. 3c–e). These findings demonstrate that our analysis pipeline is robust enough to discern the major transcriptional features of Aβ- and TREM2-induced microglia activation.
Fig. 2. Characterization of the microglia cluster.
a, t-SNE plot showing the microglia cluster (cluster 7) from Fig. 1, expressing microglia genes, such as C1qa, Fcrls, and Tyrobp. n=3 biologically independent mouse brain samples per genotype; 73,419 total cells. b, Volcano plots showing significantly differentially expressed genes (DEGs) (Fold change>1.5, two-part hurdle model, adjusted p-value<0.05, Bonferroni correction) in microglia of 5XFAD vs. WT (effect of Aβ) and 5XFAD vs. Trem2−/− 5XFAD (dependence of Trem2). Microglia nuclei show a Trem2-dependent DAM signature. n=3 biologically independent mouse brain samples per genotype; 524 WT, 1,123 WT 5XFAD, and 604 Trem2−/− 5XFAD microglial cells. c, Heat map showing the average gene expression of top DEGs in the microglia cluster for each sample. DAM signature is present in all 5XFAD mice in a Trem2-dependent manner. Color scheme shows row max and row min, which represents relative expression of each gene among all samples. d, log2(Fold change) of top DEGs in 7-month-old mice and 15-month-old mice are plotted against each other. DAM signature is consistently present in both 7- and 15-month-old mice. e, t-SNE plot of re-clustered microglia (from cluster 7) identifying 4 sub-clusters. n=3 biologically independent mouse brain samples per genotype; 2,840 total microglial cells. f, Bar graph showing the frequency of each microglia sub-cluster in all genotypes. Sub-cluster 1 is only present in 5XFAD samples, mostly in the WT 5XFAD mice and to a lesser extent in the Trem2−/− 5XFAD. g, Violin plots showing the expression of DAM genes, Cst7, Lpl and Csf1, in microglia sub-clusters. DAM genes are enriched in sub-cluster 1. Violin plots are presented with floating boxes showing median (middle line) and quartiles (top and bottom). Minima and maxima are shown as the bottom and top of the violin plots. n=3 biologically independent mouse brain samples per genotype; 524 WT, 582 Trem2−/−, 1,123 WT 5XFAD, and 604 Trem2−/− 5XFAD microglial cells.
snRNA-seq reveals an Aβ-dependent oligodendrocyte reactive signature
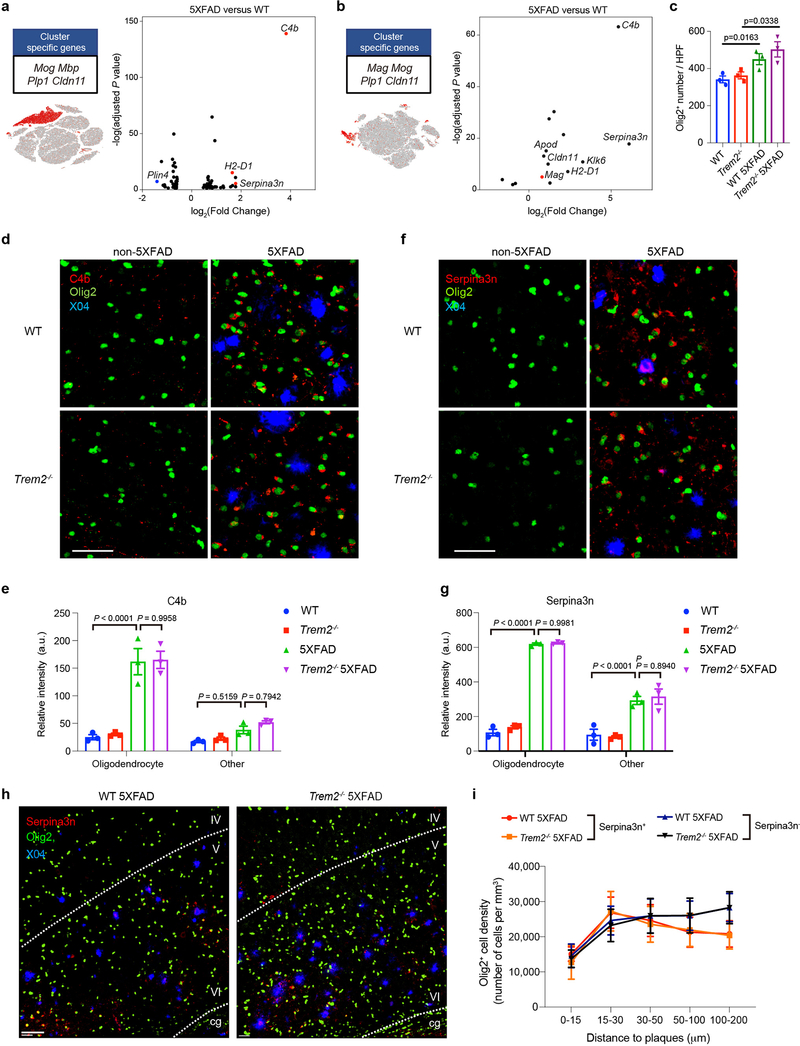
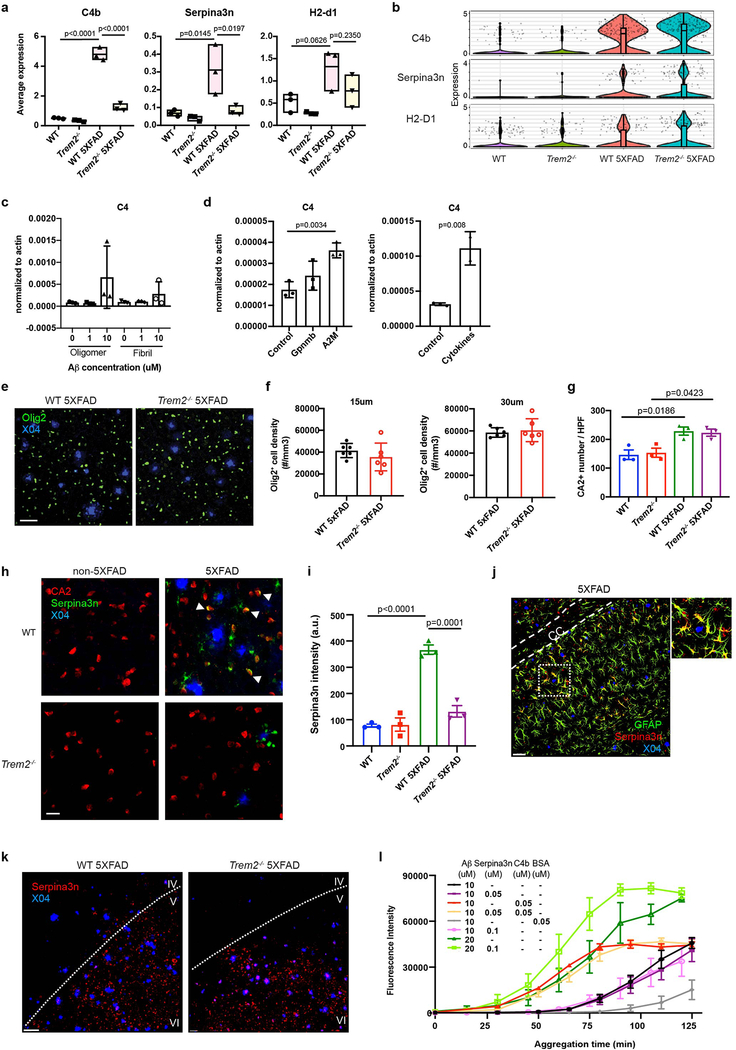
We next examined oligodendrocytes, OPCs, astrocytes, and neuronal subsets in 7- and 15-month-old mice. Oligodendrocytes harbored the most strikingly upregulated genes. Volcano plot of 5XFAD vs WT oligodendrocytes in 7-month-old mice revealed a significant upregulation of three genes in particular – the complement component C4b, the serine protease inhibitor Serpina3n, and MHC-I (H2-D1) – in 5XFAD brains (Fig. 3a), which was even more marked in mice at 15 months of age (Fig. 3b), suggesting a progressive oligodendrocyte response to Aβ-accumulation. Increased expression of C4b and Serpina3n was partially dependent on Trem2 in 7-month-old (Extended Data Fig. 4a) but not in 15-month-old mice (Extended Data Fig. 4b), suggesting that the reactive oligodendrocyte response to Aβ pathology may be influenced by microgliosis at early stages of disease. Corroborating this conclusion, an oligodendrocyte cell line upregulated C4 when exposed to Aβ, as well as alpha-2-macroglobulin and cytokines known to be released by microglia (Extended Data Fig. 4c,d).
Fig. 3. Identification of a novel oligodendrocyte Aβ-reactive state defined by C4b and Serpina3n expression.
a,b, Volcano plots showing DEGs (Fold change>1.5, two-part hurdle model, adjusted p-value<0.05, Bonferroni correction) of 5XFAD vs. WT in 7-month-old (a) and 15-month-old (b) mice in the oligodendrocyte cluster. Each panel is accompanied by a t-SNE plot, showing the oligodendrocyte cluster in the two cohorts of mice. C4b, Serpina3n, and H2-D1 were significantly upregulated in 5XFAD at both 7 and 15 months of age. n=3 biologically independent mouse brain samples per genotype; 2,672 WT and 2,180 WT 5XFAD oligodendrocytes (a). n=617 WT and 160 WT 5XFAD oligodendrocytes pooled from 3 mouse brains per genotype (b). c, Quantification of total number of Olig2+ nuclei in the 4 genotypes. n=3 biologically independent mice per genotype. P-value by one-way ANOVA with Tukey’s multiple comparisons test. d,f, Representative IF images of C4b (d) and Serpina3n (f) staining in 15-month-old cortices of all genotypes showing perinuclear localization of C4b and Serpina3n around Olig2+ nuclei in 5XFAD brains. n=3 biologically independent mice per genotype. Scale bar, 40 μm. e,g, Automated quantification of staining intensity was performed by averaging the voxel intensities of C4b (e) and Serpina3n (g) staining within 2 μm of (oligodendrocyte) or more than 5 μm away (other) from Olig2+ objects in d and f. n=3 biologically independent mice per genotype. P-value by two-way ANOVA with Tukey’s multiple comparisons test. h, Representative IF images of 5-month-old WT 5XFAD and Trem2−/− 5XFAD cortices showing Serpina3n+ oligodendrocytes are present solely in plaque-bearing regions. IV, V and VI indicate corresponding cortical layers. cg, cingulum. n=6 biologically independent mice per genotype. Scale bar, 60 μm. i, Quantification of the density of Serpina3n+ and Serpina3n− oligodendrocytes in shells away from plaques. Serpina3n+ but not Serpina3n− oligodendrocytes are mostly found in regions bearing plaques. n=6 biologically independent mice per genotype. All data are presented as mean ± SEM (c,e,g,i).
Next, we validated the oligodendrocyte Aβ-associated signature at the protein-level by immunofluorescence (IF). 5XFAD brains contained more Olig2+ nuclei indicative of oligodendrocyte lineage cells than did non-5XFAD brains (Fig. 3c). However, no enrichment of oligodendrocytes adjacent to plaques was observed (Extended Data Fig. 4e,f). Co-staining for either Serpina3n or C4b along with nuclear Olig2 showed perinuclear expression of Serpina3n and C4b in oligodendrocyte lineage cells of 5XFAD and Trem2−/− 5XFAD brains (Fig. 3d–g). These Aβ-reactive Serpina3n+Olig2+ cells were markedly enriched in plaque-bearing brain regions (Fig. 3h,i). The increase in oligodendrocytes that express Serpina3n in 5XFAD brains was confirmed by staining with CA2 as an alternative oligodendrocyte marker (Extended Data Fig. 4g–i). We also detected little colocalization of Serpina3n with astrocytes (Extended Data Fig. 4j) and Aβ plaques (Extended Data Fig. 4k).
What is the impact of C4b and Serpina3n secretion by oligodendrocytes? Given that formation of Aβ plaques is increased in mice transgenic for Serpina3n23,24, we asked whether Serpina3n and/or C4b can accelerate Aβ aggregation in vitro. We found that addition of C4b to Aβ42 peptides strongly accelerated aggregation of Aβ; Serpina3n alone modestly promoted aggregation at high Aβ42 concentrations and did not synergize with C4b (Extended Data Fig. 4l). Altogether, these results demonstrate that Aβ accumulation in mice is paralleled by an increase in the number and reactive state of oligodendrocytes that may be partially dependent on TREM2, at least at early stages of disease. Reactive oligodendrocytes secrete C4b and Serpina3n, which may facilitate Aβ aggregation.
Transcriptional changes in neuronal and other non-neuronal populations in response to Aβ are minimal
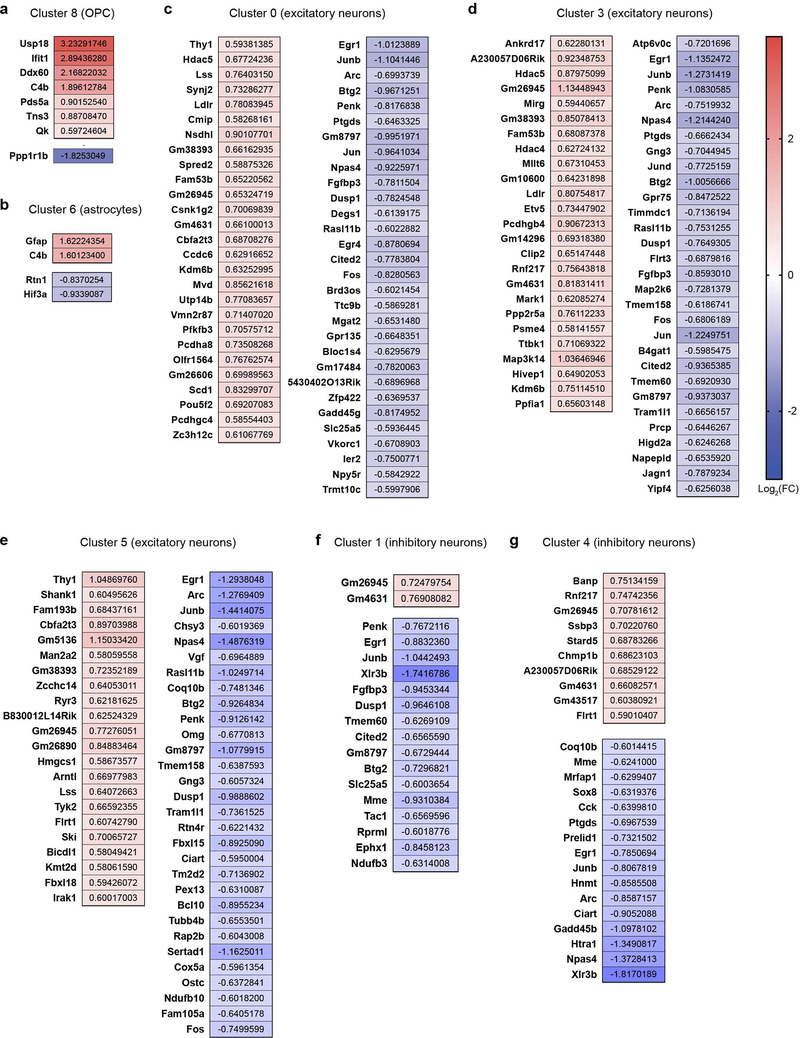
Cell types other than microglia and oligodendrocytes evinced more limited transcriptional responses to Aβ. OPCs strongly upregulated C4b, with a fold change and p-value similar to oligodendrocyte activation genes (Extended Data Fig. 5a). Astrocytes upregulated Gfap and C4b, but to a lesser extent than did oligodendrocytes (Extended Data Fig. 5b). Egr1, a transcriptional regulator that mediates cell survival and proliferation, was substantially downregulated in excitatory neuron clusters (Extended Data Fig. 5c–e). In addition to genes with known connections to AD, we identified scores of additional genes that are moderately upregulated in the 5XFAD model in various cell types (Extended Data Fig. 5a–g) independently of TREM2 (Supplementary Table 1). We conclude that the impact of Aβ beyond microglia and oligodendrocytes is limited.
Bulk proteomic analysis validates Trem2-dependent and -independent activation genes at the protein level
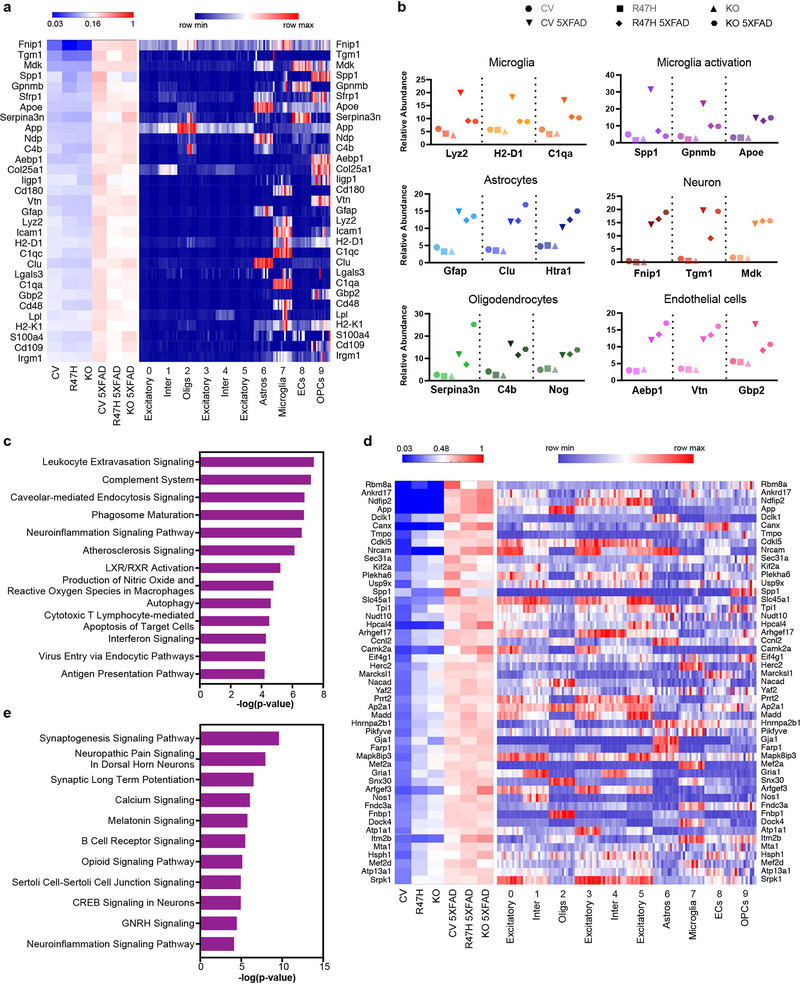
To validate Aβ and TREM2 effects on the murine brain using an independent modality, we employed quantitative mass spectrometry-based proteomics of whole brain tissue from 10-month-old 5XFAD mice that were Trem2-deficient or expressed either the common variant (CV) (CV-5XFAD) or the R47H hypomorphic variant (R47H-5XFAD) of human TREM2 instead of endogenous Trem217. Proteomic analysis yielded a list of proteins more abundant in CV-5XFAD than in CV brains that were largely concordant with genes identified by snRNA-seq, but with a significant number of additions (Extended Data Fig. 6a). For example, proteins such as the neurotrophic factor Midkine25, were found to be highly upregulated, despite being unchanged in our snRNA-seq analysis. To ascertain the cell type of origin for upregulated proteins identified by proteomic analysis, we linked them to our per-cluster average expression data from snRNA-seq (Extended Data Fig. 6a). The majority of upregulated proteins were most highly expressed in microglia. However, genes expressed by oligodendrocytes, astrocytes, and endothelial cells were also substantially represented at the protein level (Extended Data Fig. 6b). Of special note, Serpina3n and C4b were among the top 20 most upregulated proteins, validating these as important activation markers. Ingenuity Pathway Analysis (IPA) of the most highly upregulated proteins identified immune pathways overwhelmingly as the most significant in this regard (Extended Data Fig. 6c). The majority of microglia-expressed proteins were less abundant in Trem2−/− 5XFAD and R47H-5XFAD brains than in CV-5XFAD brains.
In addition to total proteins, we also analyzed phosphorylation from the same samples. Interestingly, phosphopeptides that increased most dramatically from CV to CV-5XFAD generally did not originate from proteins with the greatest total-level changes, with the exception of Spp1, which was in the top 20 phosphopeptides. As done for proteomics analysis, we matched cluster-by-cluster expression in snRNA-seq for the genes corresponding to each phosphopeptide (Extended Data Fig. 6d). Upregulated phosphopeptides were more typically expressed in neuronal than in glial populations. IPA pathway analysis of the most upregulated phosphopeptides identified synaptic signaling pathways as the most significantly upregulated in CV-5XFAD mice compared to CV mice (Extended Data Fig. 6e). We speculate that protein phosphorylation is a response to AD pathology that occurs more prominently in neurons than in glial cells.
Human brain AD gene signatures are distinct from those of the 5XFAD model
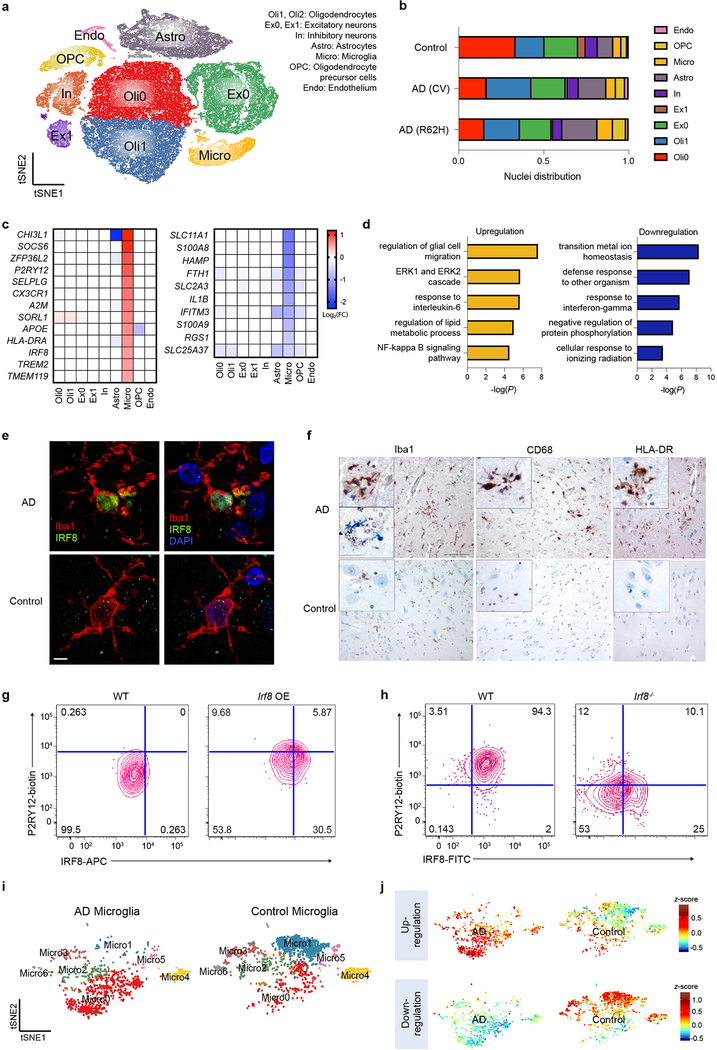
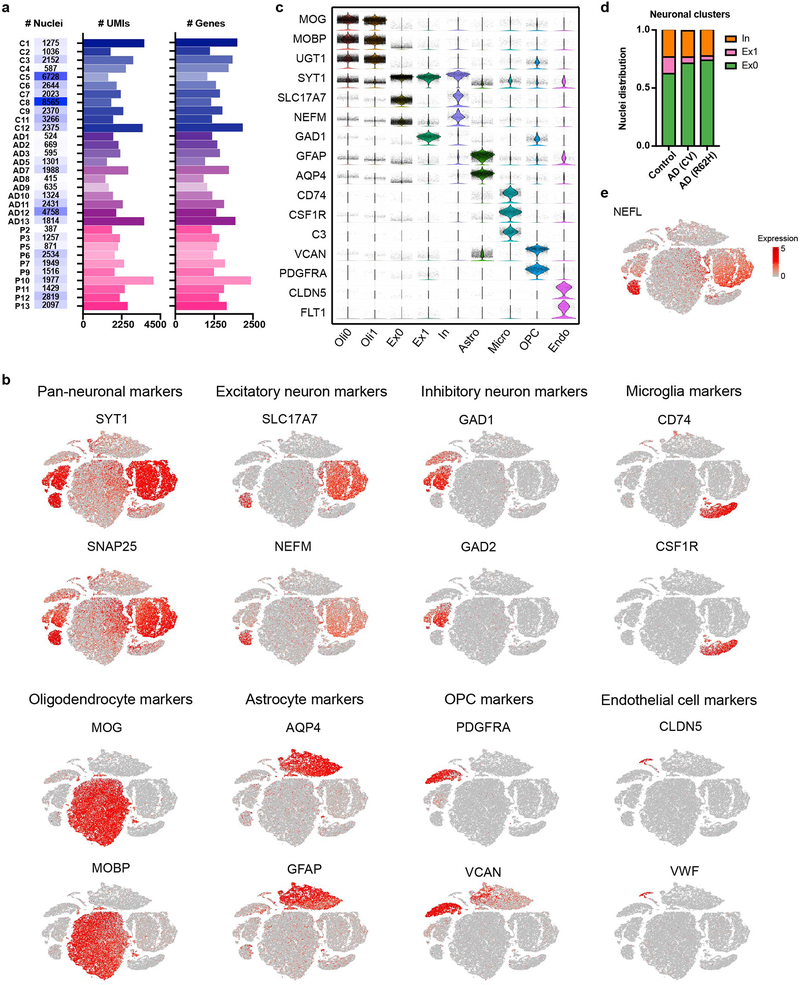
We sought to verify key findings observed in the mouse model in human AD. We performed snRNA-seq of post-mortem samples of dorsolateral pre-frontal cortexes from 11 AD patients with the common variant (CV) of TREM2, 10 AD patients bearing the TREM2 R62H variant, and 11 controls, all obtained from the Rush AD center (Supplementary Table 2). We analyzed a total of 66,311 individual nuclei with a median of 1,312 genes per nucleus, which were visualized in two dimensions by t-SNE (Fig. 4a). Most samples had a median of over 2,000 UMIs per nucleus (Extended Data Fig. 7a). Unsupervised clustering revealed a total of 10 distinct clusters across all samples, which were manually assigned based on expression of known cell-type specific markers (Extended Data Fig. 7b,c). The smallest cluster could not be assigned and was omitted from further analyses. We identified oligodendrocyte (Oli0 and Oli1), excitatory neuron (Ex0 and Ex1), inhibitory neuron (In), astrocyte (Astro), microglia (Micro), OPCs and endothelial cell (Endo) clusters (Fig. 4a). Most clusters were represented similarly in AD and control samples (Fig. 4b). However, the neuronal clusters, especially that enriched for neurofilament genes NEFL and NEFM (Ex1), were underrepresented in AD compared to control samples (Fig. 4b, Extended Data Fig. 7d,e), likely reflecting neuronal loss associated with AD and consistent with NEFL being identified as an AD biomarker in the cerebrospinal fluid (CSF)26 (Supplementary Table 3). On the other hand, the proportion of astrocytes was increased in AD compared to control samples, indicating reactive astrocytosis (Fig. 4b). Nuclei distribution of TREM2 R62H AD samples was more similar to TREM2 CV AD than to controls.
Fig. 4. Human AD brain exhibits a distinct microglia signature from mouse.
a, t-SNE plot showing 10 clusters from 11 AD patients with TREM2 CV, 10 AD patients with TREM2 R62H and 11 non-AD controls. n=66,311 total cells. b, Bar-graph presenting frequency of each cluster in every group. c, Heat maps showing fold change of top DEGs (log2(FC)>0.5, two-part hurdle model, adjusted p-value<0.05, Bonferroni correction) in microglia, comparing AD (CV) versus control. Left, genes up-regulated in AD. Right, genes down-regulated in AD. n=11 AD (CV) patients, 919 cells; 11 controls, 1,547 cells. d, Gene Ontology terms associated with genes up-regulated (left) and down-regulated (right) in AD. n=45 up-regulated, 47 down-regulated genes, hypergeometric test. e, Representative IF images of AD and control cortical samples showing nuclear IRF8 staining within Iba1+ microglia in AD. Scale bar, 5 μm. The experiment was performed twice. f, Representative IHC from AD cortical autoptic samples and age-matched controls showing microglia upregulate Iba1, CD68 and HLA-DR in AD. Insets show higher magnification of the corresponding panels. Lower inset in Iba1 AD panel shows double staining of Iba1+ microglia in blue surrounding silver+ plaques. Scale bars: 100 μm (panels); 30 μm (insets). The experiment was performed six times. g,h, P2RY12 level in mouse microglia-like cultures is increased upon Irf8 overexpression (OE) (g) and decreased in Irf8−/− cultures (h), compared to WT cultures. Data represent two (g) or three (h) independent experiments. Numbers indicate cell frequency in each quadrant. i, t-SNE plots of re-clustered microglia showing 7 sub-clusters. Micro0 is increased in AD; Micro1 is reduced. n=919 AD and 1,547 control microglial cells. j, t-SNE plots showing average z-scores of DEGs in microglia. Top, up-regulated genes are enriched in Micro0. Bottom, down-regulated genes are enriched in Micro1. n=46 up- and 47 down-regulated genes in microglia listed in Supplementary Table 4 were used as inputs.
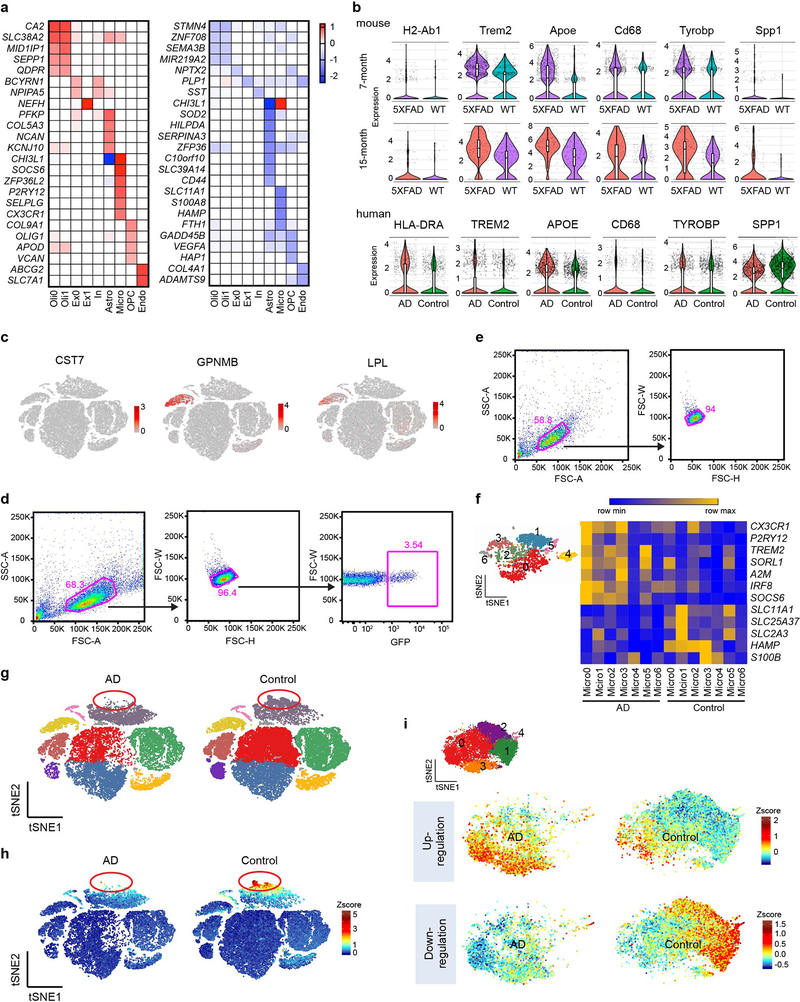
We next identified DEGs of each cluster in AD with TREM2 CV compared with controls (Supplementary Table 4). Top DEGs for each cluster were plotted into a heatmap (Extended Data Fig. 8a). Consistent with neuronal loss in AD, we observed downregulation of many neuronal genes, albeit with a fold change less than 1.5 (Supplementary Table 4). Non-neuronal populations, including microglia, astrocytes and oligodendrocytes, evinced more substantial changes. In the microglia cluster, genes normally considered as ‘homeostatic” in mouse (TMEM119, P2RY12, CX3CR1) were, in fact, notably upregulated in AD compared to controls (Fig. 4c), along with higher expression of the transcription factor IRF8. This signature was remarkably similar to the IRF8-driven reactive phenotype that mouse microglia adopt in peripheral nerve injury (PNI)27. Other genes previously reported to be up-regulated in human AD but not as part of the DAM signature, including SORL1, A2M, and CHI3L1, were also highly upregulated (Fig. 4c). Noteworthy, SORL1 polymorphisms have been linked to susceptibility to AD28 and CHI3L1 is a prognostic fluid biomarker for preclinical AD26 (Supplementary Table 3). MHCII, TREM2, CD68, and APOE were among the few DAM gene homologues upregulated in human AD samples compared to controls (Extended Data Fig. 8b). Other DAM gene homologues were either similarly expressed in AD and control samples (TYROBP), not detected (CST7, GPNMB, LPL), or even downregulated (SPP1) in human AD microglia (Extended Data Fig. 8b,c). Finally, AD microglia expressed fewer transcripts of genes involved in iron and divalent metal ion transport (SLC25A37) and storage (HAMP, FTH1) (Fig. 4c). Accordingly, gene ontology (GO) analysis identified metal ion homeostasis as the top pathway downregulated in microglia (Fig. 4d). Interestingly, altered iron homeostasis has been associated with senescence29.
IF and immunohistochemistry (IHC) analyses corroborated increased expression of IRF8 in AD versus control samples, together with other markers indicative of microglial responses to Aβ, such as Iba1, CD68, and HLA-DR (Fig. 4e,f). To further substantiate the contribution of IRF8 in driving the AD-related upregulation of “homeostatic” markers, we showed that overexpression of Irf8 in mouse microglia-like cell cultures upregulated the expression of P2RY12, which was conversely reduced in Irf8−/− cells (Fig. 4g,h, Extended Data Fig. 8d,e).
To determine whether a distinct AD-associated microglia subpopulation similar to mouse DAM exists in human AD brain, we re-clustered all microglia nuclei into 7 sub-clusters (Micro0-6) (Fig. 4i). Of these, sub-cluster Micro0 was highly enriched for expression of AD reactive genes (Fig. 4j, Extended Data Fig. 8f). Similar to the DAM signature, which becomes detectable in WT mice during aging, this human AD-associated signature was present in aged controls, and highly upregulated during disease. Altogether, these data suggest that the signature of human microglia in AD is quite distinct from that of DAM in the 5XFAD model10,11: it is reminiscent of the reactive phenotype observed in PNI and may be in part instructed by IRF8.
The astrocyte signature indicates increase in glial scaring and loss of metabolic coordination between neurons and astrocytes
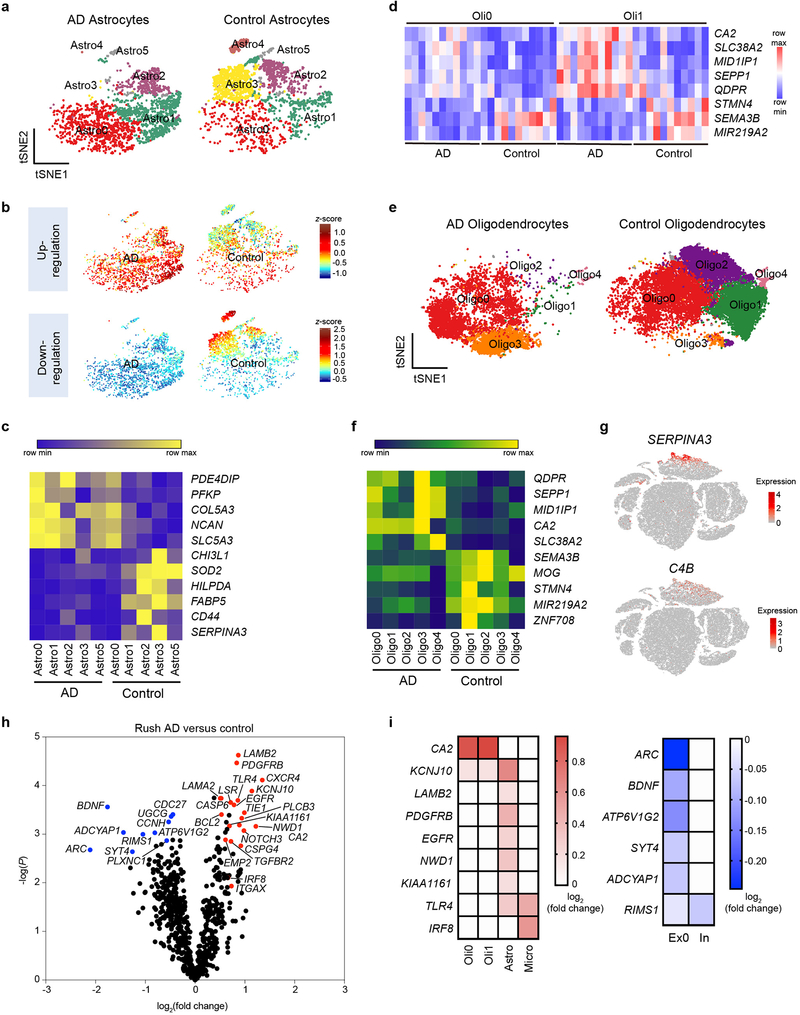
We noticed that a subpopulation of astrocytes evident in controls was not present in AD (Extended Data Fig. 8g,h). By re-clustering all of the astrocyte nuclei, we demarcated 6 sub-clusters (Astro0-5) of astrocytes and confirmed the contraction of Astro3 in AD samples (Fig. 5a). This sub-cluster was highly enriched for genes down-regulated in AD astrocytes (Fig. 5b), which include those controlling free-fatty acid (FA) transport (FABP5), storage in lipid droplets (HILPDA), as well as oxidation and detoxification of the resulting reactive oxygen species (SOD2) (Fig. 5c). Collectively, these genes have been implicated in the coordination of lipid and oxidative metabolism between neurons and astrocytes30. AD astrocytes also had elevated expression of genes encoding the proteoglycan NCAN and collagen COL5A3, which were enriched in Astro0 and Astro1 (Fig. 5b,c). These extracellular matrix molecules may contribute to glial scarring, probably preventing axonal regeneration31. Notably, NCAN polymorphisms have been associated with bipolar disorder, schizophrenia and major depression32. Overall, the AD astrocyte profile was quite different from that of A1 astrocytes induced by inflammatory mediators released by microglia33, reiterating a lack of bona fide inflammation in the AD brain.
Fig. 5. snRNA-seq identifies human AD-associated astrocyte and oligodendrocyte signatures corroborated by NanoString gene expression analysis.
a, t-SNE plots of re-clustered astrocytes showing 6 sub-clusters in AD and controls. Astro3 is depleted in AD. Astro4 is present in only one sample and is omitted for downstream analysis. n=2,641 AD and 2,955 control astrocytes. b, t-SNE plots showing average z-scores of DEGs in astrocytes. Top, up-regulated genes are enriched in Astro0 and Astro1. Bottom, down-regulated genes are enriched in Astro3. n=13 up- and 65 down-regulated astrocyte genes listed in Supplementary Table 4 were used as inputs. c, Heatmap representing average gene expression of top DEGs in astrocyte sub-clusters in AD versus controls. Color scheme shows row max and row min. d, Heatmap showing average gene expression of top DEGs in oligodendrocyte clusters (Oli0 and Oli1) in each sample. Color scheme shows row max and row min. e, t-SNE plots of re-clustered oligodendrocytes showing 5 sub-clusters in AD and controls. Oligo3 is enriched, whereas Oligo1 and Oligo2 are significantly reduced in AD. n=6,980 AD and 16,499 control oligodendrocytes. f, Heatmap representing the average gene expression of top oligodendrocyte DEGs in oligodendrocyte sub-clusters in AD versus control. Color scheme shows row max and row min. g, t-SNE plots showing expression of SERPINA3 and C4B in human astrocytes. n=66,311 total cells. h, Volcano plot showing DEGs of AD versus control from Rush samples analyzed by NanoString. n=13 AD patients and 12 controls. P-value by multivariate linear regression with Bejamani-Yekutieli adjustment. i, Heatmaps depicting fold changes in each cluster in snRNA-seq of selected DEGs from NanoString. Direction of change of these genes is consistent between snRNA-seq and NanoString. Numbers represent log2(FC). Red, up-regulation. Blue, down-regulation.
AD-reactive oligodendrocytes reflect functional and metabolic adaptation to axonal degeneration
A heatmap of oligodendrocyte-specific gene expression in AD versus controls revealed significant downregulation of genes that promote myelination through modification of the actin cytoskeleton, such as Stathmin 4 (STMN4)34, axonal guidance, like Semaphorin3B (SEMA3B)35, and differentiation of precursor cells into mature myelin-forming cells (MIR219A2)36 (Fig. 5d), suggesting that the expression of these genes may no longer be elicited due to axonal degeneration. On the other hand, oligodendrocytes upregulated the expression of genes controlling pH and electrolytes (CA2), osmotic imbalance (SLC38A2), lipid accumulation (MID1IP1) and oxidative stress (SEPP1) (Fig. 5d). Expression of these genes may facilitate metabolic responses to the accumulation of degradation products derived from axonal degeneration. Changes in gene expression were detected in distinct subpopulations of oligodendrocytes identifiable after re-clustering (Fig. 5e,f, Extended Data Fig. 8i). Upregulated genes, such as CA2, marked sub-cluster Oligo3, while downregulated genes such as MIR219A2, delineated clusters Oligo1 and Oligo2. The human homologues of mouse Serpina3n and C4b, SERPINA3 and C4B, which were upregulated in reactive oligodendrocytes in the 5XFAD model, were predominantly expressed in astrocytes rather than oligodendrocytes in the human brain (Fig. 5g), further evidence for a human-mouse difference in the cell type of origin; moreover, SERPINA3 expression was reduced rather than increased in the AD brains (Fig. 5c).
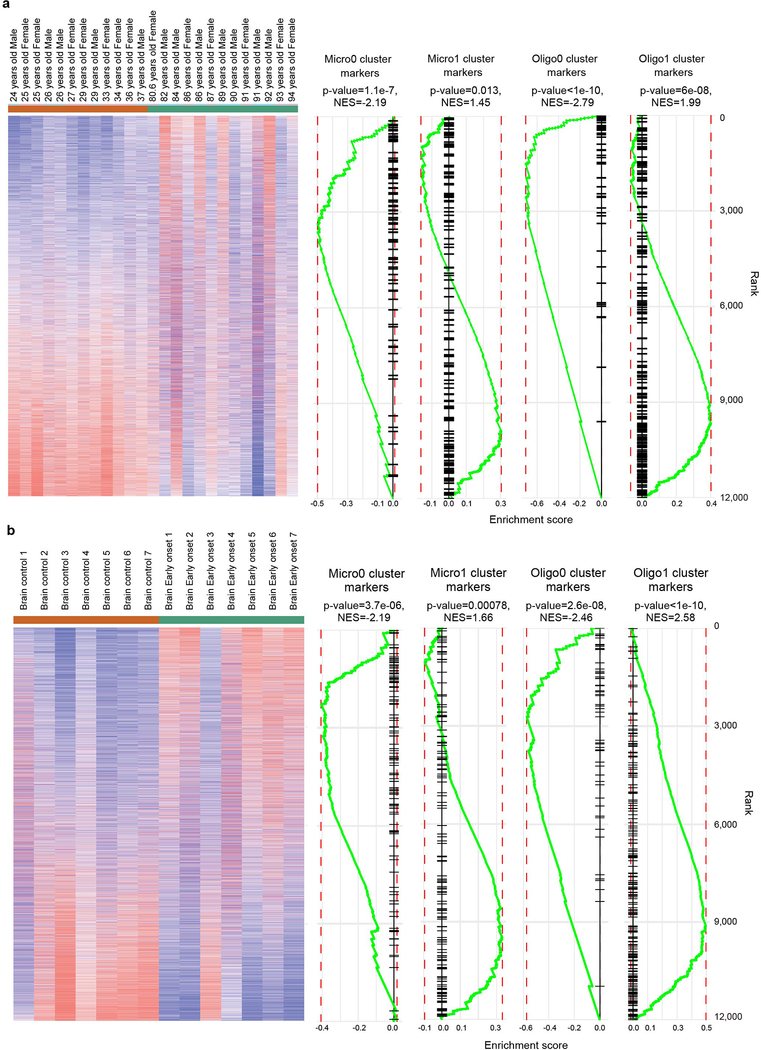
Taken together, we characterized an AD-associated signature in microglia, astrocytes and oligodendrocytes that is quite distinct from the AD signature identified in mouse Aβ models. Interestingly, genes enriched in Oligo1 and Micro1 (down-regulated in AD) corresponded to genes previously identified as downregulated during human aging and early onset AD patients from public datasets (Extended Data Fig. 9). Consistently, genes enriched in Micro0 and Oligo0 (upregulated in AD) correlated with upregulation during aging and early onset AD, further supporting our findings.
Whole brain nCounter mRNA analysis corroborates AD glial signatures and verifies neuronal loss
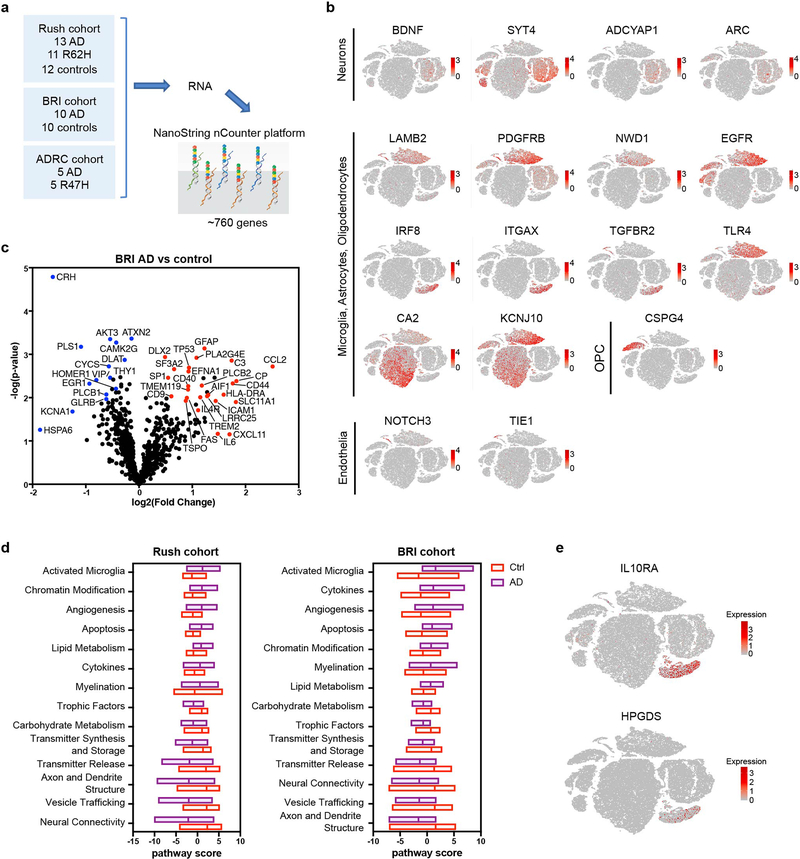
We next analyzed the same Rush cohort samples using a NanoString neuropathology gene expression panel that does not require gene amplification (Extended Data Fig. 10a, Supplementary Table 2,5). As this analysis was performed on bulk brain specimens, we verified the cell type of origin of each DEG by mapping them onto our human brain nuclei t-SNE plot (Extended Data Fig. 10b). NanoString data confirmed increased expression of microglia IRF8, and oligodendrocyte CA2 in AD compared to controls (Fig. 5h,i), as well as increased astrocyte expression of EGFR, which has been proposed as a potential receptor for Aβ37, and a regulator of astrocytes in multiple sclerosis38.
Moreover, these data exposed diminished expression of genes encoding for neurotrophic factors (BDNF), neurotransmitters (ADCYAP1), molecules involved in axon guidance (PLXNC1), plasticity (ARC)39, synaptic vesicles (V-ATPase G subunits (ATP6V1G2) and ion channels (RIMS1) (Fig. 5h,i), indicating neuronal cell death. Notably, reduced ADCYAP1 in human CSF and brain specimens has been associated with cognitive decline in mild cognitive impairment due to AD40 (Supplementary Table 3).
NanoString analysis on a different set of samples from the occipital cortex of AD patients and age-matched controls derived from the Niigata Brain Research Institute (BRI) (Extended Data Fig. 10c, Supplementary Table 2,5) confirmed increased expression of microglia “homeostatic” (TMEM119) and non-homeostatic genes (MHCII, TREM2, AIF1) in AD samples, as well as genes implicated in inhibiting myelination, such as EFNA141 (Extended Data Fig. 10c). Moreover, reduced expression of genes encoding neurotransmitters (VIP), stress hormones (CRH), as well as molecules involved in plasticity (CAMK2G), actin-bundling (PLS1), and metabolism (CYCS) of neurons was seen in AD samples compared to controls (Extended Data Fig. 10c), validating the neuronal depletion observed in the Rush cohort. Pathway analysis documented an increase in activated microglia and neuronal functional pathways in both the BRI and Rush cohorts (Extended Data Fig. 10d). It is noteworthy that gene signatures indicative of glial responses and neuronal depletion detected by NanoString in the Rush and the BRI cohorts differed somewhat between the two sets of specimens, likely reflecting differences in the transcriptional and functional profiles of glia and neurons in prefrontal and occipital cortices, respectively.
Brain signatures of AD carrying TREM2 variants demonstrate reduced microglial response
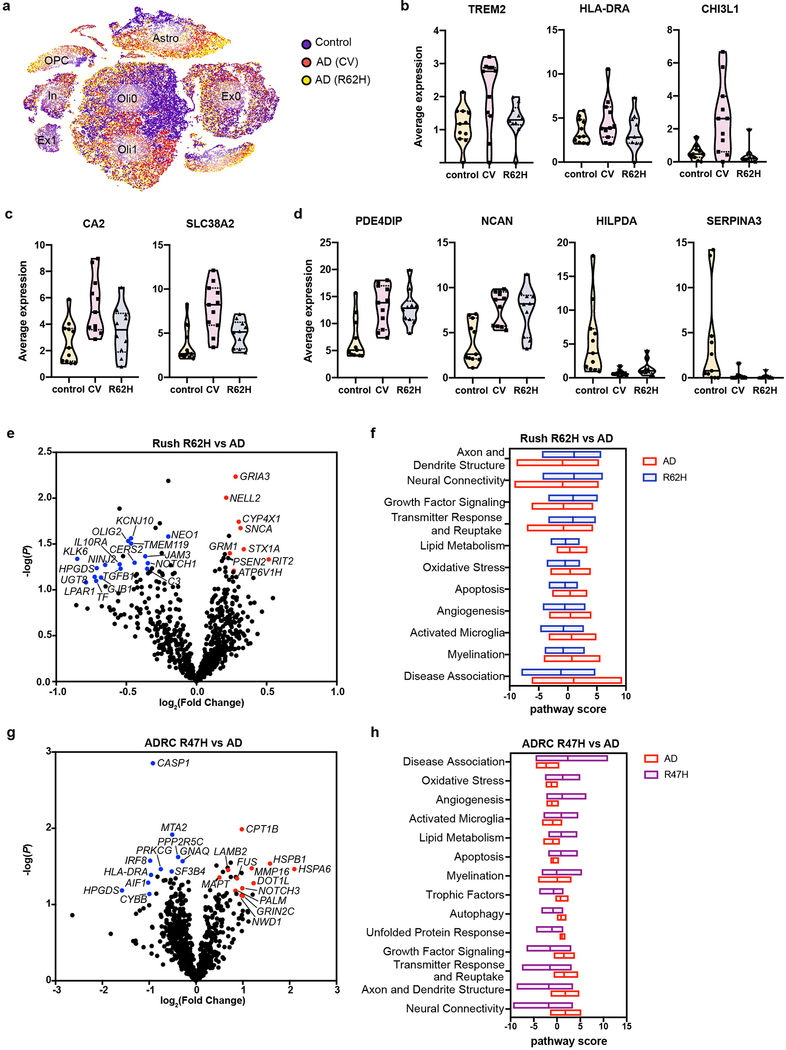
Finally, we examined the impact of rare human TREM2 variants on AD signatures. We first analyzed 10 pre-frontal cortex samples from Rush cohort derived from AD patients carrying the R62H TREM2 variant, which is associated with a 1-2-fold increase in the risk of developing AD. Overall, AD patients carrying R62H and those carrying CV TREM2 had very similar transcriptional profiles, as seen by t-SNE plot (Fig. 6a). AD R62H carriers clustered more closely with AD CV carriers than with controls, especially within the non-neuronal clusters (Fig. 6a). All AD patients, R62H carriers and CV carriers, had similar numbers of microglia. However, some microglial AD-reactive genes were downregulated in AD R62H carriers (TREM2, HLA-DRA and CHI3L1) (Fig. 6b). Expression of AD-reactive oligodendrocyte genes was lower in AD R62H carriers than in AD CV carriers, yet was significantly higher in AD R62H carriers than in controls (Fig. 6c). Conversely, not much difference was seen in astrocytes when comparing R62H to CV samples (Fig. 6d). Validating the snRNA-seq data, NanoString analysis corroborated a mild reduction in expression of microglial genes such as TMEM119, IL10RA and HPGDS in the R62H samples compared to CV AD samples (Fig. 6e,f, Extended Data Fig. 10e).
Fig. 6. TREM2 R62H and R47H carriers exhibit reduced microglia reactive signature.
a, t-SNE plot showing the distribution of nuclei from 11 AD (CV), 10 AD (R62H) and 11 control samples. AD (CV) and AD (R62H) cluster more closely, compared to control, in the non-neuronal clusters. n=32,625 control, 16,279 AD (CV) and 16,594 AD (R62H) cells. b,c,d, Violin plots showing average gene expression across microglia (b), oligodendrocyte (c), and astrocyte (d) nuclei isolated from each individual. Expression of microglial genes is significantly reduced in AD (R62H) compared to AD (CV); oligodendrocyte genes show intermediate expression in AD (R62H) compared to AD (CV) and control; astrocyte genes show similar expression in AD (CV) and AD (R62H). Violin plots are centered around the median (black line) with quartiles (dashed lines). Minima and maxima are shown as the bottom and top of the plots. Each dot represents one individual. n=11 controls, 11 AD (CV) patients, and 10 AD (R62H) patients. e, Volcano plot showing DEGs of AD brains of TREM2 CV and R62H carriers from Rush cohorts. n=13 AD (CV) patients and 11 AD (R62H) patients. P-value by multivariate linear regression with Bejamani-Yekutieli adjustment. f, Pathway analysis shows defective microglia activation in R62H carriers. g, Volcano plot showing DEGs of AD brains of TREM2 CV and R47H carriers from ADRC cohorts. R47H carriers have reduced expression of microglial genes. n=5 AD (CV) patients and 5 AD (R47H) patients. h, Pathway analysis shows defective neuronal functions in R47H carriers. P-value by multivariate linear regression with Bejamani-Yekutieli adjustment.
We next examined AD patients carrying the R47H variant, who have a higher risk (2-4-fold) of developing AD than do R62H carriers. Since the Rush cohort included only two of these cases, we chose a different set of human AD brain samples from the Alzheimer’s Disease Research Center at Washington University (ADRC), which included parietal cortical tissues from 5 AD patients carrying the R47H variant together with 5 matched specimens from AD patients without TREM2 variants (Supplementary Table 2,5). NanoString nCounter mRNA analyses documented a marked decrease in the expression of several microglia genes, including IRF8, HLA-DRA, and AIF1, in the R47H samples (Fig. 6g), suggesting fewer microglia in the R47H than in the CV TREM2 brain specimens and/or reduced expression of these microglial genes on a per cell basis. According to pathway analysis, R47H brains also had elevated expression of genes involved in oxidative stress and lipid metabolism, along with decreased expression of genes involved in autophagy, growth factor signaling, and neural connectivity (Fig. 6h). Overall, the R47H variant seems to have a greater impact than the R62H variant on microglial response to AD pathology, consistent with the relatively higher penetrance of the R47H variant for AD.
Discussion
Our multi-pronged analyses of AD pathology in both mouse and human brains demonstrates a remarkable discordance between the transcriptional signatures indicative of cellular responses in human AD and those seen in the 5XFAD mouse model of Aβ accumulation. In mice accumulating Aβ, microglia swap their “homeostatic” signature with a DAM signature that is partially Trem2-dependent10,11. During human AD, microglia acquire a quite distinct signature characterized by increased expression of “homeostatic” genes (TMEM119, CX3CR1, P2RY12) along with genes absent in the DAM signature, such as A2M, CHI3L1 and IRF8. This signature evokes the reactive microglia phenotype described in a mouse model of PNI that is driven, at least in part, by IRF827 and MafB42. We validated IRF8 expression in human AD microglia by NanoString and IF and showed that IRF8 drives the expression of microglial markers linked to AD, suggesting that IRF8 is likely a major driver of this signature.
Astrocyte signatures also markedly differed between the mouse model and human AD. In the 5XFAD model, astrocytes assumed a very modest Aβ-dependent signature marked by expression of Gfap. In human AD, we noted clear contraction of a subset expressing a metabolic signature indicative of lipid uptake, storage, oxidation and detoxification, likely reflecting loss of metabolic coordination between neurons and astrocytes. Neuronal loss in AD may dampen the need for astrocytic scavenger functions devoted to disposal of neuronal toxic waste. In parallel, astrocytes upregulated a signature indicative of extracellular matrix protein synthesis related to glial scarring.
In human AD, oligodendrocytes expressed fewer transcripts of genes controlling axonal myelination through axon guidance (SEMA3B), rearrangement of actin cytoskeleton (STMN4) and maturation of myelin-forming cells (MIR219A2). These functions may no longer be elicited due to neuronal loss and axonal degeneration. In parallel, oligodendrocytes elevated expression of genes sensitive to changes in pH and electrolytes (CA2), osmotic imbalance (SLC38A2), lipid accumulation (MID1IP1), and oxidative stress (SEPP1), which may be indicate a response to accumulation of degradation products derived from axonal degeneration. These oligodendrocyte signatures are distinct from those recently associated with multiple sclerosis21 and senescence43. In the 5XFAD model, oligodendrocytes adopted a reactive signature including C4b and Serpina3n that was not evident in human AD samples, although both transcripts were detected in human astrocytes. Moreover, C4b was particularly effective in inducing Aβ aggregation in vitro. Together these data expand previous studies in mouse models of Aβ aggregation suggesting a pathogenic role for C4b and Serpina3n23,24,44,45, as well as genetic studies linking the human homologue SERPINA3 to AD risk46, yet functions of Serpina3n remain unclear.
In neuronal populations, human AD samples showed diminished expression of genes controlling neurotransmission (ADCYAP1), plasticity (ARC), synaptic vesicles (ATP6V1G2), ion channels (RIMS1), and axon guidance (PLXNC1). Defects in some of these molecules have been implicated in impaired memory39 and associated with mild cognitive impairment in AD40. A clear reduction in the expression of genes controlling memory networks was not evident in the 5XFAD mouse model, in which neuronal pathology is limited to neurite dystrophy. This difference may help explain the considerable disparity between human and mouse signatures of reactive glial cells.
Our human data are partially concordant with a recent study examining human AD and control samples by snRNA-seq20. Several cell type-specific upregulated genes identified by Mathys et al., including MHC class II and APOE in microglia and QDPR, CA2, and SLC38A2 in oligodendrocytes, were also upregulated in our AD samples. We also distinguish additional genes upregulated in AD, a novel astrocyte cluster depleted in AD, upregulation of certain “homeostatic” microglia genes, and a potential role for IRF8 in microglia reactivity. Some of these transcriptional changes correspond to protein changes previously detected in the CSF as AD biomarkers (see Supplementary Table 3). Importantly, we documented a measurable impact of the human R47H and R62H variants on microglia responses, while astrocyte and oligodendrocyte reactive signatures were not obviously affected. Notably, NanoString analysis revealed that the precise glial and neuronal gene signatures varied slightly between the three distinct cohorts analyzed, reflecting disparate demographics and/or differing regions of the brain from which the samples were obtained. Future snRNA-seq studies examining different cohorts and brain regions may shed further light on the spectrum of AD-related transcriptional changes.
Online Methods
Mice
WT (C57BL/6J) and 5XFAD (Tg6799) mice were purchased from Jackson Laboratory. Trem2−/−, Trem2−/− 5XFAD, CV 5XFAD and R47H 5XFAD mice were generated as previously described15,17 and are available upon reasonable requests. All mice were bred and housed in specific pathogen-free conditions. The Institutional Animal Care and Use Committee at Washington University in St. Louis approved all protocols used in this study. No animals were excluded from analysis. Animals used for snRNA-seq were sacrificed at 7 or 15 months of age. 3 male mice per genotype (WT, Trem2−/−, 5XFAD and Trem2−/− 5XFAD) were used. Animals used for validation with IF were the same as used for snRNA-seq, or were sacrificed at the age of 5 months as stated in the figure legends, with 3 male, 3 female 5XFAD and 1 male, 5 female Trem2−/− 5XFAD mice. Animals used for proteomics and phospho-proteomics were sacrificed at the age of 10 months with 1 male and 1 female per genotype. Investigators were not blinded to experimental groups, but all samples and data were processed in a high-throughput or automated fashion.
Human samples
Post-mortem human brain samples were obtained from Rush Alzheimer’s Disease Center at Rush University, the Knight Alzheimer’s Disease Research Center (ADRC) at Washington University and the Brain Research Institute (BRI) at Niigata University. Post-mortem prefrontal cortical tissues from 11 AD patients with TREM2 common variant (CV), 10 AD patients carrying TREM2 R62H variant, and 11 age-matched controls from the Rush cohort were analyzed by snRNA-seq. Sex was balanced between AD (CV) and control individuals, with 7 females and 4 males in each group; the AD (R62H) group has 5 females and 5 males. Post-mortem frozen prefrontal cortical tissues from 12 controls, 13 AD patients with TREM2 CV and 11 patients with TREM2 R62H variant from the Rush cohort, parietal cortical tissues from 5 AD patients with TREM2 CV and 5 patients with TREM2 R47H variant from the ADRC, and occipital cortical tissues from 10 controls and 10 AD patients with TREM2 CV from the Japan BRI cohort were analyzed by NanoString nCounter platform. Characteristics of donors of the human tissues at the time of collection is indicated in Supplementary Table 2. Pre-mortem consent was obtained from each subject with the approval by the Institutional Review Board (IRB) of each institution. For human IHC, autoptical samples were retrieved from the archive of the Department of Pathology (Spedali Civili of Brescia) and study was conducted in compliance with policies approved by the Ethics Board of Spedali Civili di Brescia, University of Brescia for retrospective and exclusively observational study on archival material obtained for diagnostic purpose and patient consent was not needed (Delibera del Garante n. 52 del 24/7/2008 and DL 193/2003). AD patients were a female of 66 and a male of 62 years old, respectively. Control brain was from a 72-year-old male died for cardiac failure.
Isolation of nuclei from frozen brain tissue
Flash frozen brain tissue was homogenized in a Dounce homogenizer in Lysis Buffer (10 mM Tris-HCl, pH 7.4, 10 mM NaCl, 3 mM MgCl2, and 0.025% NP-40), and incubated on ice 15 minutes. The suspension was filtered through a 30 μm filter to remove debris and pelleted at 500 x g 5 min at 4° C. Nuclei were washed and filtered twice with Nuclei Wash (1% BSA in PBS with 0.2 U/μL RNasin (Promega)). Nuclei pellets were resuspended in 500 μL Nuclei Wash and 900 uL 1.8 M Sucrose. This 1400 μL mixture was carefully layered on top of 500 μL 1.8 M sucrose and centrifuged at 13,000 x g 45 min 4oC to separate the nuclei from myelin debris. The nuclei pellet was resuspended in Nuclei wash at 1000 nuclei/μL and filtered through a 40 μm FlowMi Cell Strainer.
Single-nucleus RNA-Seq
Isolated mouse nuclei from 7-month-old cohort and human nuclei were subjected to droplet-based 5’ end massively parallel single-cell RNA sequencing using Chromium Single Cell 5’ Reagent Kits as per manufacturer’s instructions (10x Genomics). Isolated mouse nuclei from 15-month-old cohort were subjected to droplet-based 3’ end massively parallel single-cell RNA sequencing using Chromium Single Cell 3’ Reagent Kits as per manufacturer’s instructions (10x Genomics). The libraries were sequenced using Illumina sequencers at the McDonnell Genome Institute. Sample demultiplexing, barcode processing, and single-cell counting was performed using the Cell Ranger Single-Cell Software Suite (10x Genomics). Cellranger count was used to align samples to the reference genome (mm10, hg38), quantify reads, and filter reads with a quality score below 30.
Processing data with Seurat package and quality control
The Seurat package in R was used for subsequent analysis47. For quality control, nuclei with mitochondrial content greater than 5 percent were removed. Nuclei that are duplets or multiplets were filtered out by two steps. First, nuclei with more than one marker gene expressed were removed. Then cells with high UMI and gene number per cell were filtered out. Cutoffs for UMI and gene number were determined based on histograms showing cell density as a function of UMI/gene counts. For 7-month-old mouse brain snRNA-seq analysis, a cutoff of 300–9,000 UMI, 300–5,600 Gene was applied. After filtering, a total of 73,419 individual nuclei across all genotypes were remained, with a median of 3,941 UMIs and 2,378 genes per nucleus for downstream analysis. For human brain snRNA-seq, a cutoff of 400–20,000 UMI, 400–7,000 Gene was applied. After filtering, 66,311 nuclei were remained across 11 AD (CV), 10 AD (R62H) and 11 control samples, with a median of 1,951 UMIs and 1,312 genes per nucleus for downstream analysis. For 15-month-old mouse brain snRNA-seq analysis, genes expressed in fewer than 3 nuclei and nuclei that expressed less than 400 or greater than 3500 genes were removed for downstream analysis. After filtering, 38,230 nuclei were remained. Data was normalized using a scaling factor of 10,000, and nUMI was regressed with a negative binomial model. Principal component analysis was performed using the top 3000 most variable genes and t-SNE analysis was performed with the top 20 PCAs. Clustering was performed using a resolution of 0.6.
Clustering and finding markers
Principal component analysis was performed prior to clustering and the first 10 PC’s were used based on the ElbowPlot. Clustering was performed using the FindClusters function which works on K-nearest neighbor (KNN) graph model with the granularity ranging from 0.1–0.9 and selected 0.2 for the downstream clustering. For identifying the markers for each cluster, we performed differential expression of each cluster against all other clusters identifying negative and positive markers for that cluster. Nuclei from broad cell types (astrocytes, microglia and oligodendrocytes clusters) were taken and re-clustered to further analyze the sub-clusters in each cell type.
Analysis of gene differential expression
Differential expression of genes between conditions was done using the MAST algorithm48 of Seurat package in R, which implements a two-part hurdle model. Log2(fold change) of average expression and the percentage of cells (pct) expressing the genes in each condition were generated. For the mouse snRNA-seq analyses, to facilitate data interpretation, changes in frequency of cells were taken into account. The bulk fold change was calculated by adding log2(pct1+0.005)/(pct2+0.005) to the log2(FC) generated from the Seurat Package. Adjusted p-value was calculated based on Bonferroni correction.
Lists of mouse DEGs were generated by filtering all genes for fold change>1.5, adjusted p-value<0.05. The lists were ordered by adjusted p-value (Supplementary Table 1). For the human snRNA-seq analysis, lists of DEGs in non-neuronal clusters were generated by filtering genes for log2(fold change)>0.5, p-value<0.05. These gene lists were used as inputs for downstream sub-clustering analyses. Lists of human DEGs in neuronal clusters were generated by filtering all genes for p-value<0.05. The lists were ordered by fold changes (Supplementary Table 4).
Comparing marker genes with the public datasets
Public datasets GSE53890 and GSE39420 were processed and analyzed in the Phantasus tool (https://artyomovlab.wustl.edu/phantasus/). The top 12,000 genes ranked by average gene expression were selected for differential expression analysis using the LIMMA package. Differential Expression was performed between samples with age less than 40 and greater than 80, and between controls and early onset Alzheimer’s patients, respectively. Gene set enrichment analysis was then performed using the marker genes from oligodendrocyte and microglia sub-clusters as inputs.
NanoString nCounter analysis
RNA from post-mortem frozen samples was extracted with Qiagen RNeasy Kit and sent for NanoString nCounter analysis49. Briefly, RNA is directly tagged with a capture probe and a reporter probe specific to the genes of interest. After hybridization, the probe-target complexes are immobilized on an imaging surface, which are then scanned by fluorescence microscope and labeled barcodes are counted. Gene expression analysis was performed on the nCounter system (NanoString Technologies) according to manufacturer’s instructions and analyzed using nSolver analysis software (NanoString Technologies) and built in statistical analyses.
Immunofluorescence
Mice were anesthetized with ketamine/xylazine and perfused with ice-cold PBS containing 1 U/ml of heparin. Right brain hemispheres were fixed in 4% PFA overnight at 4°C, rinsed in PBS, and incubated overnight at 4°C in 30% sucrose before freezing in a 2:1 mixture of 30% sucrose and optimal cutting temperature compound. Serial 40 μm coronal floating sections were cut on a Cryostat (Leica CM1860) and kept in cryoprotectant (30% sucrose, 30% ethylene glycol, PBS). Floating sections were blocked with 3% BSA and 0.25% Triton X-100 in PBS, and stained with anti-Iba-1 (rabbit polyclonal, 1:5,000; Wako; or goat polyclonal, 1:1,000; Abcam), anti-Olig2 (rabbit polyclonal, 1:500; Millipore; or goat polyclonal, 1:500; R&D Systems), anti-mSerpin A3N (goat polyclonal, 1:100; R&D Systems), anti-C4 (rat IgG2a, 1:25; Invitrogen), and/or anti-CA2 (rat IgG2a, 1:200; R&D Systems) overnight at 4°C followed by staining with Alexa Fluor 488 labeled anti-GFAP (1:1,000; eBioscience), anti-goat IgG Alexa Fluor 488 (1:2,000; Abcam), anti-rabbit IgG Alexa Fluor 647 (goat polyclonal, 1:2,000; Invitrogen), anti-rat IgG Alexa Fluor 647 (goat polyclonal, 1:2,000; Invitrogen), methoxy-X04 (3 μg/ml; Tocris), and/or TO-PRO-3 iodide (300 nM; Thermo Fisher Scientific) for 1 h at room temperature. Serpina3n and CA2 staining was performed with antigen retrieval, preceding blocking, in 10mM sodium citrate buffer with 0.05% Tween-20, at 85°C for 30 minutes. All antibodies were used in blocking buffer, and between all incubations, sections were washed for 10 min in PBS three times. Images were collected using a Nikon A1Rsi+ confocal microscope. Three-dimensional image segmentation of microglia, oligodendrocytes, astrocytes, plaques, and neurons, and extraction of parameters were performed in Imaris 8.1 (Bitplane), and further processing was performed using automated scripts in Matlab (Mathworks).
For human IRF8 staining, PPFE sections from Rush AD center were de-paraffinized, rehydrated and boiled in 1mM citrate buffer (pH=6) for 10min for antigen retrieval. Sections were then blocked with 1% BSA and 0.03% Triton-X in TBST. anti-IRF8 (rabbit polyclonal, 1:50, Atlas) and anti-Iba1 (goat polyclonal, 1:200; Abcam) were incubated with sections overnight at 4°C in 0.3% BSA, followed by anti-goat IgG Alexa Fluor 555 (1:1,000; Abcam) and anti-rabbit IgG Alexa Fluor 647 (goat polyclonal, 1:1,000; Invitrogen) for 50min at room temperature. Between all incubations, sections were washed for 5min in TBST three times. Sections were mounted with DAPI.
Immunohistochemistry
Histological diagnosis was revised and formalin-fixed paraffin-embedded representative sections for each patient were selected based on adequate tissue preservation as assayed by hematoxylin and eosin (H&E) staining and subjected to IHC. Briefly, 20μm thick paraffin embedded representative tissue sections were de-waxed, rehydrated and endogenous peroxidase activity blocked with 0,3% H2O2 in methanol for 20min. Antigen retrieval was performed by using a microwave-oven in 1mM Citrate buffer (pH 6.0). Sections were then washed in TBS (pH 7.4) and incubated for one hour or overnight in anti-Iba1 (rabbit polyclonal, 1:300; Wako), anti-CD68 (mouse IgG3, 1:100; Dako) or, anti-HLA-DR (1:250, Biomeda) in TBS 1% BSA. Signal was revealed using the DAKO Envision+System-HRP Labelled Polymer Anti-Rabbit or Anti-Mouse or the NovoLinkTM Polymer Detection System (NovocastraTM), followed by Diaminobenzydine (DAB) as chromogen and Hematoxylin as counterstain. For detection of microglia around the plaques, we combined silver staining with Iba1 IHC by using the MACH4 Universal HRP-Polymer kit (Biocare) and signal was revealed by Ferangi Blue Chromogen Kit (Biocare). Images were acquired with an Olympus Bx60 microscope and Cell Sens Standard Ink imaging software (Olympus Corporation) mounted on a DP73 Olympus camera.
Quantification of staining
For measurement of perinuclear Serpina3n and C4b intensity, oligodendrocyte nuclei were determined using the Surfaces function of Imaris on Olig2 data. After Olig2+ surfaces were defined, the perinuclear region was defined as within 2 μm of the Olig2+ surface. This was accomplished by using the “Distance from Surfaces” function on the Olig2+ surfaces to assign a value to each voxel representing the distance to the nearest Olig2+ surface. Next, a threshold of 2 μm or smaller was used to generate another set of surfaces including the nucleus and perinuclear region. The intensity of staining within these surfaces was determined by taking the mean of voxel intensity values within the surfaces. Two images were acquired per brain for quantification.
For measurement of Serpina3n intensity in CA2+ cells, oligodendrocytes were determined using the Surfaces Function of Imaris on CA2 channel. Intensity of Serpina3n was then quantified by calculating the weighted average of Serpina3n mean fluorescence intensity over the volume of CA2 surfaces. Three images were acquired per brain for quantification.
Number of Olig2+ or CA2+ oligodendrocytes was quantified by counting the total number of Olig2+ or CA2+ Surfaces per image generated as described above.
For measurement of oligodendrocyte density around plaques, plaque volume and center of mass were determined using the Surfaces function of Imaris on methoxy-X04 image data. Oligodendrocyte nuclei were identified using the Spots function of Imaris for Olig2 nuclear staining. To calculate the number of oligodendrocyte nuclei within a given distance from plaque surfaces, each plaque was modeled as an idealized sphere with the same volume and center of mass. Pairwise Euclidean distances were calculated between each oligodendrocyte nucleus and each plaque, taking into account the idealized plaque radius. For each plaque, the number of oligodendrocytes within the specified distance was enumerated. Oligodendrocytes were allowed to be counted for multiple plaques. Next, the occupiable volume for oligodendrocytes was calculated by finding the volume of the sphere (or spherical segment) that falls within the specified distance. As an example, for a plaque of radius 10 μm and a cutoff of 30 μm, the volume of a 40-μm sphere is determined. If either the top or bottom of this sphere (or both) extends beyond the top or bottom of the z-stack, respectively, the volume is calculated using the formula for spherical segments instead of the formula for a sphere. Finally, the number of oligodendrocytes is divided by the occupiable volume to obtain the density, and these values are averaged for all the plaques for a given animal.
Proteomics and phospho-proteomics
Lysis, digestion, and preparation for mass spectrometry analysis
Frozen half brain sections were lysed in 5 mL of lysis buffer containing 8 M urea, 20 mM HEPES pH 8.5, phosphatase inhibitors (1mM β-glycerophosphate, 1mM sodium orthovanadate), homogenized with a Polytron, and probe tip sonicated. Samples were subsequently reduced with 5 mM DTT for 50 min at 55°C, alkylated for 30 min with 10 mM iodoacetamide, and quenched with 5 mM DTT. Samples were diluted to 2M urea with digestion dilution buffer (20 mM pH 8.5 HEPES containing 1mM CaCl2) and digested at 37 °C with 100μg of Lysyl Endopeptidase (Wako-Chem). Samples were then diluted to 1 M urea and digested for 5 hours with 100 μg of trypsin (Pierce). Following digestion, peptides were acidified with TFA, centrifuged at 500 x g for 20 min and purified over SepPak C18 columns. Following elution, peptides were quantified with a MicroBCA assay (Thermo Fisher Scientific, San Jose, CA).
Total protein sample preparation
20 μg of peptides from each sample were labeled with isobaric tandem-mass-tag (TMT) 11 plex reagents (Thermo Fisher Scientific, San Jose, CA) in 20 mM pH 8.5 HEPES with 30% acetonitrile (v/v) with 50 μg of TMT reagent. The reaction was quenched for 15 min by adding hydroxylamine to a final concentration of 0.3% (v/v). The plex design is shown in Table 1. Samples were combined, dried, purified over SepPak C18 columns, and dried again. Samples were then resuspended in 50 μL of bRP buffer A (10 mM NH4HCO2, pH10, 5% ACN) and separated on a Zorbax Extended C18 column (2.1 × 150 mm, 3.5 μm, no. 763750-902, Agilent) using a gradient of 10–40% bRP buffer B (10 mM NH4HCO2, pH10, 90% ACN). 96 fractions were collected before concatenation 24 fractions. Each fraction was dried and desalted over a C18 STAGE-Tip prior to analysis by mass spectrometry.
Table 1.
TMT-Labeling scheme for total protein and phospho-peptide analysis.
| TMT-Channel | Sample |
|---|---|
| 126 | KO Male + Female Mix |
| 127N | R47H Male |
| 127C | R47H Female |
| 128N | CV Male |
| 128C | CV Female |
| 129N | 5x FAD KO Male |
| 129C | 5x FAD KO Female |
| 130N | 5x FAD R47H Male |
| 130C | 5x FAD R47H Female |
| 131N | 5x FAD CV Male |
| 131C | 5x FAD CV Female |
IMAC phosphopeptide sample preparation
High-Select™ Fe-NTA Phosphopeptide Enrichment Kits from Thermo were used to enrich phosphopeptides from 5mg of peptides for each sample. Following the elution from the IMAC column, enriched samples were dried then cleaned over a SepPak, and quantified via MicroBCA. 20 μg of enriched peptides were labeled with TMT and bRP fractionated as described above, instead with a gradient of 5–40% buffer B. The 24 concatenated fractions were desalted over a C18 STAGE-Tip.
Immunoaffinity Purification with Motif Antibodies
10 μg of IMAC-enriched peptides from each sample were TMT-labelled, combined, cleaned over a SepPak, dried, and subjected to immunoaffinity purification (IAP) with phosphorylation-specific motif antibody reagents available from Cell Signaling Technology (CST). Peptides were resuspended in 200 μL of 1X IAP buffer (CST cat. #9993) and sequentially immunoaffinity purified as described in the available protocols with pY1000 (cat. #8803), Basophilic Kinase Substrate Motif (#32948), ATM/ATR (cat. #12267), AKT/AMPK (cat. #5561, #5563, #5564), and S/TP (cat #28303) reagents. Prior to MS-analysis, each IAP elution was further cleaned with a High-SelectTM Fe-NTA Phosphopeptide Enrichment Kit from Thermo and desalted over a C18 STAGE-Tip.
LC–MS/MS analysis of total protein fractions
Samples were analyzed on an Orbitrap Fusion Lumos mass spectrometer (Thermo Fisher Scientific, San Jose, CA) coupled with a Proxeon EASY-nLC 1200 liquid chromatography (LC) pump (Thermo Fisher Scientific, San Jose, CA). Peptides were separated on a 100 μm inner diameter microcapillary column packed with ~40 cm of Accucore150 resin (2.6 μm, 150 Å, ThermoFisher Scientific, San Jose, CA). For each analysis, we loaded approximately 1 μg onto the column. Peptides were separated using either a 2.5 h gradient of 6–30% acetonitrile in 0.125% formic acid with a flow rate of 550 nL/min. Each analysis used an SPS-MS3-based TMT method50. The scan sequence began with an MS1 spectrum (Orbitrap analysis, resolution 120,000; 350–1400 m/z, automatic gain control (AGC) target 4.0 × 10⁵, maximum injection time 50 ms). Precursors for MS2/MS3 analysis were selected using a Top10 method. MS2 analysis consisted of collision-induced dissociation (quadrupole ion trap; AGC 2.0 × 10⁴; normalized collision energy (NCE) 35; maximum injection time 120 ms). Following acquisition of each MS2 spectrum, we collected an MS3 spectrum a method in which multiple MS2 fragment ions are captured in the MS3 precursor population using isolation waveforms with multiple frequency notches50. MS3 precursors were fragmented by HCD and analyzed using the Orbitrap (NCE 65, AGC 3.5 × 10⁵, maximum injection time 150 ms, isolation window 1.2 Th, resolution was 50,000 at 200 Th).
LC–MS/MS analysis of phosphopeptide enriched fractions
MS-analysis of phosphopeptides was performed as described above with the following exceptions. The MS1 spectrum method scan had a scan range of 350–1400 m/z, maximum injection time of 100 ms, and AGC of 2.0 × 10⁵. The MS3 spectrum method had a maximum injection time of 250 ms, AGC target of 6.0 × 10⁵, and an isolation window of 0.7 Th.
Total protein data processing and analysis
Mass Spectra were processed using a Sequest-base software pipeline51. Samples were searched with a tryptic mouse database with hTREM2, allowing for a static modification of lysine and N-termini with TMT (229.1629 Da) and carbamidomethylation (57.0215 Da) of cysteine, along for variable oxidation (15.9949 Da) of methionine. Searches were performed using a 50 ppm precursor ion tolerance, the product ion tolerance was set to 1.0 Da. Peptide-spectrum matches (PSMs) were adjusted to a 1% false discovery rate (FDR)52, when considering the following parameters: XCorr, ΔCn, missed cleavages, peptide length, charge state, and precursor mass accuracy. Filtered PSMs were collapsed to a final protein-level FDR of < 2%. Protein assembly was guided by principles of parsimony to produce the smallest set of proteins necessary to account for all observed peptides51. For TMT-based reporter ion quantitation, we extracted the summed signal-to-noise (S/N) ratio for each TMT channel and found the closest matching centroid to the expected mass of the TMT reporter ion. PSMs with poor quality, MS3 spectra with TMT reporter ion summed signal-to-noise ratios less than 110 were excluded from quantitation53.
Phosphorylation data processing and analysis
When searching phosphorylation data, a variable modification for phosphorylation (79.9663 Da) was allowed on serine, threonine, and tyrosine. A regular expression for phosphorylation was used to perform using linear discriminant analysis (LDA) and set a false discovery rate (FDR) of < 2.5% while considering XCorr, ΔCn, tryptic state, missed cleavages, adjusted ppm, peptide length, peptides/protein, PSMs/protein, corrected protein counts, and charge state. Filtered PSMs were collapsed to a final protein-level FDR of < 2%. Unique identified phosphorylation sites from each method were evaluated using AScore, and confidently localized sites with a AScore > 13 were selected for analysis (p-value < 0.05)54. PSMs with TMT reporter ion summed signal-to-noise ratios less than 55 were excluded from quantitation.
Cell culture and biochemical assays
Human oligodendroglioma cell line HOG (SCC163, Millipore Sigma) was cultured in complete RPMI, supplemented with 10% FBS, Penicillin/Streptomycin, GlutaMax and pyruvate. Aβ oligomers or fibrils were prepared as described previously55. Briefly, human Aβ42 peptide (Anaspec) was dissolved in HFIP, dried overnight at room temperature, then resuspended in DMSO. For oligomer formation, Aβ was diluted to 100 μM in Ham’s F12 and incubated at 4°C for 36h. To form fibrils, Aβ was diluted to 100 μM in 10mM HCl and incubated at 37°C for 72h. Aβ oligomers or fibrils were then added to cells at the indicated concentrations for 18h and cells were collected for subsequent experiments. For HOG stimulation assays, alpha-2-macroglobulin (R&D) was added to HOG cells at 500ng/ml for 24 hs and a mixture of cytokines, including IL-1β, IL-6, TNF〈, IFN〈, IFNγ were added to the cells for 8 hours. RNA from treated cells was then extracted and used for subsequent experiments.
Bone marrow derived macrophages (BMDMs) were collected from fibia of WT or Irf8−/− mice. Isolated bone marrow cells were cultured in RPMI, supplement with 10% heat-inactivated FBS, Penicillin/Streptomycin, GlutaMax and pyruvate in 10mm petri dish. On day 5, BMDMs were replated into 96-well plates and 1ug/ml human TGFβ was added to the culture to mimic microglia. After 48 hours, BMDMs were collected for flow cytometry assays. For Irf8 overexpression in WT BMDMs, Day 1 BMDMs were transduced with virus containing pESV-ires-eGFP or pESV-Irf8-ires-eGFP. 7 days after transduction, cells were replated into 96-well plates with 1ug/ml human TGFβ and collected for flow cytometry after 48h.
Flow cytometry
Single cell suspensions were stained with biotin anti-P2RY12 antibody (1:100, BioLegend) in Fc block for 20 min at 4°C, followed by streptavidin eFluor450 conjugated antibody (1:200, eBioscience) in FACS wash buffer. Intracellular IRF8 (IRF8-FITC/IRF8-APC, V3GYWCH, 1:100, eBioscience) was stained with eBioscience Transcription Factor staining kit. Cells were run on a FACSCanto II. Transduced cells were identified by GFP+. Data was analyzed using FlowJo.
Aβ aggregation in microplate shaking assay
Solutions of size exclusion chromatography-purified56 Aβ42 monomer (10 or 20 μM) and thioflavin T (ThT) (20 μM) were prepared in the absence or presence of recombinant mouse Serpina3n (R&D Systems) or recombinant human C4b (Abnova) with molar ratio of Aβ42:Serpina3n/C4b at 1:200 or 1:100 as indicated in the figure. BSA was included as a negative control. Aliquots (n=5) were transferred to a Corning 3661 half-volume 96-well fluorescence plate and incubated with rotary shaking at 180 rpm in a 37°C incubator. About every 15 min, ThT fluorescence was determined in a Cytation5 plate reader for all samples including ThT alone. Fluorescence intensity was acquired with excitation filter of 440nm and emission filter at 490nm, bandpass 15nm.
RT-qPCR
Total RNA was extracted using the RNeasy Mini Kit (Qiagen) for cortical brain tissues or by TRIzol reagent (Invitrogen) for cell cultures. Single-strand cDNA was synthesized with qScript cDNA Supermix (Quantabio). Real-time qPCR was performed using iTaq SYBR Green Supermix (Bio-Rad) and StepOnePlus (Applied Biosystems). mRNA levels were determined using the 2-delta cycle threshold method normalized to Actb mRNA. Primers were chosen from PrimerBank.
Pathway analysis
Proteomics and phosphor-proteomics data were analyzed through the use of IPA (QIAGEN Inc., https://www.qiagenbioinformatics.com/products/ingenuity-pathway-analysis). Gene set enrichment analysis (GSEA) was performed using the Broad Institute website computing gene set overlaps between canonical pathways (CP) and GO biological process (BP). Gene Ontology analysis was performed using Metascape57.
Statistics and reproducibility
snRNA-seq data were analyzed using MAST48 algorithm of Seurat package in R, which implements a two-part hurdle model. P values were adjusted based on Bonferroni correction. NanoString nCounter analysis was based on multivariate linear regression with Bejamani-Yekutieli adjustment. All statistical analyses for validation assays were performed using GraphPad Prism (v.8) with unpaired Student’s t test or one- or two-way ANOVA with Tukey’s multiple comparisons test. P values lower than 0.05 were considered statistically significant. Probability value was noted in each figure. Details on specific tests used are stated in the figure legends. Experiments were repeated two or more times. For confocal images in Fig. 3 and Extended Data Fig. 4, at least three images per mouse brain were acquired and averaged for quantification.
Life sciences reporting summary
Further information on research design and reagents is available in the Nature Research Reporting Summary linked to this paper.
Data availability
snRNA-seq gene lists with statistics and NanoString nCounter gene lists are available as Supplementary Tables 1,4,5 accompanying this article. Mouse snRNA-seq data that support the findings of this study have been deposited in the Gene Expression Omnibus (GEO) database with accession number XXX. Human snRNA-seq data that support the findings of this study have been deposited to Synapse (https://www.synapse.org/#!Synapse:syn21125841/wiki/). All requests for human snRNA-seq data are promptly reviewed by Rush Alzheimer’s Disease Center at Rush University, ADRC at Washington University and the BRI at Niigata University to verify if the request is subject to any intellectual property or confidentiality obligations. Any data and materials that can be shared will be released via a Material Transfer Agreement upon reasonable requests. Please contact the corresponding authors for additional information.
Extended Data
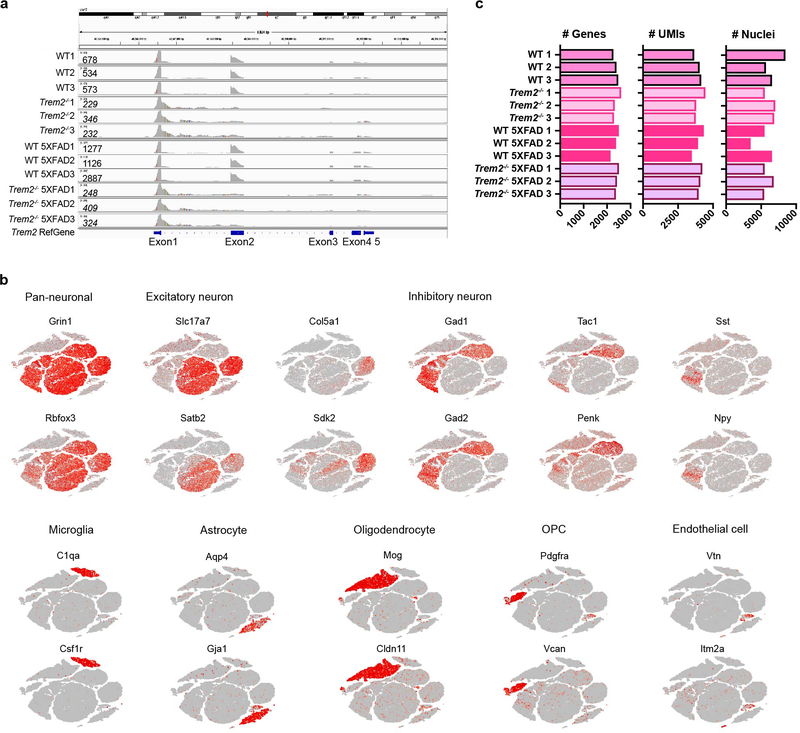
Extended Data Fig. 1. Cluster characterization of 7-month-old mouse cohort.
a, Alignment of Trem2 reads from all mice sequenced to the Trem2 reference genome shows knockout of Trem2 gene in Trem2−/− and Trem2−/− 5XFAD mice. No reads from Trem2−/− and Trem2−/− 5XFAD mice align to Trem2 exon2. Alignment of reads from Trem2-deficient mice to Trem2 exon1 reflects early transcriptional termination due to deletion of exons 3 and 4 in the design of Trem2 knockout constructs. The presence of exon1 reads correspond to the use of 5’ sequencing in this cohort. Numbers on the left represent the total number of Trem2 reads from each sample. b, tSNE plots of snRNA-seq of 7-month-old mouse brain showing cell type specific markers identifying each cluster. n=73,419 total cells. c, Bar graphs showing median of the number of genes, median of the number of UMIs and the total number of nuclei of each sample sequenced.
Extended Data Fig. 2. Cluster characterization of 15-month-old mouse cohort.
a, t-SNE plot showing 13 distinguished clusters, 0–12, with cell type identities determined by expression of specific markers. Cluster 12 had very low frequency and did not have a clear marker profile and was thus omitted from analysis. b, Heat map showing specific markers identifying each cluster in a. Color scheme shows row max and row min. c, Pie chart showing the frequency of each cluster across all genotypes. Neuronal clusters are shown in blue hues and non-neuronal clusters are shown in red hues. d, Relative frequency of clusters in different samples, normalized to overall frequency in c, shown for cortex and hippocampus. Clusters 2 and 11 (neuronal) were exclusive to hippocampus, while clusters 0 and 6 (neuronal) were exclusive to cortex. Cluster 4 (neuronal) was enriched in Trem2−/− 5XFAD cortex. e, Number of unique molecular identifiers (UMIs), indicative of captured reads, superimposed on the t-SNE plot from a. Cluster 4 has a lower average number of UMIs compared to other neurons. f, t-SNE plot showing expression of Pam, a representative gene enriched in cluster 4. n=38,230 total cells pooled from 3 mouse brains per genotype (a,e,f).
Extended Data Fig. 3. Characterization of the microglia cluster in the 15-month-old mouse cohort.
a, t-SNE plot showing the microglia cluster (cluster 10 from Extended Data Fig. 2), expressing microglia genes, such as C1qa, Fcrls, and Tyrobp. b, Volcano plots showing DEGs (Fold change>1.5, two-part hurdle model, adjusted p-value<0.05, Bonferroni correction) of 5XFAD vs. WT (effect of Aβ) and 5XFAD vs. Trem2−/− 5XFAD (dependence of Trem2) in microglia. c, t-SNE plot of re-clustered microglia (from cluster 10) identifying 4 sub-clusters. d, Bar graphs showing the relative frequency of sub-cluster 3 in each sample. Sub-cluster 3 is only present in the 5XFAD sample. e, Violin plots showing the expression of DAM genes, Cst7, Gpnmb and Spp1, enriched in sub-cluster 3. Violin plots are presented with floating box showing median (middle line) and quartiles (top and bottom). Minima and maxima are shown as the bottom and top of the violin plots. n=266 WT, 92 Trem2−/−, 171 WT 5XFAD, and 88 Trem2−/− 5XFAD microglial cells, pooled from 3 mouse brains per genotype (a,b,c,e).
Extended Data Fig. 4. Oligodendrocytes acquire an Aβ-dependent signature and do not cluster around plaques in the 5XFAD model.
a, Box plots showing average gene expression across oligodendrocyte nuclei isolated from each mouse in the 7-month-old cohort. Floating bars show the min and max and black line shows the mean. Each dot represents one mouse. n=3 biologically independent mice per genotype. b, Violin plots showing expression of C4b, Serpina3n and H2-D1 in all oligodendrocytes from the 15-month-old cohort. Violin plots are presented with floating boxes showing median (middle line) and quartiles (top and bottom). Minima and maxima are shown as the bottom and top of the violin plots. n=617 WT, 298 Trem2−/−, 160 WT 5XFAD, and 308 Trem2−/− 5XFAD oligodendrocytes, pooled from 3 mouse brains per genotype. c, RT-qPCR from human oligodendrocyte cell line (HOG) treated with Aβ oligomers or fibrils at the indicated concentrations for 18 hours showing Aβ directly induces C4. n=3 biologically independent cell cultures. d, RT-qPCR from HOG treated with soluble factors (GPNMB or alpha-2-macroglobulin) for 24 hours or a cocktail of cytokines (IL-1β, IL-6, TNFα, IFNα, IFNγ) for 8 hours showing induced C4. n=3 biologically independent cell cultures. e, Representative immunofluorescence images of Olig2 and plaque staining in 5-month-old WT 5XFAD and Trem2−/− 5XFAD cortex. n=6 mice per genotype. Scale bar, 50 μm. f, Quantification of density of Olig2+ nuclei within 15 μm or 30 μm shell around plaque surfaces in the cortex in e, n=6 mice per genotype. g, Quantification of total number of CA2+ oligodendrocytes in all 4 genotypes at 7 months of age. n=3 mice per genotype. h, Representative immunofluorescence images of Serpina3n staining in 7-month-old mice of all genotypes showing colocalization of Serpina3n with oligodendrocyte marker CA2. White arrow heads indicate colocalization. n=3 mice per genotype. Scale bar, 15 μm. i, Automated quantification of Serpina3n intensity in CA2+ oligodendrocytes in h. n=3 mice per genotype. j, Representative confocal images showing colocalization of Serpina3n with GFAP+ astrocytes in 15-month-old 5XFAD mice. n=3 mice per genotype. Scale bar, 50 μm. k, Representative confocal images showing colocalization of Serpina3n with X04+ plaques in 15-month-old 5XFAD mice. IV, V and VI indicate corresponding cortical layers. n=3 mice per genotype. Scale bar, 60 μm. l, Thioflavin T fluorescence of Aβ42 aggregation with the addition of combinations of proteins at indicated concentrations in microplate shaking assay. n=5 independent wells for the aggregation reactions; data represent two independent experiments. P-value by one-way ANOVA, Tukey’s multiple comparisons test (a,g,i) or unpaired t test, two-tailed (c). All data are presented as mean ± SEM.
Extended Data Fig. 5. Heat maps of fold changes of DEGs in OPC, astrocyte, and neuron clusters in the 7-month-old mouse cohort.
Cluster-by-cluster analysis of differential gene expression. Heat maps showing the top 30 (or less) DEGs (fold change>1.5, two-part hurdle model, adjusted p-value<0.05, Bonferroni correction), ordered by adjusted p-value, and results are presented for comparisons of 5XFAD vs. WT. Numbers indicate log2(Fold change). Analyses are presented for the following clusters: a, cluster 8 (OPC), n=485 5XFAD and 705 WT cells; b, cluster 6 (astrocytes), n=490 5XFAD and 1,088 WT cells; c, cluster 0 (excitatory neurons), n=3,302 5XFAD and 4,396 WT cells; d, cluster 3 (excitatory neurons), n=1,941 5XFAD and 3,038 WT cells; e, cluster 5 (excitatory neurons), n=1,530 5XFAD and 1,912 WT cells; f, cluster 1 (inhibitory neurons), n=2,606 5XFAD and 3,315 WT cells; and g, cluster 4 (inhibitory neurons), n=1,672 5XFAD and 2,660 WT cells. n=3 biologically independent mouse brain samples per genotype. The lists of genes are in Supplementary Table 1.
Extended Data Fig. 6. Proteomic analysis recapitulates major findings from snRNA-seq analysis.
a, Left panel: Heat map of relative abundance of the most significantly upregulated proteins from proteomics in CV 5XFAD compared to CV mice, ranked by fold change. Total protein analysis was conducted on brain tissues from 10-month-old CV, R47H, Trem2−/− (KO), CV 5XFAD, R47H 5XFAD and KO 5XFAD mice. Right panel: Heat map showing average expression of corresponding gene in each cluster in snRNA-seq of every mouse from 7-month-old cohort. Each column represents one individual mouse. Within a cluster, mice from left to right: WT1-3, Trem2−/−1–3, WT 5XFAD1-3, Trem2−/− 5XFAD1-3. b, Relative abundance of selected proteins upregulated in different cell types. c, IPA analysis showing pathways upregulated in CV-5XFAD compared to CV mice in proteomics. n=312 genes, Fisher’s exact test. d, Left panel: Heat map of relative abundance of proteins with the most significantly upregulated phosphopeptides from phosphoproteomics in CV 5XFAD compared to CV mice, ranked by fold change. Right panel: Heat map showing average expression of corresponding gene in each cluster in snRNA-seq of every mouse from 7-month-old cohort. Each column represents one individual mouse. Within a cluster, mice from left to right: WT1-3, Trem2−/−1–3, WT 5XFAD1-3, Trem2−/− 5XFAD1-3. e, IPA analysis showing pathways upregulated in CV-5XFAD compared to CV mice in phospho-proteomics. n=270 genes, Fisher’s exact test.
Extended Data Fig. 7. Characterization of human snRNA-seq.
a, Total number of nuclei, median of number of UMIs and median of number of genes of each human sample sequenced. b, t-SNE plots of human snRNA-seq showing cell type specific markers identifying each cluster. n=66,311 total cells. c, Violin plots showing expression of known cell type markers that define each cluster. Total number of cells in each cluster: 16,156 in Oli0, 13,322 in Oli1, 12,806 in Ex0, 1,869 in Ex1, 4,256 in In, 9,019 in Astro, 3,986 in Micro, 3,243 in OPC, 841 in Endo. Violin plots are centered around the median and shape represents cell distribution. d, Bar graph presenting frequency of nuclei in each neuronal sub-cluster across all neuronal nuclei, comparing AD (CV), AD (R62H) versus control samples. e, t-SNE plot showing expression of NEFL in neuronal clusters, especially in cluster Ex1. n=66,311 total cells.
Extended Data Fig. 8. AD-associated human signatures are distinct from that in Aβ mouse models.
a, Heat maps showing fold change of top DEGs (log2(FC)>0.5, two-part hurdle model, adjusted p-value<0.05, Bonferroni correction) between AD (CV) and control in all clusters. Left, genes up-regulated in AD. Right, genes down-regulated in AD. Numbers indicate log2(FC). n=11 AD (CV) patients and 11 controls. b, Violin plots showing expression of mouse DAM genes in 7- and 15-month-old mouse snRNA-seq and their homologs in human snRNA-seq within the microglia cluster. Violin plots are presented with floating boxes showing median (middle line) and quartiles (top and bottom). Minima and maxima are shown as the bottom and top of the violin plots. 7-month-old mouse, n=3 biologically independent mouse brains per genotype, 524 WT, 582 Trem2−/−, 1,123 WT 5XFAD, and 604 Trem2−/− 5XFAD microglial cells; 15-month-old mouse, n=266 WT, 92 Trem2−/−, 171 WT 5XFAD, and 88 Trem2−/− 5XFAD microglial cells, pooled from 3 mouse brains per genotype; human, n=11 controls, 1,547 cells; 11 AD patients, 919 cells. c, t-SNE plots showing the cell type of origin of selected DAM genes in the human brain. Color scheme shows expression. n=66,311 total cells. d, Gating strategy for viral transduced BMDMs. WT BMDMs were transduced with virus containing empty pESV-ires-eGFP vector or Irf8-overexpressing (OE) pESV-Irf8-ires-eGFP vector. Successfully transduced cells were identified by GFP+ gate. e, Gating strategy for WT and Irf8−/− BMDMs. f, Heatmap representing the average gene expression of top microglia DEGs in microglia sub-clusters in AD versus control samples. Color scheme shows row max and row min. g, t-SNE projection of all nuclei in AD versus control samples showing the lack of a sub-population of astrocytes in AD. Red circle indicates the population. Colors correspond to individual clusters. n=66,311 total cells. h, t-SNE plots showing the average z-scores of down-regulated genes in astrocytes. Red circle indicates the disappearing population enriched for down-regulated genes. n=65 down-regulated genes in astrocytes listed in Supplementary Table 4 were used as inputs. i, t-SNE plots of oligodendrocyte sub-clusters showing average z-scores of DEGs in oligodendrocytes. Top, up-regulated genes are enriched in Oligo0 and Oligo3 (indicated in Fig.5). Bottom, down-regulated genes are enriched in Oligo1 and Oligo2. n=20 up- and 23 down-regulated genes in oligodendrocytes listed in Supplementary Table 4 were used as inputs.
Extended Data Fig. 9. Human AD-associated oligodendrocyte and microglia signatures identified by snRNA-seq match public datasets from aging and early onset AD populations.
Cluster markers of Micro0, Micro1, Olig0 and Oligo1 (listed in Supplementary Table 4) were used as inputs for GSEA analysis against public datasets on aging (a, GSE53890) and early onset AD patients (b, GSE39420). Genes enriched in Micro0 and Oligo0 correspond to genes previously identified as upregulated in human aging and early onset AD patients. Genes enriched in Micro1 and Oligo1 correlate with downregulation in aging and early onset AD. n=146 genes for Micro0, 178 genes for Micro1, 59 genes for Oligo0 and 233 genes for Oligo1 were used as inputs. P-value by permutation test.
Extended Data Fig. 10. NanoString nCounter analysis of two cohorts of AD patients corroborates findings in snRNA-seq.
a, Diagram of NanoString pipeline. b, t-SNE plots of human brain showing the cell type of origin of top DEGs identified in NanoString analysis with Rush cohort. Color scheme shows expression. n=66,311 total cells shown. c, Volcano plot showing DEGs of AD vs. control from the BRI cohort. n=10 controls and 10 AD patients. P-value by multivariate linear regression with Bejamani-Yekutieli adjustment. d, Pathway analysis showing the same pathways are differentially regulated in AD brains from Rush (left) and BRI (right). e, t-SNE plots showing expression of IL10RA and HPGDS in human microglia. n=66,311 total cells shown.
Supplementary Material
Acknowledgments
We would like to thank K. Murphy and T. Murphy for generously providing us Irf8-overexpression constructs and Irf8−/− mice. We thank S. Kumar for the help with IF on human PPFE samples, and B. Zinselmeyer and B. Saunders for their help with confocal images. We thank I. Kawaki and the Collaborative Research Project of the Brain Research Institute, Niigata University. A. Kakita is supported by the Strategic Research Program for Brain Sciences from Japan Agency for Medical Research and Development, AMED. This work was supported by the NIH (RF1 AG051485, R21 AG059176, and RF1 AG059082 to M.Colonna, RF1 AG047644 and R01 NS090934 to D.M.H., R15 GM119070 to M.R.N.), the Cure Alzheimer’s Fund (to M.Colonna and D.M.H.), and the JPB Foundation (to D.M.H).
Footnotes
Competing Interests Statement
M. Colonna receives research support from Pfizer, Amgen, Alector and Ono.
References
- 1.Long JM & Holtzman DM Alzheimer Disease: An Update on Pathobiology and Treatment Strategies. Cell 179, 312–339 (2019). [DOI] [PMC free article] [PubMed] [Google Scholar]
- 2.De Strooper B & Karran E The Cellular Phase of Alzheimer’s Disease. Cell 164, 603–615 (2016). [DOI] [PubMed] [Google Scholar]
- 3.Heneka MT, Golenbock DT & Latz E Innate immunity in Alzheimer’s disease. Nat. Immunol. 16, 229–236 (2015). [DOI] [PubMed] [Google Scholar]
- 4.Griciuc A et al. Alzheimer’s disease risk gene CD33 inhibits microglial uptake of amyloid beta. Neuron 78, 631–643 (2013). [DOI] [PMC free article] [PubMed] [Google Scholar]
- 5.Gjoneska E et al. Conserved epigenomic signals in mice and humans reveal immune basis of Alzheimer’s disease. Nature 518, 365–369 (2015). [DOI] [PMC free article] [PubMed] [Google Scholar]
- 6.Seyfried NT et al. A Multi-network Approach Identifies Protein-Specific Co-expression in Asymptomatic and Symptomatic Alzheimer’s Disease. Cell Syst. 4, 60–72.e4 (2017). [DOI] [PMC free article] [PubMed] [Google Scholar]
- 7.Gosselin D et al. An environment-dependent transcriptional network specifies human microglia identity. Science 356, (2017). [DOI] [PMC free article] [PubMed] [Google Scholar]
- 8.Olah M et al. A transcriptomic atlas of aged human microglia. Nat. Commun 9, 539 (2018). [DOI] [PMC free article] [PubMed] [Google Scholar]
- 9.Masuda T et al. Spatial and temporal heterogeneity of mouse and human microglia at single-cell resolution. Nature 566, 388–392 (2019). [DOI] [PubMed] [Google Scholar]
- 10.Keren-Shaul H et al. A Unique Microglia Type Associated with Restricting Development of Alzheimer’s Disease. Cell 169, 1276–1290.e17 (2017). [DOI] [PubMed] [Google Scholar]
- 11.Krasemann S et al. The TREM2-APOE Pathway Drives the Transcriptional Phenotype of Dysfunctional Microglia in Neurodegenerative Diseases. Immunity 47, 566–581.e9 (2017). [DOI] [PMC free article] [PubMed] [Google Scholar]
- 12.Mathys H et al. Temporal Tracking of Microglia Activation in Neurodegeneration at Single-Cell Resolution. Cell Rep. 21, 366–380 (2017). [DOI] [PMC free article] [PubMed] [Google Scholar]
- 13.Bohlen CJ, Friedman BA, Dejanovic B & Sheng M Microglia in Brain Development, Homeostasis, and Neurodegeneration. Annu. Rev. Genet (2019) doi: 10.1146/annurev-genet-112618-043515. [DOI] [PubMed] [Google Scholar]
- 14.Ulland TK & Colonna M TREM2 - a key player in microglial biology and Alzheimer disease. Nat. Rev. Neurol 14, 667–675 (2018). [DOI] [PubMed] [Google Scholar]
- 15.Wang Y et al. TREM2 Lipid Sensing Sustains the Microglial Response in an Alzheimer’s Disease Model. Cell 160, 1061–1071 (2015). [DOI] [PMC free article] [PubMed] [Google Scholar]
- 16.Jay TR et al. TREM2 deficiency eliminates TREM2+ inflammatory macrophages and ameliorates pathology in Alzheimer’s disease mouse models. J. Exp. Med 212, 287–295 (2015). [DOI] [PMC free article] [PubMed] [Google Scholar]
- 17.Song WM et al. Humanized TREM2 mice reveal microglia-intrinsic and -extrinsic effects of R47H polymorphism. J. Exp. Med jem.20171529 (2018) doi: 10.1084/jem.20171529. [DOI] [PMC free article] [PubMed] [Google Scholar]
- 18.Yuan P et al. TREM2 Haplodeficiency in Mice and Humans Impairs the Microglia Barrier Function Leading to Decreased Amyloid Compaction and Severe Axonal Dystrophy. Neuron 90, 724–739 (2016). [DOI] [PMC free article] [PubMed] [Google Scholar]
- 19.Wang Y et al. TREM2-mediated early microglial response limits diffusion and toxicity of amyloid plaques. J. Exp. Med 213, 667–675 (2016). [DOI] [PMC free article] [PubMed] [Google Scholar]
- 20.Mathys H et al. Single-cell transcriptomic analysis of Alzheimer’s disease. Nature 570, 332–337 (2019). [DOI] [PMC free article] [PubMed] [Google Scholar]
- 21.Jäkel S et al. Altered human oligodendrocyte heterogeneity in multiple sclerosis. Nature 566, 543–547 (2019). [DOI] [PMC free article] [PubMed] [Google Scholar]
- 22.Oakley H et al. Intraneuronal beta-amyloid aggregates, neurodegeneration, and neuron loss in transgenic mice with five familial Alzheimer’s disease mutations: potential factors in amyloid plaque formation. J. Neurosci 26, 10129–10140 (2006). [DOI] [PMC free article] [PubMed] [Google Scholar]
- 23.Mucke L et al. Astroglial expression of human alpha(1)-antichymotrypsin enhances alzheimer-like pathology in amyloid protein precursor transgenic mice. Am. J. Pathol 157, 2003–2010 (2000). [DOI] [PMC free article] [PubMed] [Google Scholar]
- 24.Nilsson LN et al. Alpha-1-antichymotrypsin promotes beta-sheet amyloid plaque deposition in a transgenic mouse model of Alzheimer’s disease. J. Neurosci 21, 1444–1451 (2001). [DOI] [PMC free article] [PubMed] [Google Scholar]
- 25.Winkler C & Yao S The midkine family of growth factors: diverse roles in nervous system formation and maintenance. Br. J. Pharmacol 171, 905–912 (2014). [DOI] [PMC free article] [PubMed] [Google Scholar]
- 26.Molinuevo JL et al. Current state of Alzheimer’s fluid biomarkers. Acta Neuropathol. (Berl.) 136, 821–853 (2018). [DOI] [PMC free article] [PubMed] [Google Scholar]
- 27.Masuda T et al. IRF8 is a critical transcription factor for transforming microglia into a reactive phenotype. Cell Rep. 1, 334–340 (2012). [DOI] [PMC free article] [PubMed] [Google Scholar]
- 28.Vardarajan BN et al. Coding mutations in SORL1 and Alzheimer’s disease. Ann. Neurol 77, 215–227 (2015). [DOI] [PMC free article] [PubMed] [Google Scholar]
- 29.Angelova DM & Brown DR Microglia and the aging brain: are senescent microglia the key to neurodegeneration? J. Neurochem (2019) doi: 10.1111/jnc.14860. [DOI] [PubMed] [Google Scholar]
- 30.Ioannou MS et al. Neuron-Astrocyte Metabolic Coupling Protects against Activity-Induced Fatty Acid Toxicity. Cell 177, 1522–1535.e14 (2019). [DOI] [PubMed] [Google Scholar]
- 31.McKeon RJ, Jurynec MJ & Buck CR The chondroitin sulfate proteoglycans neurocan and phosphacan are expressed by reactive astrocytes in the chronic CNS glial scar. J. Neurosci 19, 10778–10788 (1999). [DOI] [PMC free article] [PubMed] [Google Scholar]
- 32.Schultz CC et al. Common variation in NCAN, a risk factor for bipolar disorder and schizophrenia, influences local cortical folding in schizophrenia. Psychol. Med 44, 811–820 (2014). [DOI] [PubMed] [Google Scholar]
- 33.Liddelow SA et al. Neurotoxic reactive astrocytes are induced by activated microglia. Nature 541, 481–487 (2017). [DOI] [PMC free article] [PubMed] [Google Scholar]
- 34.Richter-Landsberg C The cytoskeleton in oligodendrocytes. Microtubule dynamics in health and disease. J. Mol. Neurosci. MN 35, 55–63 (2008). [DOI] [PubMed] [Google Scholar]
- 35.Mecollari V, Nieuwenhuis B & Verhaagen J A perspective on the role of class III semaphorin signaling in central nervous system trauma. Front. Cell. Neurosci 8, (2014). [DOI] [PMC free article] [PubMed] [Google Scholar]
- 36.Wang H et al. miR-219 Cooperates with miR-338 in Myelination and Promotes Myelin Repair in the CNS. Dev. Cell 40, 566–582.e5 (2017). [DOI] [PMC free article] [PubMed] [Google Scholar]
- 37.Wang L et al. Epidermal growth factor receptor is a preferred target for treating amyloid-β-induced memory loss. Proc. Natl. Acad. Sci. U. S. A 109, 16743–16748 (2012). [DOI] [PMC free article] [PubMed] [Google Scholar]
- 38.Rothhammer V et al. Microglial control of astrocytes in response to microbial metabolites. Nature 557, 724–728 (2018). [DOI] [PMC free article] [PubMed] [Google Scholar]
- 39.Dickey CA et al. Selectively reduced expression of synaptic plasticity-related genes in amyloid precursor protein + presenilin-1 transgenic mice. J. Neurosci 23, 5219–5226 (2003). [DOI] [PMC free article] [PubMed] [Google Scholar]
- 40.Han P et al. Association of pituitary adenylate cyclase-activating polypeptide with cognitive decline in mild cognitive impairment due to Alzheimer disease. JAMA Neurol. 72, 333–339 (2015). [DOI] [PMC free article] [PubMed] [Google Scholar]
- 41.Harboe M, Torvund-Jensen J, Kjaer-Sorensen K & Laursen LS Ephrin-A1-EphA4 signaling negatively regulates myelination in the central nervous system. Glia 66, 934–950 (2018). [DOI] [PubMed] [Google Scholar]
- 42.Tozaki-Saitoh H et al. Transcription factor MafB contributes to the activation of spinal microglia underlying neuropathic pain development. Glia 67, 729–740 (2019). [DOI] [PubMed] [Google Scholar]
- 43.Zhang P et al. Senolytic therapy alleviates Aβ-associated oligodendrocyte progenitor cell senescence and cognitive deficits in an Alzheimer’s disease model. Nat. Neurosci (2019) doi: 10.1038/s41593-019-0372-9. [DOI] [PMC free article] [PubMed] [Google Scholar]
- 44.Hong S et al. Complement and microglia mediate early synapse loss in Alzheimer mouse models. Science 352, 712–716 (2016). [DOI] [PMC free article] [PubMed] [Google Scholar]
- 45.Ma J, Yee A, Brewer HB, Das S & Potter H Amyloid-associated proteins alpha 1-antichymotrypsin and apolipoprotein E promote assembly of Alzheimer beta-protein into filaments. Nature 372, 92–94 (1994). [DOI] [PubMed] [Google Scholar]
- 46.Kamboh MI, Sanghera DK, Ferrell RE & DeKosky ST APOE*4-associated Alzheimer’s disease risk is modified by alpha 1-antichymotrypsin polymorphism. Nat. Genet 10, 486–488 (1995). [DOI] [PubMed] [Google Scholar]
Additional references for online methods and supplementary material
- 47.Butler A, Hoffman P, Smibert P, Papalexi E & Satija R Integrating single-cell transcriptomic data across different conditions, technologies, and species. Nat. Biotechnol 36, 411–420 (2018). [DOI] [PMC free article] [PubMed] [Google Scholar]
- 48.Finak G et al. MAST: a flexible statistical framework for assessing transcriptional changes and characterizing heterogeneity in single-cell RNA sequencing data. Genome Biol. 16, (2015). [DOI] [PMC free article] [PubMed] [Google Scholar]
- 49.Geiss GK et al. Direct multiplexed measurement of gene expression with color-coded probe pairs. Nat. Biotechnol 26, 317–325 (2008). [DOI] [PubMed] [Google Scholar]
- 50.McAlister GC et al. MultiNotch MS3 enables accurate, sensitive, and multiplexed detection of differential expression across cancer cell line proteomes. Anal. Chem 86, 7150–7158 (2014). [DOI] [PMC free article] [PubMed] [Google Scholar]
- 51.Huttlin EL et al. A Tissue-Specific Atlas of Mouse Protein Phosphorylation and Expression. Cell 143, 1174–1189 (2010). [DOI] [PMC free article] [PubMed] [Google Scholar]
- 52.Elias JE & Gygi SP Target-decoy search strategy for mass spectrometry-based proteomics. Methods Mol. Biol. Clifton NJ 604, 55–71 (2010). [DOI] [PMC free article] [PubMed] [Google Scholar]
- 53.McAlister GC et al. Increasing the multiplexing capacity of TMTs using reporter ion isotopologues with isobaric masses. Anal. Chem 84, 7469–7478 (2012). [DOI] [PMC free article] [PubMed] [Google Scholar]
- 54.Beausoleil SA, Villén J, Gerber SA, Rush J & Gygi SP A probability-based approach for high-throughput protein phosphorylation analysis and site localization. Nat. Biotechnol 24, 1285–1292 (2006). [DOI] [PubMed] [Google Scholar]
- 55.Stine WB, Jungbauer L, Yu C & LaDu MJ Preparing synthetic Aβ in different aggregation states. Methods Mol. Biol. Clifton NJ 670, 13–32 (2011). [DOI] [PMC free article] [PubMed] [Google Scholar]
- 56.Gouwens LK et al. Aβ42 Protofibrils Interact with and Are Trafficked through Microglial-Derived Microvesicles. ACS Chem. Neurosci 9, 1416–1425 (2018). [DOI] [PubMed] [Google Scholar]
- 57.Zhou Y et al. Metascape provides a biologist-oriented resource for the analysis of systems-level datasets. Nat. Commun 10, 1523 (2019). [DOI] [PMC free article] [PubMed] [Google Scholar]
- 58.Zetterberg H, Skillbäck T, Mattsson N, Trojanowski JQ, Portelius E, Shaw LM, Weiner MW, and Blennow K (2016). Association of Cerebrospinal Fluid Neurofilament Light Concentration With Alzheimer Disease Progression. JAMA Neurol. 73, 60–67. [DOI] [PMC free article] [PubMed] [Google Scholar]
- 59.Mattsson N, Andreasson U, Zetterberg H, Blennow K, and Alzheimer’s Disease Neuroimaging Initiative (2017). Association of Plasma Neurofilament Light With Neurodegeneration in Patients With Alzheimer Disease. JAMA Neurol. 74, 557–566. [DOI] [PMC free article] [PubMed] [Google Scholar]
- 60.Craig-Schapiro R, Perrin RJ, Roe CM, Xiong C, Carter D, Cairns NJ, Mintun MA, Peskind ER, Li G, Galasko DR, et al. (2010). YKL-40: a novel prognostic fluid biomarker for preclinical Alzheimer’s disease. Biol. Psychiatry 68, 903–912. [DOI] [PMC free article] [PubMed] [Google Scholar]
- 61.Ayton S, Faux NG, and Bush AI (2015). Ferritin levels in the cerebrospinal fluid predict Alzheimer’s disease outcomes and are regulated by APOE. Nat. Commun 6, 1–9. [DOI] [PMC free article] [PubMed] [Google Scholar]
- 62.Chou C-T, Liao Y-C, Lee W-J, Wang S-J, and Fuh J-L (2016). SORL1 gene, plasma biomarkers, and the risk of Alzheimer’s disease for the Han Chinese population in Taiwan. Alzheimers Res. Ther 8, 53. [DOI] [PMC free article] [PubMed] [Google Scholar]
- 63.Guo L-H, Westerteicher C, Wang X-H, Kratzer M, Tsolakidou A, Jiang M, Grimmer T, Laws SM, Alexopoulos P, Bujo H, et al. (2012). SORL1 genetic variants and cerebrospinal fluid biomarkers of Alzheimer’s disease. Eur. Arch. Psychiatry Clin. Neurosci 262, 529–534. [DOI] [PubMed] [Google Scholar]
- 64.Forlenza OV, Diniz BS, Teixeira AL, Radanovic M, Talib LL, Rocha NP, and Gattaz WF (2015). Lower Cerebrospinal Fluid Concentration of Brain-Derived Neurotrophic Factor Predicts Progression from Mild Cognitive Impairment to Alzheimer’s Disease. Neuromolecular Med 17, 326–332. [DOI] [PubMed] [Google Scholar]
- 65.Han P, Caselli RJ, Baxter L, Serrano G, Yin J, Beach TG, Reiman EM, and Shi J (2015). Association of pituitary adenylate cyclase-activating polypeptide with cognitive decline in mild cognitive impairment due to Alzheimer disease. JAMA Neurol. 72, 333–339. [DOI] [PMC free article] [PubMed] [Google Scholar]
- 66.Varma VR, Varma S, An Y, Hohman TJ, Seddighi S, Casanova R, Beri A, Dammer EB, Seyfried NT, Pletnikova O, et al. (2017). Alpha-2 macroglobulin in Alzheimer’s disease: a marker of neuronal injury through the RCAN1 pathway. Mol. Psychiatry 22, 13–23. [DOI] [PMC free article] [PubMed] [Google Scholar]
Associated Data
This section collects any data citations, data availability statements, or supplementary materials included in this article.
Supplementary Materials
Data Availability Statement
snRNA-seq gene lists with statistics and NanoString nCounter gene lists are available as Supplementary Tables 1,4,5 accompanying this article. Mouse snRNA-seq data that support the findings of this study have been deposited in the Gene Expression Omnibus (GEO) database with accession number XXX. Human snRNA-seq data that support the findings of this study have been deposited to Synapse (https://www.synapse.org/#!Synapse:syn21125841/wiki/). All requests for human snRNA-seq data are promptly reviewed by Rush Alzheimer’s Disease Center at Rush University, ADRC at Washington University and the BRI at Niigata University to verify if the request is subject to any intellectual property or confidentiality obligations. Any data and materials that can be shared will be released via a Material Transfer Agreement upon reasonable requests. Please contact the corresponding authors for additional information.


