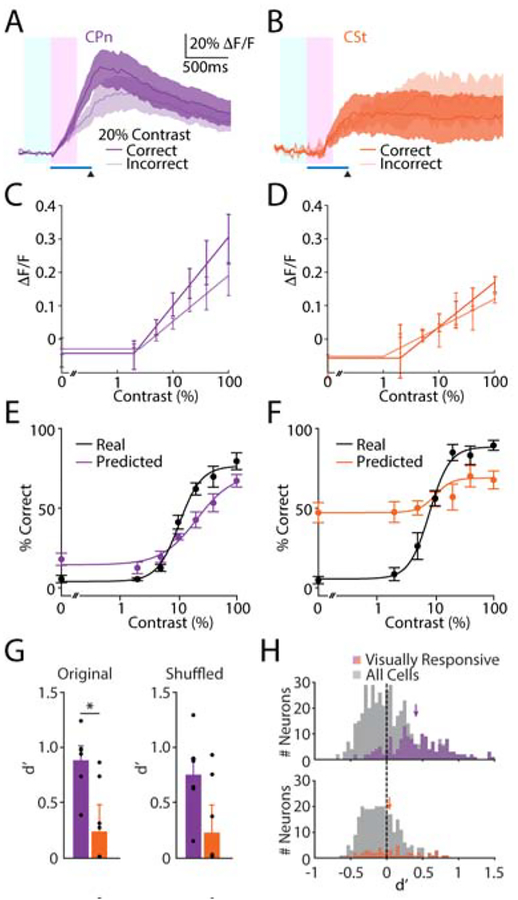
Figure 4. Behavior is selectively encoded by activity in CPn neurons.
(A-B) Averaged visual responses at 20% contrast for 159 CPn neurons in 6 mice (A) and 51 CSt neurons in 6 mice (B) separated by correct (dark) and incorrect (light) trials. Timing of visual stimulus (blue bar) and air puff (arrowhead), and analysis windows (baseline, light blue; response, pink) are shown. Lines and shadings represent average ± SEM over animals.
(C) Population contrast-dependent response magnitudes for CPn neurons (n=6 mice) separated by correct (dark) and incorrect (light) trials. Dots and error bars represent average ± SEM over mice. CPn Slope-Correct 0.16, Slope-Incorrect 0.10; p=0.0004, Permutation Test.
(D) As in (C) for CSt neurons (n=6 mice). CSt Slope-Correct 0.12, Slope-Incorrect 0.09; p=0.14, Permutation Test.
(E-F) Real (black) and predicted (purple/orange) contrast-dependent behavior based on CPn responses (E) and CSt responses (F). Dots and error bars represent average ± SEM over mice.
(G) Discriminability (d’) for the ensemble decoders using CPn (purple, n= 6 mice) or CSt (orange, n= 6 mice) responses on original data (acquired simultaneously, left) or trial shuffled data (right). Bars represent average ± SEM over mice. CPn original trials d’ 0.88±0.12, CSt original trials d’ 0.24±0.24; p=0.026, Mann-Whitney U Test. CPn shuffled trials d’ 0.75±0.16, CSt shuffled trials d’ 0.22±0.25; p=0.18, Mann-Whitney U Test.
(H) Histograms illustrating the distribution of d’ values for single visually-responsive CPn (purple, top) or CSt (orange, bottom) neurons, mean values indicated by arrows. CPn average d’ 0.43±0.03, chance d’ −0.01±0.001, n=159 cells; p<0.0001, one-sided t-test. CSt average d’ 0.09±0.05, chance d’ −0.02±0.002, n=51 cells; p=0.088, one-sided t-test. CPn vs. CSt, p<0.0001, t-test. d’ values for all CPn (top) and CSt (bottom) neurons are shown in gray.

