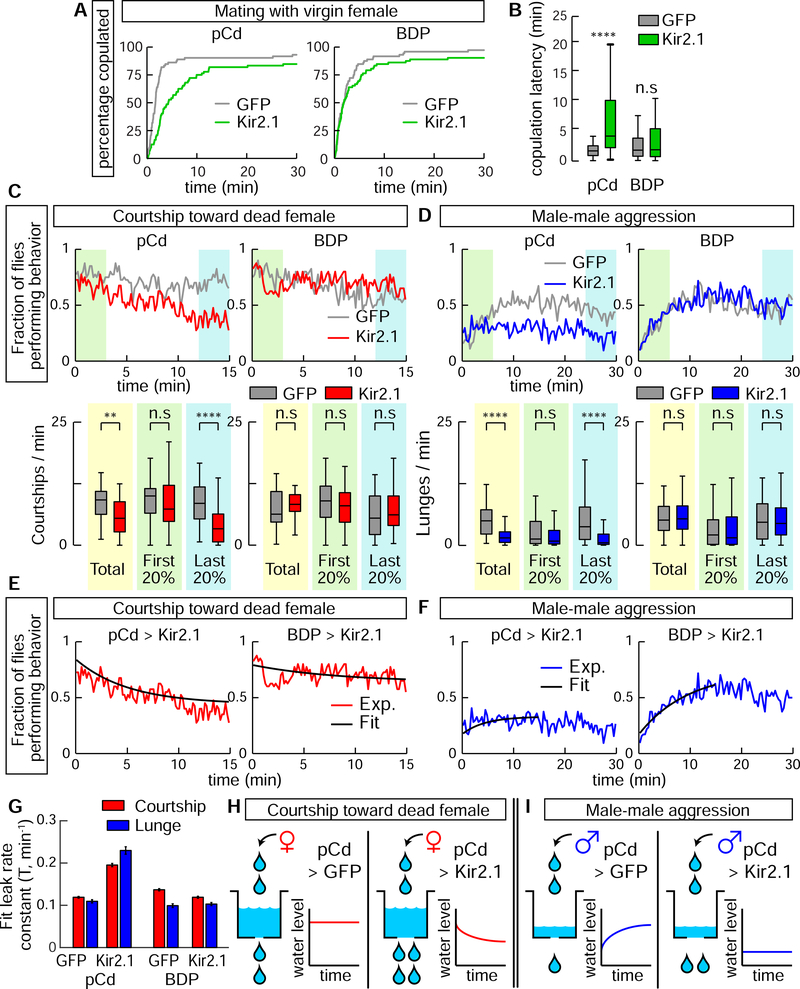
Figure 4. Inhibition of pCd neurons increases copulation latency and reduces endurance of naturally occurring social behaviors.
(A) Individual males of the indicated genotypes were paired with a live wild-type virgin female. Cumulative percentage of flies that copulated over 30 min is shown. (B) Quantification and statistical tests for copulation latency. **** P < 0.0001 for between-genotype comparisons (Mann-Whitney U-test). (C) Solitary male flies were incubated with a dead female and courtship (unilateral wing extension bouts, UWEs) measured over 15 min. Left panels show experimental (pCd>Kir2.1, red line) and responder control (UAS-GFP, grey line) flies, right panels show enhancerless driver controls (BDP-Gal4; red and grey lines). Upper: fraction of flies performing behavior in 10 s time bins. Lower: number of UWE bouts per min per fly over entire 15 min observation (yellow shading), first (green shading) and last (blue shading) 20% (3 min) of the interval. n=40 flies per genotype. ** P < 0.01, **** P < 0.0001. (D) Pairs of single-housed males monitored over 30 min. Plot properties and statistical tests same as in (C), except blue color indicates lunging. Fraction of flies performing behavior was binned in 20 s time intervals. n=64 flies per genotypes. (E, F) Curve fitting of (E) courtship data from (C), or (F) lunging data from (D). Black lines show exponential fit curve for each experiment. Goodness of fit (MSE): courtship; 0.0042 (pCd>GFP), 0.0051 (pCd>Kir2.1), 0.0056 (BDP>GFP), 0.0058 (BDP>Kir2.1); Aggression; 0.0028 (pCd>GFP), 0.0031 (pCd>Kir2.1), 0.0045 (BDP>GFP), 0.0029 (BDP>Kir2.1). (G) Leak rate constants derived from curve fitting in (E, F); note that both courtship and lunging in pCd>Kir2.1 flies are best fit by assuming increased leak constants, relative to genetic controls. (H, I) Illustration of modeling results. Water level represents level of activity in a hypothetical leaky integrator driving behavior (Lorenz and Leyhausen, 1973). Inhibition of pCd activity with Kir2.1 increases leak rate constant of the integrator.

