Abstract
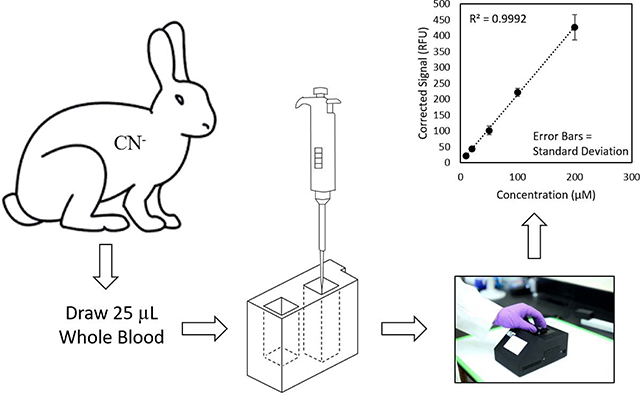
Cyanide (both HCN and CN− are represented by CN) has multiple industrial applications, is commonly found in some foods, and is a component of fire smoke. Upon exposure, CN blocks production of adenosine triphosphate, causing cellular hypoxia and cytotoxic anoxia, which can eventually result in death. Considering CN’s quick onset of action and the long analysis times associated with current techniques, this study focused on the development and validation of a rapid and field-portable sensor to detect blood CN concentrations focusing on both concentration and diagnostic accuracy. The sensor takes advantage of the chemical properties of CN by converting it exclusively to HCN via acidification of whole blood. High-speed headspace transfer is used to deliver HCN to a capture solution where it is reacted with naphthalene dialdehyde and taurine to produce a fluorescent β-isoindole product. Simple spectrofluorometric analysis of the product provides quantitative analysis of CN from whole blood in 60 s and requires only 25 μL of blood (obtainable via fingerstick). A limit of detection of 5 μM, a linear range of 10–200 μM (with ≥ 15 μM considered CN exposed), and excellent accuracy (100 ± 15%) and precision (≤ 15.2% relative standard deviation) were obtained. To evaluate the diagnostic accuracy of the sensor, rabbit blood (N = 205, including 25 blinded samples) was analyzed by both the sensor and a lab-based spectrophotometric method. An excellent positive correlation was obtained between the sensor and the lab-based spectrophotometric method (R2 > 0.995) confirming the concentration accuracy of the CN sensor. Moreover, the sensor produced no false positives or negatives when diagnosing CN poisoning.
Keywords: Acidification, Validation, Sensor, Spectrophotometry, LOD
Graphical Abstract
Introduction
Cyanide (HCN and CN−, inclusively represented as CN) is well-known for its use as a poison. It is also commonly used in various industrial processes including mining, electroplating, and synthetic fiber production [1]. Exposure to CN occurs via multiple sources, such as ingestion of edible plants (e.g., cassava), poisoning, and/or accidental exposure from industrial activities.[1–5] Fire and tobacco smoke are also other common sources of CN exposure and can lead to high CN levels in the blood [6]. Although CN is a major component of fire smoke and could be responsible for a substantial percentage of smoke inhalation deaths [7, 8], CN blood concentrations are currently not typically evaluated for smoke inhalation victims.
Upon exposure, CN inhibits cytochrome oxidase by binding the Fe3+ atom in heme A3, resulting in hypoxia, potentially leading to death [9–13]. Blood CN concentrations of 19 μM are considered toxic, whereas concentrations greater than 115 μM could be fatal [14]. Death can be observed within minutes depending upon the level and route of CN exposure [7, 8]. Although antidotes for CN exposure exists (methemoglobin generators, sulfur donors, and direct binding agents) [15], they each have disadvantages (inherent toxicity, large dose, delayed onset of action, and dependence on enzymes generally confined to specific organs) [15–18] that make knowledge of blood CN concentrations useful.
Over the past several decades, a variety of analytical techniques, based on fluorescence, have been developed for the determination of CN levels [19–24]. Although some of these fluorometric techniques have produced good analytical characteristics, most have low accuracies and are not amendable to rapid and field portable analysis of blood CN [25]. Therefore, despite the risks associated with CN exposure and its quick onset of action, current methods for determining blood CN levels are too cumbersome, time-consuming, and sophisticated to inform effective antidote administration or health monitoring.
Considering the quick onset of CN toxicity and the lack of a robust, fast, and portable CN diagnostic, the goal of this study was to develop a fast, reliable, and field-portable blood CN sensor and verify its usefulness for the determination of CN concentrations in blood. Specifically, a field-portable and rapid sensor for the quantification of CN concentrations in blood was developed, its concentration accuracy was validated with lab-based UV-Vis and GC-MS methods, and animal studies were performed to verify the ability of the sensor to accurately determine blood-CN levels following CN poisoning including differentiation between CN-exposed and “non-exposed” animals.
Materials and methods
Materials
All solvents used were HPLC grade unless otherwise stated. Sodium hydroxide (NaOH), sulfuric acid (H2SO4), sodium cyanide (NaCN), potassium dihydrogen phosphate (KH2PO4), and dibasic potassium phosphate (K2HPO4), were purchased from Fisher Scientific (Hanover Park, IL). 2,3-Naphthalene dialdehyde (NDA) was obtained from TCI America (Portland, OR). 2-aminoethane sulfonic acid (taurine) and sodium metaborate tetrahydrate (NaBO24H2O) were purchased from Alfa Aesar (Ward Hill, MA). Tetra butyl ammonium sulfate (TBAS) and 2,3,4,5,6-pentaflorobenzyl bromide (PFB-Br) were purchased from Sigma-Aldrich (St. Louis, MO) and Alfa Aesar (Haverhill, MA), respectively.
Phosphate borate buffer (0.05 M; pH 8.5) and NaOH (10 and 100 mM) were prepared in deionized water. H2SO4 (2 M) was diluted with 3.89:5 mL v/v DI water and ethanol. PFB-Br (20 mM) was prepared in ethyl acetate while 10 mM TBAS was diluted with a saturated solution of sodium tetraborate decahydrate (pH 9.5). A stock solution of NaCN was obtained by diluting a 1.8 mM solution (in 10 mM NaOH) with 10 mM aqueous NaOH. An NDA (2 mM) stock solution was prepared in 0.05 M phosphate borate buffer and 40% methanol. A taurine (0.1 M) solution was prepared in phosphate borate buffer. Hydroxoaquocobinamide was obtained from Dr. Gerry Boss, MD (Department of Medicine, University of California, San Diego, La Jolla, USA).
Caution
CN is poisonous to humans and animals. Therefore, CN solids and solutions must be handled with care. All CN solutions were handled in a hood and prepared as basic aqueous solutions (10 mM NaOH) to ensure CN remained as non-volatile CN−.
Sample collection, storage and preparation
For analytical method development, rabbit whole blood, with EDTA as anti-coagulant, was purchased from Pel-Freez (Arkansas, USA) and stored at −80 °C until analysis. Additionally, New Zealand White rabbits (3.5–4.5 kg) were exposed to CN at the University of California, Irvine (UCI), and whole blood was drawn at different time points following exposure. Rabbits (N = 30) were infused intravenously with 20 mg of NaCN in 60 mL of 0.9% NaCl at a continuous rate of 1 mL/min until apnea. Blood samples were drawn prior to CN exposure as “non-CN-exposed” animals. Blood samples were also drawn at 15, 25, 35 min following CN exposure for all rabbits, and at apnea and 5 min post-apnea when an antidote was not administered. The blood samples were collected in clean centrifuge tubes with EDTA anticoagulant, flash frozen, and shipped on dry ice (overnight) to South Dakota State University (SDSU) for CN analysis. The samples (N = 205 total) were stored at −80 °C until analysis.
All animals were cared for in compliance with the “Principles of Laboratory Animal Care” formulated by National Society for Medical Research and the “Guide for the Care and Use of Laboratory Animals” prepared by the National Institutes of Health. The CN exposure study was approved by UCI’s Institutional Animal Care and Use Committee (IACUC).
Cyanide sensor
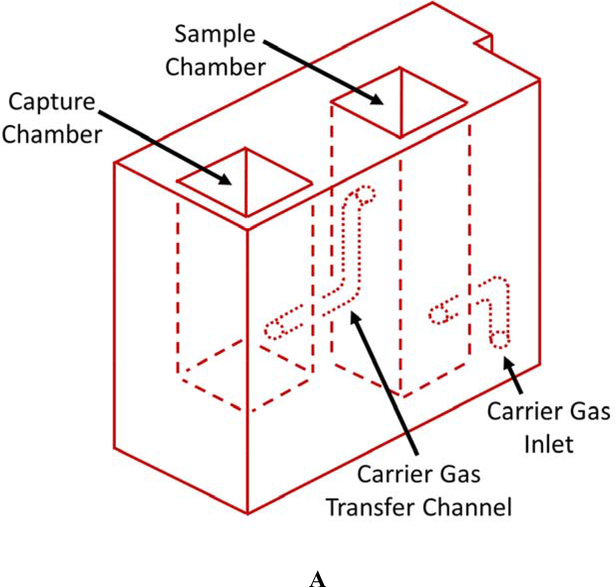
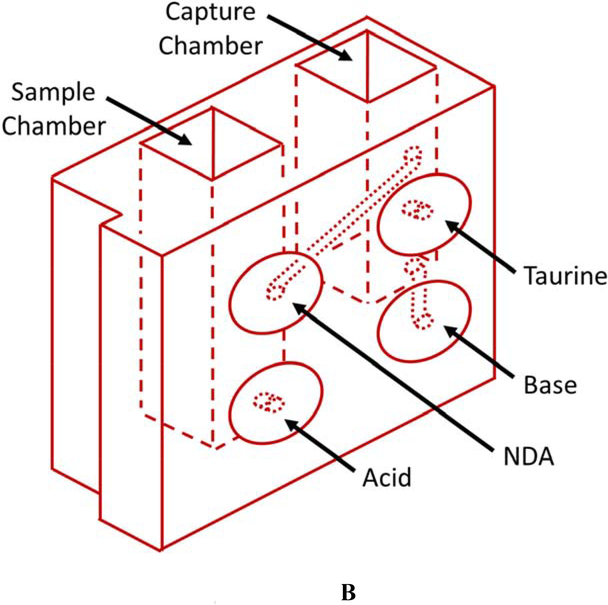
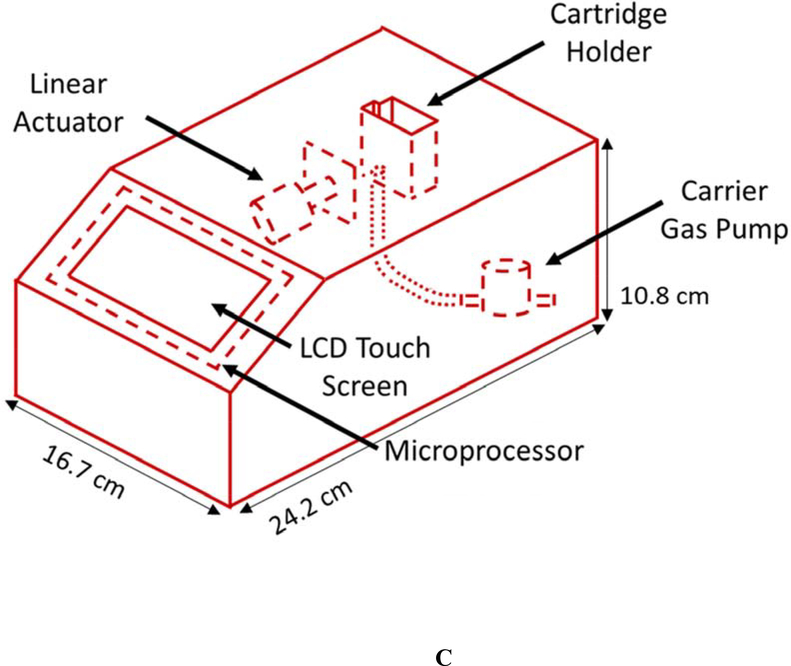
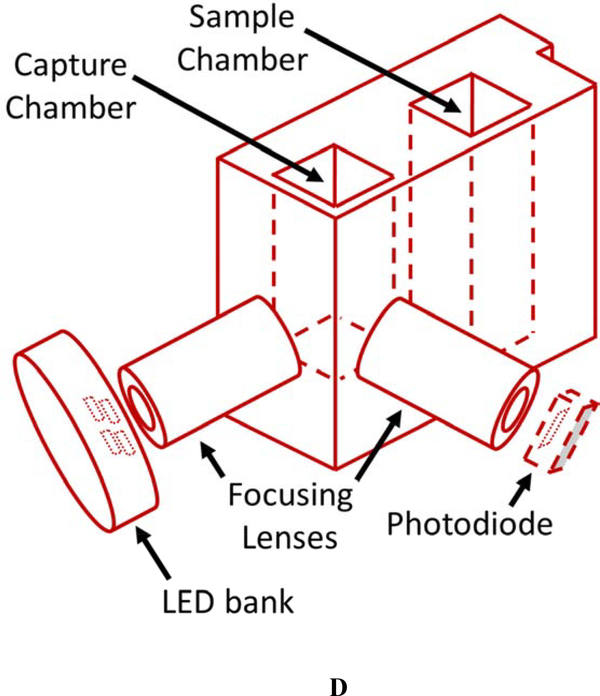
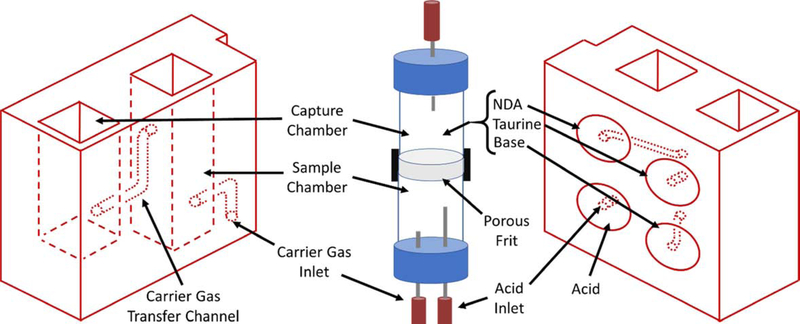
The current CN sensor prototype (Figure 1) consists of two components: 1) the sample preparation cartridge (Figures 1A and B) and 2) the detection system (Figures 1C and D). The sample preparation cartridge is a self-contained unit which is disposable after analysis. The reagent storage portion of the sample preparation cartridge (Figure 1B) houses aqueous acid, base, NDA, and taurine solutions which are used for CN liberation, capture, and fluorescence. The detection system consists of microelectric components for controlling the operation of the sensor (i.e., an interactive LCD screen and programmable circuit board), a carrier gas pump (5 V), and a linear actuator (Figure 1C), a 410-nm high-powered LED and a 400–650 nm light sensitive photodiode (PD) (Figure 1D).
Figure 1.
Schematics of the sample preparation cartridge and fluorescence detection system for the analysis of CN in blood. A) The sample preparation cartridge “front” view highlighting carrier gas channels, the sample chamber and the capture chamber. B) The sample preparation cartridge “back” view highlighting the reagent storage “bubbles,” the reagent flow channels, the sample chamber and the capture chamber. C) The fluorescence detection system highlighting the sample preparation cartridge holder, the carrier gas pump, the linear actuator for depression of the reagent bubbles, the touch screen, and the microprocessor. D) The sample preparation cartridge showing the position of the optical components for fluorometric analysis of the CN-NDA-taurine complex.
Sample preparation and analysis using the cyanide sensor
Each individual whole blood sample was prepared for CN analysis with a single, disposable sample preparation cartridge (Figures 1A & B). The sample cartridges use an elegant sample preparation technique called microdiffusion. During microdiffusion, CN is liberated from the biological matrix by acidification, transferred from the sample chamber to the capture chamber using ambient air as carrier gas, and captured in a basic aqueous solution (Figure 1A). NDA and taurine are added to the capture chamber and these components react with CN to form a fluorescent β-isoindole product. The reagents used to produce the fluorescent β-isoindole product were reported elsewhere to be stable [26]. The detailed sample analysis steps consist of: 1) whole blood (25 μL) is placed in the sample chamber (L × B × H: 0.915 × 0.915 × 3.168 cm; total volume allowed: 3.2 mL) of the sample preparation cartridge, diluted with 80 μL of deionized water, the sample chamber is capped and the sample preparation cartridge is inserted into the cartridge holder of the CN sensor (Figure 1C); 2) acid is delivered to the sample chamber to convert CN− in the blood to HCN(g) and NDA, taurine, and base are delivered to the capture chamber (L × B × H: 0.915 × 0.915 × 2.285 cm; total volume allowed: 2.3 mL) via depression of the reagent storage bubbles by a linear actuator (Figure 1C) [27, 28]; 3) carrier gas (approximately 200 mL/min of ambient air for 34 s) is pumped through the sample chamber into the capture chamber to transfer HCN(g) to the capture solution (Figure 1A); 4) air is forced in small “bursts” through the capture solution to mix the fluorometric reagents and aid in the formation of the CN-NDA-taurine complex; and 5) the fluorescent complex is then irradiated with a high-powered LED (λ = 410 nm) directed through a focusing lens into the sample and the fluorescence of the CN-NDA-taurine product is measured (400–650 nm) (Figure 1D) to quantify the CN concentration and determine CN “exposure” (i.e. ≥ 15 μM). Steps 2–5 are automated and initiated by the user by pushing a button.
Spectrophotometric cyanide analysis
Whole blood (250 μL) was pipetted into a labelled 20-mL headspace vial and diluted with 250 μL of deionized water. The diluted blood was swirled gently. A smaller glass vial (2 mL) was inserted into the headspace vial (containing the diluted blood), hydroxoaquocobinamide (110 μL of 160 μM) was pipetted into the 2-mL vial, and the headspace vial was tightly capped. A syringe, with a 26 G needle, was used to deliver 500 μL of 0.5 M H2SO4 (through the septum) to the diluted blood. The solution in the headspace vial was swirled gently to mix and the capped vial was left overnight (12–18 hrs) in a fume hood to allow passive microdiffusion of CN from the blood sample into the cobinamide solution. The headspace vial was uncapped and 100 μL of the cobinamide solution was transferred into a separately labelled 4-mL glass vial. NaOH (1900 μL of 0.1 M) was added and the vial was capped tightly. The solution was mixed and the diluted cobinamide (1900 μL) was transferred into a cuvette. The absorbance of Cbi(CN)2 was obtained using a Jasco UV-Vis spectrophotometer (V-780, JASCO Corporation, Japan) at a wavelength of 366 nm.
GC-MS analysis of CN
To validate the accuracy of the UV-Vis Cbi method, the GC-MS method described by Bhandari et al. [29], with slight modification, was used to confirm blood CN concentrations. Briefly, whole blood (150 μL) was pipetted into a centrifuge tube. The sample was then spiked with 100 μL of internal standard (50 μM Na13C15N) and mixed. Following the internal standard addition, TBAS (800 μL of 10 mM in a saturated solution of sodium tetraborate decahydrate, pH 9.5) and PFB-Br (500 μL of 20 mM in ethyl acetate) were added. The mixture was vortexed for 2 min and heated at 70°C for 1 hr. The mixture was then centrifuged at 10,000 rpm (9,300 × g) for 4 min at room temperature. The supernatant (200 μL) was transferred into GC vial for analysis. The derivatized CN, PFB-CN, was analyzed using a gas chromatograph coupled with a mass selective detector (Agilent 6890N with 5975B MSD) according to the Bhandari et al. [29] method except hydrogen gas was used as the carrier gas.
Calibration, Quantification, Recovery, and Limits of Detection
Cyanide sensor
The limit of detection (LOD) was calculated based on the analyte concentration that produced a signal equal to the sum of the average blank signal and 3 times the standard deviation of the blank (sblank). The lower limit of quantification (LLOQ) was calculated based on the same formula but 10 times sblank. The upper limit of quantification (ULOQ) was determined based on the highest analyte concentration that produced a measured concentration that was within 20% of the nominal concentration as a measure of accuracy with a precision of ≤ 20% RSD. Calibration of the sensor was performed using five concentrations of CN (10, 20, 50, 100, and 200 μM NaCN) and a blank. The calibration equation (with intercept set to zero), obtained from linear least-squares analysis, was used to calculate the equation of the line. Percent Residual Accuracy (%RA) [30] and the coefficient of determination (R2) were used to determine the goodness-of-fit. Calibration standards were prepared in triplicates in rabbit whole blood purchased from Pel-Freez. The quality control (QC) standard concentrations were 15, 60, and 150 μM. For the recovery test, 30 μM CN was spiked into the capture chamber in an amount equivalent to that of CN spiked aqueous and blood samples to produce the signal generated by 100% recovery. The fluorescence signals of these cartridges were compared to spiked standards analyzed by the sensor to determine CN recovery. Analysis was completed in triplicate and repeated on a second day to ensure results were reproducible.
UV-Vis method
The same methods were used to determine the LOD and LLOQ as with the CN sensor. Stock solutions of CN (200 mM) were prepared in rabbit blood and were further diluted with rabbit blood to prepare the calibration standards (10, 20, 35, 50, and 70 μM) and QC standards (15, 30, and 60 μM). The calibration standards and QC standards were prepared in triplicates and the concentration of CN in each sample was obtained via the equation of the line in the form y = mx + b, using a linear least-squares fit.
GC-MS method
The calibration curve for the GC-MS method was created using the signal ratio (analyte: internal standard) for calibration concentrations of 10, 20, 50, 100, and 200 μM CN. The standard solutions for the calibration curves were prepared in rabbit blood to minimize differences between standards and samples. Three QC standards (low (15 μM), medium (60 μM), and high (150 μM)) were prepared in rabbit blood and analyzed in triplicate. Intraassay precision and accuracy were calculated from each days’ analysis, and interassay precision and accuracy were calculated from the comparison of the data obtained from three separate days.
Data analysis
All statistical analyses were performed using JMP Statistical software (SAS Institute). The data obtained from the CN sensor, GC-MS analysis, and UV-Vis analysis were compared using Tukey test. Kolmogorov-Smirnoff and Shapiro-Wilks tests were used to determine the normality of data and showed a normal distribution (p > 0.05) of the data for pre-exposure and each exposure time.
Results and discussion
CN sensor development
The current sensor was developed by substantially modifying and extending the technology proposed by Jackson et al. [26]. Table 1 summarizes the most significant changes between the current cyanide sensor and the Jackson et al. design. Most importantly, the analysis time and required sample volume were reduced to 60 s and 25 μL, respectively. Because this volume of blood can now be comfortably obtained through a single finger-stick, and the analysis time was reduced from 3 min to 60 s, the current sensor is more amenable for use in mass casualty situations. Moreover, the disposable, single-use, and self-contained (i.e., reagents are stored and delivered via the sample cartridge) design of the sample cartridge requires less time prior to and between analyses. The sensor itself is also more portable because external computer control was replaced with touch screen control. Lastly, the shape of the capture chamber (cylinder vs. square cylinder) allowed less scatter of the incident excitation light, producing better sensitivity, and allowing the reduced analysis time.
Table 1.
Major differences between the current cyanide sensor and a previously developed sensor by Jackson et al. [26]
| Sensor Property | Previously developed CN sensor | Current sensor |
|---|---|---|
| Analysis time | 180 s | 60 s |
| Sample volume | 50–100 μL | 25 μL |
| Sampling preparation apparatus reuse | Reusable but difficult to wash and sterilize | Single-use, disposable cartridge |
| Sample and capture chamber dimensions | Cylindrical; 0.8 cm internal diameter × 5 cm long for capture and sample chambers | Square cylinder; 0.915 × 0.915 × 2.285 cm capture chamber, 0.915 × 0.915 × 3.168 cm sample chamber |
| Reagent storage and delivery | Reagents stored separate from sensor or sample preparation apparatus, introduced via syringes | Reagents stored in the cartridge, introduced through depression of reagent “bubbles” |
| Air addition | Large syringe depressed and reset via linear actuator | Small air pump (approximately 1 cm dia.) |
| Microprocessor control and signal display | External computer | Integrated touch screen |
| Sensor dimensions (L × W × H) | 15 × 20 × 30 cm | 24.2 × 16.7 × 10.8 cm |
The sample cartridge presented here (Figure 1A & B) was designed to allow microdiffusion and fluorescence analysis of CN while maintaining stringent requirements for quickly and accurately quantifying biologically relevant blood CN concentrations. Figure 2 details most of the significant design changes from the previous sample preparation configuration. The current sample preparation cartridge differs in the positioning, size, and shape of the chambers. The previously designed sample preparation apparatus consisted of stacked sample and capture chambers separated by a porous frit, whereas the current sample preparation cartridge positioning consists of the sample chamber adjacent to the capture chamber. This positioning allows a more practical size and shape for the cartridge. The vials of the previous design were replaced with rectangular cylinders, similar to cuvettes. This change produced less scatter of the irradiated and fluoresced light, allowing better sensitivity for short reaction times. The size of the capture chamber was reduced in order to concentrate CN in the capture chamber allowing for more fluorescence at the 60 s analysis time. Particular attention was paid to optimize air flow reagent addition, reagent storage, and chamber dimensions. Optimization of air flow was very important to ensure high recoveries of CN. The design of the reagent storage and delivery system was also critical since the integrity of the reagents and delivery of the correct volume of reagent to the respective chamber in the microdiffusion unit must be ensured for accurate quantification of CN blood concentrations and diagnosis of CN exposure. Other issues the current sample cartridge addressed were the analysis time (i.e. the initial design required several minutes to setup and 3 min of analysis time), ease of preparation (i.e. the previous sensor needed addition of solutions ahead of time), inconsistent air flow rates (i.e. air flow needed to carry CN through the frit to the capture chamber), and “foaming” of the capture solution, previously requiring relatively slow carrier gas flow rates.
Figure 2.
Summary of the changes to the sample preparation apparatus from Jackson et al. [26] to the current sample preparation cartridge. The fundamental design, reagent storage and addition, carrier gas pathway and separation of the sample and capture chambers are the main differences between the designs.
For field analysis, the CN sensor must be portable. The previous CN sensor dimensions were 15 × 20 × 30 cm (L × W × H) [26]. While this design was portable, the current design is more compact (24.2 × 16.7 × 10.8 cm (L × W × H)). Moreover, the previous sample preparation apparatus was reusable but had to be cleaned between analyses. The current cartridge is disposable and single use. This was vital to eliminate carryover and ensure biological hazards were minimized. The previous sensor housed an acid reservoir and solution addition for each sample was done prior to analysis, causing signal variabilities. Meanwhile, the current sensor design is more automated and robust, reagents are stored in bubble within the cartridge (Figure 2B) and are simultaneously depressed for sample analysis using a linear actuator in the sensor (Figure 1C).
The detection system in the currently designed and developed sensor is generally similar to that detailed in Jackson et al. [26], but optimization of the sensor was completed by optimizing the air pump system and air flow rate, optimizing the optics (i.e., the LED/PD pair, pathlength, focusing lenses, etc.) and development of the electronic components including the microcontroller and display. The most significant change from the previously developed sensor was conversion of a USB2000+ spectrophotometer, with required connection to a computer to capture the fluorescence signal, to fluorescence signal analysis via an LED/PD pair (Figure 1D), with no requirement for attachment to a computer.
CN sensor analytical performance
The LOD for the current CN sensor was 5 μM. Even though this was higher than reported for the Jackson et al. [26] sensor, the analysis took three times as long as the current sensor (60 s). The average R2 for the calibration curves generated by the current sensor was 0.9981 (ranging from 0.9927 to 1). The %RA ranged from 91.5 to 99.7, indicating an excellent linear fit for all calibration curves. The calculated accuracies (93.4 – 106%) and average precision (9.41%) for calibrators and samples were excellent. During the 3-day validation, the accuracies and precision for the quality control samples were 100 ± 20% and ≤ 20%, respectively.
Sensor analysis of blood CN concentrations
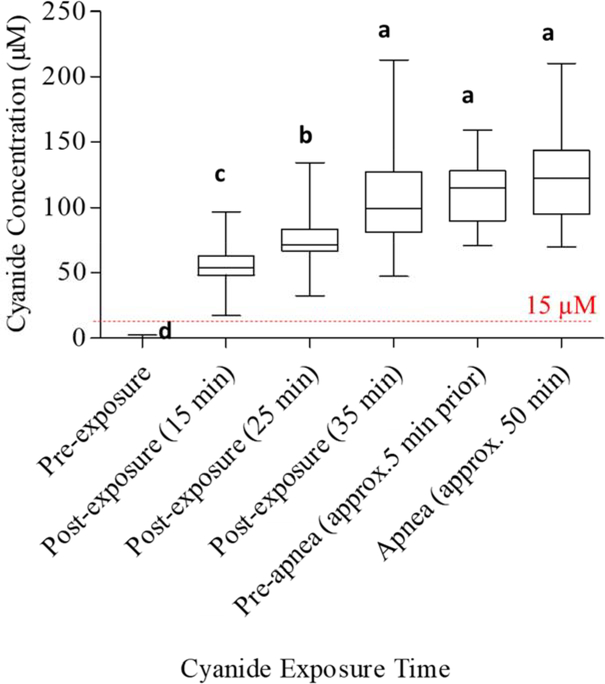
The developed CN sensor was used to determine blood CN concentrations of rabbits intravenously exposed to CN. The average concentration of CN significantly increased (p < 0.05) with exposure time and was also significantly above the baseline concentration (Figure 3). This trend was expected because as CN infusion continues, blood CN concentrations should increase. Bhandari et al. [12] and Gyamfi et al. [31] also observed blood and plasma CN and 2-aminothiazoline-4-oxoaminoethanioc acid (a CN metabolite) concentrations exhibiting a linear response to increasing doses of CN using fluorometric and LC-MS/MS techniques, respectively. As shown in Figure 3, there was no significant difference (p > 0.05) between CN concentrations at 35 min post-exposure, 5 min before apnea, and apnea (approx. 50 min).
Figure 3.
Concentrations of CN in rabbit blood, at different CN exposure times, measured with the cyanide sensor. Different letters a, b, c, and d indicate statistically significant differences (p < 0.05).
CN concentrations obtained with the CN sensor for all the post-exposure samples (N = 205) were above the concentration limit corresponding to CN exposure (i.e. ≥ 15 μM) (Figure 3). Moreover, all pre-exposure samples (baseline) were below this cutoff concentration. According to study by Jackson et al., rabbit blood drawn at 15, 25, and 35 min post-CN exposure produced average CN concentrations of 35.6, 49.7, and 74.6 μM, respectively [26]. Similarly, Bhandari et al. [12] reported a maximum CN plasma concentration of 14.7 μM upon exposing rabbits to CN (10 mg of NaCN dissolved in 60 mL of 0.9% NaCl). The CN concentrations in the present study ranged from 55.6 ± 15.7 (15 min post CN exposure) to 105 ± 36.6 μM (35 min post-exposure). The variability (%RSD of 2.85–15.2%) for blood from exposed rabbits is likely be attributed to differences in physiological characteristics of the individual rabbits, including body weight and levels of rhodanese present [26]. As shown in Figure 3, blood CN concentrations increased significantly upon CN exposure to a maximum average of 123 ± 35.1 μM at 50 min post-CN exposure. A comparable trend was reported by Bhandari et al., for subcutaneous injection of CN (6 mg/kg) in rats, where CN concentrations increased for 30 min, after exposure, before rapidly declining due to distribution and metabolism of CN [12].
Validation of the sensor with lab-based CN analysis
The UV-Vis technique was used to verify the concentrations of CN obtained from the sensor and the Bhandari et al. [29] GC-MS method was used to verify the concentration accuracy of the UV-Vis method. The LOD for the UV-Vis method was 5 μM. For the calibration standards, the percent accuracy ranged from 85.7 to 110%, while the average precision was 8.88%. Calibration of the UV-Vis method for CN was linear, with R2 averaging of 0.995.
Using the GC-MS technique, the average R2 and %RA for the calibration curves, in rabbit blood, were greater or equal to 0.9992 and 93.6%, respectively. Intraassay and interassay precision ranged from 2–13% with the accuracy ranging from 90–114%. The precision and accuracies of QC samples were less or equal to 12% and 92–111%, respectively.
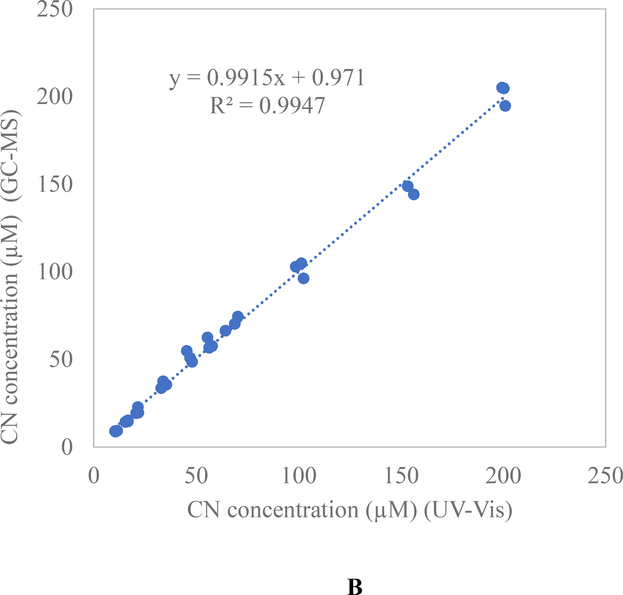
Comparison of the spectrophotometric (UV-Vis) and CN sensor methods produced an average R2 of 0.9912 (ranging from 0.9856 to 0.9999) (Figure 4A). When the GC-MS and UV-Vis methods were compared, an excellent positive correlation was obtained (R2 = 0.9947; p = 0.1164) (Figure 4B). The results obtained from the GC-MS and UV-Vis methods and their strong agreement with that of the sensor confirms the ability of then CN sensor to accurately quantify CN concentrations from whole blood in the range indicative of exposure.
Figure 4.
Validation of concentration accuracy between the cyanide sensor, UV-Vis technique (validated in this study) and a previously validated and peer-reviewed GC-MS analysis technique [29]. A) Correlation between the CN sensor and UV-Vis laboratory techniques for determining blood CN concentrations. B) Correlation between the GC-MS and UV-Vis techniques for quantification of blood CN concentrations.
Analysis of blinded rabbit blood using the cyanide sensor
To ensure bias was not skewing the analysis of CN, blinded rabbit blood samples (N = 5 pre-exposure; 19 post-exposure) were analyzed and the exposure status of the rabbits was not revealed until analysis was complete and the results were reported to UCI. The calculated CN concentrations, using both the CN sensor and UV-Vis techniques, were sent to UCI for confirmation. The sensor was 100% accurate in identifying the CN exposure status of the rabbits.
Conclusions
Considering the quick onset of CN toxicity, a rapid and portable CN sensor was developed for the quantification of blood CN. Spectrophotometric (UV-Vis) and GC-MS methods were used to verify the concentration accuracy of the CN sensor. Moreover, the sensor produced 100% diagnostic accuracy, producing no false positives or negatives. Validation showed that the sensor met or surpassed all the desired criteria for a blood CN sensor (Table 2). The sensor is promising as a rapid, portable, accurate, and robust method for field use in pre-hospital setting and continued development should provide a CN diagnostic or health monitoring device for those at risk of CN exposure (e.g., fire fighters). This CN diagnostic would represent a leap forward in the management of CN poisoning.
Table 2.
Desired characteristics of a cyanide exposure diagnostic and the current performance of the sensor technology.
| Sensor Parameter | Desired Value | Cyanide sensor |
|---|---|---|
| Diagnostic Accuracy* | ≥ 99% | 100% (N = 205 samples; 35 non-exposed, 35 rabbits, including 5 blinded) |
| Analysis Time* | ≤ 60 s | 60 s |
| Detection Limit at Biol. Relevant Conc.* | ≤ 10 μM | 5 μM |
| Size* | Handheld | ✓ |
| Precision | ≤ 20% RSD | ≤ 8% RSD |
| Accuracy | 100 ± 20% | 100 ± 12% |
| Sample Volume | ≤ 50 μL | 25 μL |
| Cyanide Recovery | > 75% | 75% (aq); 55% (blood) |
| Linear Range | At least 15–75** μM | 10–200 μM |
| Interferents | None | None Known |
| Reagent Stability | Months | ≥ 70 days |
| Sample Prep and Fluorometric Analysis | Automated | Single button push |
| Rapid Calibration | ≤ 6-point calibration | 6-point or 2-point calibration |
Considered the most important parameters for a cyanide diagnostic.
From 1.5x the highest blood concentration recorded for smokers (10 μM) to 2x the dose considered to be “potentially lethal” (37 μM).
Highlights.
A rapid and field-portable sensor was developed for blood cyanide (CN) analyses
The sensor analyzes blood CN concentrations within 60 s requiring 25 μL of blood
Exposed and non-exposed rabbit blood (N = 205) were analyzed with the CN sensor
The sensor produced 100% diagnostic accuracy with no false positives or negatives
The CN sensor was validated using lab-based spectrophotometric and GC-MS methods
Acknowledgements
Research reported in this publication was supported by the CounterACT Program, supported by the office of Neurological Disorders and Stroke (NINDS) of the National Institutes of Health under award number R44NS97066-01A1, the Sanford Seed Grant, and by the Sanford Health - South Dakota State University Collaborative Research program and by the SD Board of Regents R&D Innovation program. The content is solely the responsibility of the authors and does not necessarily represent the official views of the NIH, the State of South Dakota, the State of California, MRI Global, or Seacoast Science, Inc.
Footnotes
Conflicts of Interest
The authors declare no conflict of interest.
References
- [1].Stewart CJNYMB, Cyanide as a Chemical Weapon: A Review, (2006) 3. [Google Scholar]
- [2].Baskin SI, Petrikovics I, Platoff GE, Rockwood GA, Logue BA, Spectrophotometric analysis of the cyanide metabolite 2-aminothiazoline-4-carboxylic acid (ATCA), Toxicol. Mech. Methods, 16 (2006) 339–345. [DOI] [PubMed] [Google Scholar]
- [3].Moriya F, Hashimoto Y, Potential for error when assessing blood cyanide concentrations in fire victims, Journal of forensic science, 46 (2001) 1421–1425. [PubMed] [Google Scholar]
- [4].Logue BA, Hinkens DM, Baskin SI, Rockwood GA, The analysis of cyanide and its breakdown products in biological samples, Critical Reviews in Analytical Chemistry, 40 (2010) 122–147. [Google Scholar]
- [5].Baskin S, Petrikovics I, Kurche J, Nicholson J, Logue B, Maliner B, Rockwood G, Insights on cyanide toxicity and methods of treatment, Pharmacological perspectives of toxic chemicals and their antidotes, (2004) 105–146. [Google Scholar]
- [6].Xu Z, Chen X, Kim HN, Yoon J, Sensors for the optical detection of cyanide ion, Chem. Soc. Rev, 39 (2010) 127–137. [DOI] [PubMed] [Google Scholar]
- [7].Alcorta RJ.J.a.j.o.e.m.s., Smoke inhalation & acute cyanide poisoning. Hydrogen cyanide poisoning proves increasingly common in smoke-inhalation victims, 29 (2004) suppl 6. [PubMed] [Google Scholar]
- [8].Baud FJ, Barriot P, Toffis V, Riou B, Vicaut E, Lecarpentier Y, Bourdon R, Astier A, Bismuth C.J.N.E.J.o.M., Elevated blood cyanide concentrations in victims of smoke inhalation, 325 (1991) 1761–1766. [DOI] [PubMed] [Google Scholar]
- [9].Dash RR, Gaur A, Balomajumder C, Cyanide in industrial wastewaters and its removal: a review on biotreatment, J. Hazard. Mater, 163 (2009) 1–11. [DOI] [PubMed] [Google Scholar]
- [10].Vinnakota CV, Peetha NS, Perrizo MG, Ferris DG, Oda RP, Rockwood GA, Logue BA, Comparison of cyanide exposure markers in the biofluids of smokers and non-smokers, Biomarkers, 17 (2012) 625–633. [DOI] [PubMed] [Google Scholar]
- [11].Hughes C, Lehner F, Dirikolu L, Harkins D, Boyles J, McDowell K, Tobin T, Crutchfield J, Sebastian M, Harrison L.J.T.m., methods, A simple and highly sensitive spectrophotometric method for the determination of cyanide in equine blood, 13 (2003) 129–138. [DOI] [PubMed] [Google Scholar]
- [12].Bhandari RK, Oda RP, Petrikovics I, Thompson DE, Brenner M, Mahon SB, Bebarta VS, Rockwood GA, Logue BA, Cyanide toxicokinetics: the behavior of cyanide, thiocyanate and 2-amino-2-thiazoline-4-carboxylic acid in multiple animal models, J. Anal. Toxicol, 38 (2014) 218. [DOI] [PMC free article] [PubMed] [Google Scholar]
- [13].Frison G, Zancanaro F, Favretto D, Ferrara SD, An improved method for cyanide determination in blood using solid-phase microextraction and gas chromatography/mass spectrometry, Rapid Commun. Mass Spectrom, 20 (2006) 2932–2938. [DOI] [PubMed] [Google Scholar]
- [14].Laforge M, Gourlain H, Fompeydie D, Buneaux F, Borron SW, Galliot-Guilley MJ.J.o.T.C.T., Ferrocyanide ingestion may cause false positives in cyanide determination, 37 (1999) 337–340. [DOI] [PubMed] [Google Scholar]
- [15].Brenner M, Kim JG, Lee J, Mahon SB, Lemor D, Ahdout R, Boss GR, Blackledge W, Jann L, Nagasawa HT, Patterson SE, Sulfanegen sodium treatment in a rabbit model of sub-lethal cyanide toxicity, Toxicol. Appl. Pharmacol, 248 (2010) 269–276. [DOI] [PMC free article] [PubMed] [Google Scholar]
- [16].Broderick KE, Potluri P, Zhuang S, Scheffler IE, Sharma VS, Pilz RB, Boss GR, Cyanide detoxification by the cobalamin precursor cobinamide, Exp. Biol. Med. (Maywood), 231 (2006) 641–649. [DOI] [PubMed] [Google Scholar]
- [17].Rehman HU, Methemoglobinemia, West. J. Med, 175 (2001) 193–196. [DOI] [PMC free article] [PubMed] [Google Scholar]
- [18].Isom GE, Borowitz JL, Mukhopadhyay S, Sulfurtransferase Enzymes Involved In Cyanide Metabolism, in: W.L. Purdue University, IN, (Ed.) Elsevier Ltd, Elsevier Ltd, 2010, pp. 486–498. [Google Scholar]
- [19].Miralles E, Prat D, Compano R, Granados MJA, Assessment of Different Fluorimetric Reactions for CyanideDetermination in Flow Systems, 122 (1997) 553–558. [Google Scholar]
- [20].Ramachandran E, Vandarkuzhali SA, Sivaraman G, Dhamodharan R, Phenothiazine Based Donor-Acceptor Compounds with Solid-State Emission in the Yellow to NIR Region and Their Highly Selective and Sensitive Detection of Cyanide Ion in ppb Level, Chemistry-A European Journal, 24 (2018) 11042–11050. [DOI] [PubMed] [Google Scholar]
- [21].Wang F, Wang L, Chen X, Yoon J, Recent progress in the development of fluorometric and colorimetric chemosensors for detection of cyanide ions, Chem. Soc. Rev, 43 (2014) 4312–4324. [DOI] [PubMed] [Google Scholar]
- [22].Lehn J, Concept and perspectives, Supramol. Chem, (1995). [Google Scholar]
- [23].Wu P, Hou X, Xu J-J, Chen H-Y, Ratiometric fluorescence, electrochemiluminescence, and photoelectrochemical chemo/biosensing based on semiconductor quantum dots, Nanoscale, 8 (2016) 8427–8442. [DOI] [PubMed] [Google Scholar]
- [24].Lu X, Zhang J, Xie Y-N, Zhang X, Jiang X, Hou X, Wu P, Ratiometric phosphorescent probe for thallium in serum, water, and soil samples based on long-lived, spectrally resolved, Mn-doped ZnSe quantum dots and carbon dots, Anal. Chem, 90 (2018) 2939–2945. [DOI] [PubMed] [Google Scholar]
- [25].Jackson R, Logue BA, A review of rapid and field-portable analytical techniques for the diagnosis of cyanide exposure, Anal. Chim. Acta, 960 (2017) 18–39. [DOI] [PubMed] [Google Scholar]
- [26].Jackson R, Oda RP, Bhandari RK, Mahon SB, Brenner M, Rockwood GA, Logue BA, Development of a fluorescence-based sensor for rapid diagnosis of cyanide exposure, Anal. Chem, 86 (2014) 1845. [DOI] [PMC free article] [PubMed] [Google Scholar]
- [27].Carlson RG, Srinivasachar K, Givens RS, Matuszewski BK, New Derivatizing Agents for Amino Acids and Peptides. 1. Facile Synthesis of N-Substituted 1-Cyanobenz[f]isoindoles and Their Spectroscopic Properties, J. Org. Chem, 51 (1986) 3978–3983. [Google Scholar]
- [28].Sano A, Takezawa M, Takitani S, Spectrofluorometric determination of cyanide in blood and urine with naphthalene-2,3-dialdehyde and taurine., Anal. Chim. Acta 225 (1989) 351–358. [Google Scholar]
- [29].Bhandari RK, Oda RP, Youso SL, Petrikovics I, Bebarta VS, Rockwood GA, Logue BA, Simultaneous determination of cyanide and thiocyanate in plasma by chemical ionization gas chromatography mass-spectrometry (CI-GC-MS), Anal. Bioanal. Chem, 404 (2012) 2287–2294. [DOI] [PubMed] [Google Scholar]
- [30].Logue BA, Manandhar E, Percent residual accuracy for quantifying goodness-of-fit of linear calibration curves, Talanta, 189 (2018) 527–533. [DOI] [PubMed] [Google Scholar]
- [31].Gyamfi OA, Bortey-Sam N, Mahon SB, Brenner M, Rockwood GA, Logue BA, Metabolism of Cyanide by Glutathione To Produce the Novel Cyanide Metabolite 2-Aminothiazoline-4-oxoaminoethanoic Acid, Chem. Res. Toxicol, 32 (2019) 718–726. [DOI] [PubMed] [Google Scholar]


