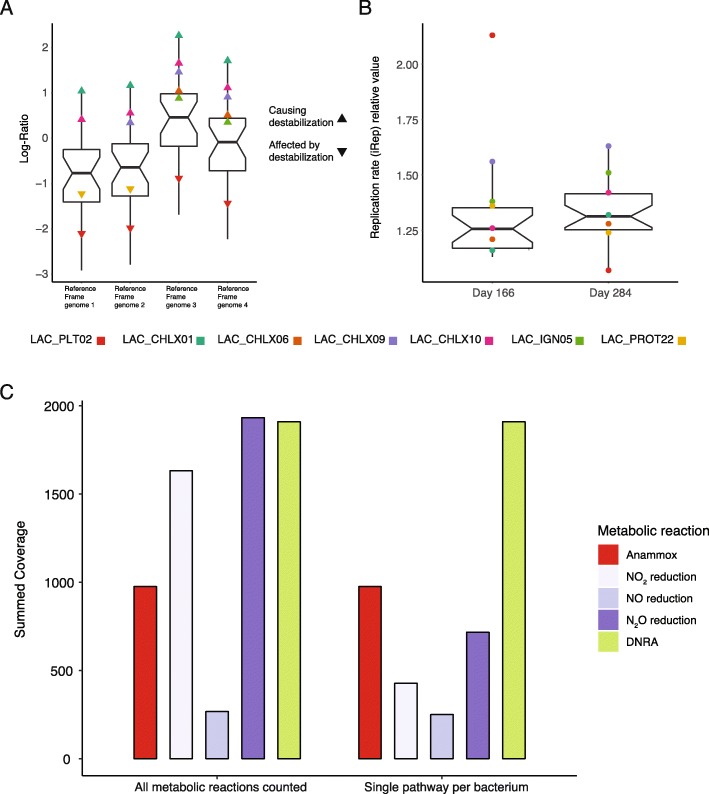
Fig. 8.
The tracking of bacterial growth and nitrogen metabolism in relation to the anammox performance destabilization. a Distribution of Log-ratio changes for selected bacteria between D328 and D284, using different genomes as reference frames. Bacteria that are significantly affected or considered to affect the destabilization event are color-coded. Down-pointing triangles depict bacteria negatively affected by the destabilization and upwards-pointing triangles indicate bacteria that likely caused (or contributed) to the destabilization. b Replication rate values on Days 166 and 284. Bacteria are color-coded the same as in panel a. c Relative abundance of nitrogen metabolism pathways in the selected bacteria. Denitrification is divided into its reaction steps. Anammox is considered a single path since only a single bacterium can perform it (Brocadia—LAC_PLT02). DNRA from NO2 is a single-step reaction. Abundance was calculated twice, once allowing multiple pathways to occur within each bacterium, and once after choosing a single pathway per bacterium (based on potential energy gain).

