Abstract
We report a bifurcated continuous field-flow fractionation (BCFFF) chip for high-yield and high-throughput (20 min) extraction of nucleic acids from physiological samples. The design uses a membrane ionic transistor to sustain low-ionic strength in a localized region at a junction, such that the resulting high field can selectively isolate high-charge density nucleic acids from the main flow channel and insert them into a standardized buffer in a side channel that bifurcates from the junction. The high local electric field and the bifurcated field-flow design facilitate concentration reduction of both divalent cation (Ca2+) and molecular PCR inhibitors by more than two orders of magnitude, even with high-throughput continuous loading. The unique design with a large (>20mM/mm) on-chip ionic-strength gradient allows miniaturization into a high-throughput field-flow fractionation chip that can be integrated with upstream lysing and downstream PCR/sensor modules for various nucleic acid detection/quantification applications. A concentration-independent 85% yield for extraction and an overall post-PCR yield exceeding 60% are demonstrated for a 111bp dsDNA in 10μL of human plasma, compared to no amplification with the raw sample. A net yield four times larger than a commercial extraction kit is demonstrated for miR-39 in human plasma.
Graphical Abstract
Introduction
The detection and quantification of nucleic acids play essential roles in various applications, such as clinical diagnostics, food safety, forensic analysis, and environmental monitoring. In the last two decades, the discovery of host nucleic acid biomarkers (mutations in coding DNA/mRNA and irregular expressions of noncoding miRNA) for different diseases has opened up numerous new and future applications. In such biomarker applications, particularly with noncoding miRNAs, accurate nucleic acid quantification in bodily fluids becomes the overriding requirement. The current nucleic acid analysis technologies, like PCR, microarray, and sequencing, can provide sensitive and selective quantification- after the nucleic acid molecules are extracted from physiological samples (mostly blood) rich in various PCR and hybridization inhibitors and inserted into a standardized reagent buffer1. The standardized buffer provides a baseline for normalization for the various sequence-, ionic strength- and pH-dependent quantitative nucleic acid reaction assays. Removal of inhibitory agents like metal cations, proteins, nucleases, proteinase, etc. in the physiological samples would also remove the quantitative bias they introduce2. Consequently, a high-yield pre-treatment step to extract and purify the nucleic acid targets and insert them into a standardized buffer becomes the key step for sensitive and accurate quantification, independent of the actual detection platform. With these high-yield pre-treatment steps, welcomed features like absolute quantification and cross-platform comparison become possible.
Current extraction methods are based on liquid extraction into immiscible liquids and solid extraction by high-affinity binding columns. Immiscible organic solvents like phenol and chloroform are used during such extraction steps and they must be removed before further analysis. These multiple extraction, binding, and washing steps render the entire procedure labor-intensive, low-throughput and, most importantly, low-yield3. Efforts have been made to transfer such binding/washing extraction principles onto microfluidic lab-on-a-chip systems4–8. Recent advances in integration and novel extraction methods show improvement of extraction efficiency, especially for large nucleic acid molecules9–11. However, the low binding efficiency and solubility of short nucleic acids, like 20-base miRNAs12, often stipulate much larger sorbent volume and extracting liquid than can be accommodated by a microfluidic chip. High-affinity absorbing materials have been developed13–17 with optimized elution buffer but they remain inadequate, with extraction efficiencies below 20%18,19. Moreover, the extraction efficiency for each kit is concentration-dependent, with the yield going down at lower concentrations. This greatly complicates the quantification effort, as normalization with respect to a house-keeping molecule becomes inaccurate and extensive calibration is necessary. Multiple and non-continuous operation steps of the current microfluidic-based extraction modules also render their integration with downstream PCR or other detection modules extremely difficult. Clearly, a high-throughput and high-yield extraction chip module that can be integrated with downstream steps in an integrated continuous-flow platform would significantly elevate the detection sensitivity, quantification accuracy and usability of nucleic acid analysis technologies.
We report such an on-chip microfluidic extraction technology here that can isolate nucleic acids from an inhibitor-rich plasma sample and insert them into a standardized PCR buffer at high yield and throughput. We develop a field-flow fractionation design which extracts charged nucleic acids from a continuous flow by electrophoresis. The isolation performance of our method is significantly enhanced for high-mobility nucleic acids through the creation of a low ionic strength region with a high electric field at the bifurcation junction. The field (~100 V/cm) is about 10 times higher than in capillary or gel electrophoresis but is still 100 times lower than the value necessary to damage the nucleic acids20–23. The high field allows us to selectively remove nucleic acids from a flowing sample and insert them in the standardized buffer and yet reject high-mobility cations that are also PCR inhibitors. The low ionic strength region on the chip is created by the ion depletion action of a gated membrane ionic transistor, reported in our earlier publications24,25, that allows easy control of the range and intensity of the ion-depleted zone. Unlike conventional electrokinetic modules based on external ion concentration polarization of a passive ion-selective membrane26 without through flow, our design combines the versatility of a gated membrane ionic transistor24,25 and the hydrodynamic drag to achieve the continuous field-flow fractionation design. The hydrodynamic drag removes larger molecules with weaker charge density (e.g. the proteins) in the throughflow, while the high electric field extracts the target nucleic acids from protein inhibitors in the main flow channel and insert them into a bifurcated channel without the cation inhibitors. Such selective extraction from both high-mobility and low-mobility contaminants is difficult to achieve in standard single-channel field-flow fractionation design. Moreover, we do not rely on the transverse gradient of the flow field and hence can achieve much higher yield with simpler tuning efforts. The standardized buffer is introduced into the bifurcated channel to complete the continuous extraction and purification process. Our bifurcated continuous field-flow fractionation (BCFFF) design hence exploits not just the high free-space electrophoretic mobility of the nucleic acids but also the different mobility direction of the counterions that bind to them and induce association or dissociation nucleic acid reactions that inhibit PCR. We demonstrate with an integrated chip an extraction yield from plasma higher than 80% for different nucleic acids with different lengths, ranging from long dsDNA fragments to short miRNAs.
Material and Methods
Fabrication of the Microfluidic Chips
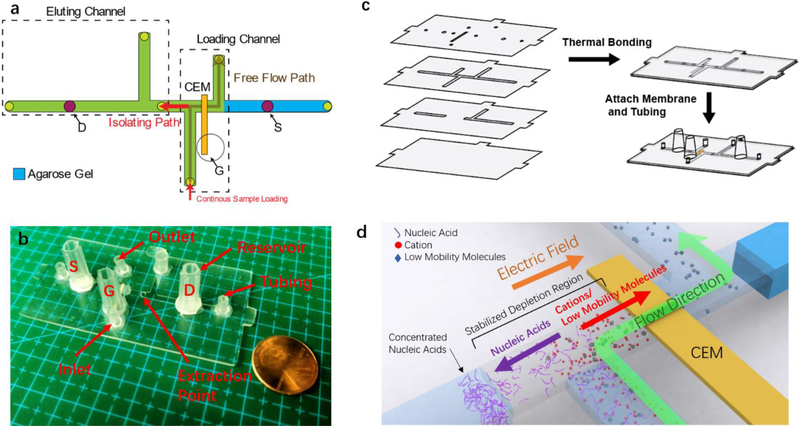
The membrane transistor fabrication method is adopted from previous research of ionic transistor24,25. As shown in Fig. 1(c) The microfluidic BCFFF chip is fabricated by thermal bonding of four layers of polycarbonate (PC) sheets, whose low zeta potential minimizes electro-osmotic flow. For each layer, the patterns are cut on a plotter (Graphtec Cutting Pro FC7000MK2–60). The top 300μm-thick layer consists of the openings of microchannels for fluidic connections and membrane attachment. The bifurcated channel pattern is on the second 100μm-thick layer. Vortices are often observed at the ion-selective membrane and at the boundary of the ion-depleted region (the depletion layer) in our earlier work on gated ionic transistors24,25. The thin second layer is to enhance viscous dissipation and to suppress these vortices. Earlier studies have shown that the vortices do not appear at this thickness27,28. The third 300μm-thick layer increases the volume of side channels to enhance the electric field under the cation-exchange membrane (CEM) by field focusing. The bottom 300μm-thick layer is the substrate. These PC sheets are aligned and thermally bonded together at 173°c for 30min. A strip of CEM is sealed onto the chip with a UV curable glue (Acrifix 192). The extraction outlet is sealed with tape for easy extraction. The D, S opening on the chip are first covered with cut filter paper. Cut pipette tips as buffer reservoirs for electrical connection and Tygon tubings as fluidic inlets and outlets are fixed by the UV curable glue onto their designated places on the top of the chip. The device is filled with 0.1×PBS buffer. 1% agarose gel in 0.1×PBS is placed on the bottom of each reservoir and filled into the side channel under the S reservoir. The chip is left overnight to let the CEM swell properly before use.
Fig. 1.
(a) The layout of the bifurcated continuous field-flow fractionation (BCFFF) chip. (b) The fabrication method of the chip. (c) Actual picture of the device. (d) Working principle of the continuous field-flow fractionation chip.
Experiment Setup
During the experiment, all the openings of the chip are sealed except the inlet and outlet of the loading channel. Platinum wires are fixed in the G, D, S reservoirs on the microfluidic chip. External voltages are applied through these wires by Keithley 2636A Dual-Channel System SourceMeter Instrument controlled and monitored by custom MATLAB code. The samples are loaded on to the chip through the inlet of the loading channel by a Braintree syringe pump. After pretreatment, the outlet of the loading channel is sealed, 4μL of purified sample is quickly collected from the extraction outlet with a pipette.
Fluorescent Visualization and Measurement
The real-time fluorescence images of pretreatment of ssDNA are taken by using an inverted epifluorescence microscope (Olympus 1X71) equipped with a mercury lamp and a high-speed camera (QImaging Retiga-EX). The visualization of on-chip pretreatment of dsDNA from plasma is performed on a customized dark-room platform equipped with a Dark Reader Transilluminator (Clare Chemical) to excite the fluorescent dye from the bottom of the microfluidic chip. The fluorescent signal is filtered and recorded at the top of the microfluidic chip by a Logitech C920 Webcam. SYBR® Green I Nucleic Acid Stain is purchased from Lonza (Cat#50513). Pierce™ Recombinant GFP Protein is purchased from Thermo Scientific™ (Cat#88899). The fluorescence measurement of pretreated samples is performed on Tecan Infinite M200 Plate Reader.
Plasma Samples
De-identified fresh human plasma samples were purchased from Zen-Bio Inc. The 10mL samples were collected in tubes with EDTA coagulant. All samples were obtained following FDA-mandated testing for pathogens.
Quantification of Calcium Concentration
The concentration of calcium in each sample is measured by Inductively Coupled Plasma Optically Emitting Spectra (ICP-OES, Perkin Elmer Optima 8000).
E. Coli DNA Amplification and Gel Electrophoresis
E. Coli with pUC18 plasmid is purchased from Modern Biology Inc. The primers from IDT DNA are shown in Table S1. Pellet of E. Coli is obtained by centrifugation at 5000g for 10min and resuspended in 1×PBS. The solution is put into 95°C water bath for 10min to thermally lyse the bacteria. PCR of E. Coli DNA is carried out on a Bio-Rad MJ Mini. Each 20μL reaction contained 2μL of the sample, 10μL SsoAdvanced Universal SYBR Green Supermix (Bio-Rad), 500nM of forward primer, 500nM of reverse primer, and 4μL water. The following TaqMan thermocycling conditions were used: 10 min at 95°C, followed by 28 cycles of 95°C for 60s, 50°C for 60s, and 75°C for 180s. Electrophoresis of the amplicon is run at 80V for 1 hour in 1.2% agarose gel. the gel was stained with SYBR® Green I Nucleic Acid Stain (Lonza) and visualized under a dark reader transilluminator (Clare Chemical).
DNA Quantification
As shown in Table S1, The oligos and DNA templates sequences are adapted from literature report29 and purchased from IDT DNA. The dsDNA is obtained by purification of PCR products from the DNA template with QuickClean PCR Purification Kit (GenScript). To quantify the yield of DNA, Triplicates of qPCR reactions were carried out on a StepOnePlus™ Real-Time PCR System (Applied Biosystems). The reaction contained 2μL of the sample, 10 μL TaqMan™ Universal Master Mix II, no UNG (Qiagen), 500nM of forward primer, 500nM of reverse primer, 500nM of TaqMan probe, and 2 μL RNase-free water in a final volume of 20 μL. The following TaqMan thermocycling conditions were used: 10 min at 95°C, followed by 45 cycles of 95°C for 30 s and 60°C for 60 s. The Cq values were acquired and analyzed using StepOne™ Software v2.3.
MiRNA Quantification
For the quantification of miRNA, qRT-PCR was performed on each extracted sample. Reverse transcription was carried out using a miScript II RT Kit (Qiagen). A 20 μL reverse transcription reaction was prepared with 2μL of eluted miRNA, 4μL 5× miScript HiSpec Buffer (Qiagen), 2μL 10× miScript Nucleics Mix (Qiagen), 10μL RNase-free water, and 2μL miScript Reverse Transcriptase Mix (Qiagen). The reaction was incubated at 37°C for 60 min, followed by 95°C for 5 min. The reverse transcription reaction was then diluted with 200 μL RNase-free water. Triplicates of qPCR reactions were carried out using the miScript SYBR Green PCR Kit (Qiagen). The reaction contained 2μL diluted cDNA, 12.5 μL 2× QuantiTect® SYBR Green PCR Master Mix (Qiagen), 2.5 μL 10× miScript Universal Primer (Qiagen), 10× miScript Primer Assay (Qiagen) for the target miRNA, and 5.5 μL RNase-free water in a final volume of 25 μL. The reaction mixtures were incubated for 15 min at 95°C, followed by 45 cycles of 94°C for 15 s, 55°C for 30 s, and 70°C for 30 s.
Results and discussion
Principle of the On-Chip Nucleic Acid Extraction
The current adsorption-based solid-extraction technologies are plagued by low yield for short miRNAs18,19. For adsorption of polyelectrolyte, the critical substrate surface charge density for adsorption scales as 1/N 30, where N is the length of the polyelectrolyte. Therefore, the yield of the column goes down at least proportionally with the length, with the all-important short miRNAs having the lowest yield. Different nucleic acid sequences also have different binding affinities to the substrate even if they have the same length31,32, which leads to variation in extraction efficiency and inaccuracy of the quantification. To the contrary, due to their high charge density, free-flow electrophoretic mobility of nucleic acids is higher than any other large biomolecule and beyond a critical length (>200bp), a saturation mobility of 2×10⁻⁴ cm2 V−1 s−1 - 4×10⁻⁴ cm2 V−1 s−1 independent of concentration, size, and electric field strength is reached33–35. Interestingly, shorter miRNAs that are no more than a few persistence lengths long exhibit more hydrodynamic screening than electrostatic screening36, producing higher mobility than even longer nucleic acids and hence exhibit the highest electrophoretic mobility among all biomolecules. The high electrophoretic mobility of nucleic acid molecules, particularly short miRNAs, will be exploited in our BCFFF design, as a field-flow extraction design with an electric field is expected to have a better yield than solid-phase extraction or other field-flow designs with other fields, particularly for short miRNAs.
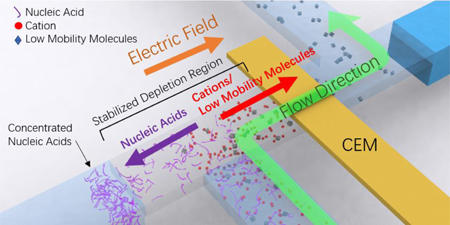
Even though miRNAs should have the largest free-space electrophoretic mobility of all biomolecules, their mobility should still be significantly lower than that of ions, particularly the ubiquitous divalent cations like Ca2+ that are also PCR inhibitors. Hence, the field-flow fractionation design must also reject counter-ions to nucleic acids, particularly multivalent cations. This issue motivates the bifurcated-channel design in BCFFF, as shown in Fig. 1(d), such that the nucleic acids and their counterions can be separated because of their opposite electrophoretic directions.
Even with the high mobility of 4×10⁻⁴cm2 V−1s−1 for miRNA, a high electric field (~100V/cm) is still required for their extraction into the bifurcated channel, during passage through the typical millimeter-length of the junction, at the standard high-throughput linear velocity of mm/s. Such a high field in a typical physiological fluid with ion strength of ≥ 100mM would produce a large ionic current and a high Ohmic heating rate of tens of mW/mm2, causing bubble formation and pH changes due to electrochemical reactions at elevated temperatures and voltages. Our solution is to locally deplete the ionic strength to below mM, which is the principle behind many recent electrokinetic chip designs which use ion-selective membrane for on-chip ion concentration depletion 37–39. The electric field in the ion-depleted region is inversely proportional to the dimension of the depleted region. Hence, ideally, the depletion region should be localized just at the junction of the bifurcated-main channel to sustain a high field at the working position. Any fluctuation in the length of the depletion zone would corrupt and render inconsistent the yield of the extraction pretreatment process. However, the extent and intensity of depletion are difficult to control and an excessively large depletion zone can reduce the field intensity at the desired location. Our recent work uses a 3-terminal ionic transistor design to stabilize the depletion front at a designated location24,25. This design is ideal for continuous isolation of target from the sample flow to standard buffer in the cross channel, where the high field of the ion depletion region is only needed at the junction between of the main channel with the eluting bifurcated channel. As shown in Fig. 1c, an ionic transistor with a cation exchange membrane (CEM) is implemented in order to drive counter-ions such that negatively-charged nucleic acids move away from the membrane, against the flow, towards the eluting channel. The source terminal “S” is fixed to 0V. And the size of the depletion region can be adjusted by tuning the ratio between the draining potential (Vd) at “D” terminal and gating potential(Vg) at the “G” terminal. The sample is introduced into the depletion region generated by the ionic transistor through a perpendicularly intersected loading channel continuously with a syringe pump. External voltages are designed to extend the depletion zone from the loading channel to the right edge of the eluting channel (Fig. 1c). Inside the depletion region, high-mobility anionic molecules like nucleic acids are driven by the electric field towards to the elution channel, while low-mobility and cationic molecules are driven away from the elution channel, by the combination of electric force and hydrodynamic drag.
Estimation of Nucleic Acid Extraction by Fluorescence
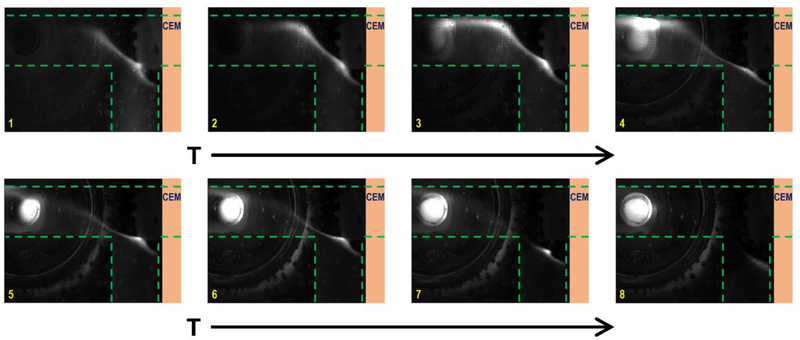
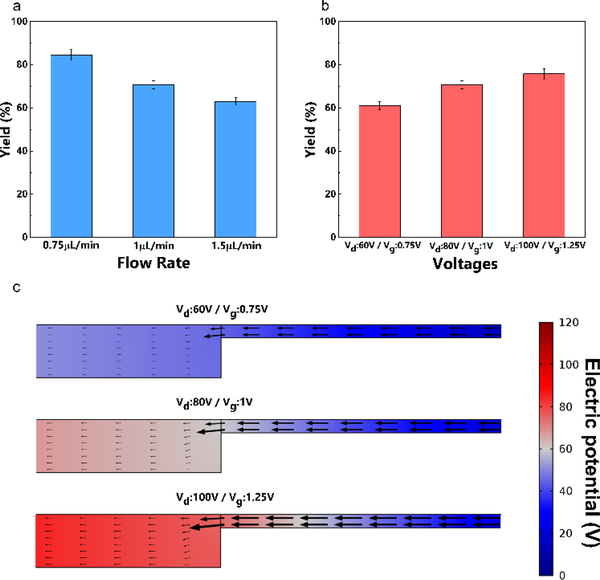
The extraction efficiency of this method is first quantified by comparing the total fluorescence of fluorescence-labelled ssDNA before and after the on-chip isolation. Such efficiency is dictated by the electric field and the hydrodynamic drag locally at the junction, which are independently controlled by external voltages and the flow rate applied to the systems. Inside the depletion region which is stabilized at the junction by fixing Vd/Vg at 80 (Fig. 1c)25, the sample loading flow is in the opposite direction of the electric field. Hence there is a competition between electrophoretic velocity and convective velocity of the target. The electrophoretic velocity is defined by uelectrophoresis= μeE, where μe is the electrophoretic mobility and E is the electric field. The convective velocity, on the other hand, is specified by the flow rate applied. The applied electric field needs to be high enough to push the target nucleic acids towards the eluting channel. As demonstrated in Fig. 2, the fluorescence-labelled ssDNA is driven out of the flow by the electric field and stabilized at the designated extraction point. Fig. 3 shows the experimental data exactly as expected - the extraction efficiency increases with higher voltage and decreases with a higher flow rate. In all cases, this method shows a promising isolation yield –greater than 50% in the tested combination of parameters and can reach as high as 85% once optimized for a particular flow rate, sample ionic strength and channel geometry. The effect of increasing ionic strength of the loaded sample should be similar to that of decreasing voltages since smaller resistance of the depletion region can lower down the potential drop inside. Thus, there is a trade-off between the throughput (flow rate and ionic strength) and the extraction efficiency of the system. Nucleic acids are concentrated locally at the designated location, as shown in the video. With the continuous flow design, the enrichment of target molecules can be done for an arbitrary volume of the sample – the trade-off is the pretreatment time, as Fig. 3 indicates that the flow rate should not exceed a certain critical value of roughly 0.75 μL/min. The extraction yield is also independent of DNA copy number. Unlike, batch liquid and solid extraction, saturation that corrupts high copy number samples is not an issue. A washing step that is often responsible for low extraction yield of low copy number samples is also absent. We will subsequently establish through serial dilution that our extraction yield is indeed concentration independent.
Fig. 2.
Real-time fluorescence images show the isolation of the fluorescent-labelled ssDNAs. 1: t = 134s; 2: t = 269s; 3: t = 435s; 4: t = 571s; 5: t = 766s; 6: t = 947s; 7: t = 1114s; 8: t = 1280s. The sample loading stops after 1000s. Vd = 80V and Vg = 1V
Fig. 3.
The extraction efficiency of the fluorescence-labeled ssDNA with (a) different sample loading flow rates (Vd:80V / Vg:1V), (b) different applied voltages (flow rate: 1μL/min ), (c) Simulation of the electric potential and the electric field near the depletion front at different applied voltages.
Removal of Major PCR Inhibitors
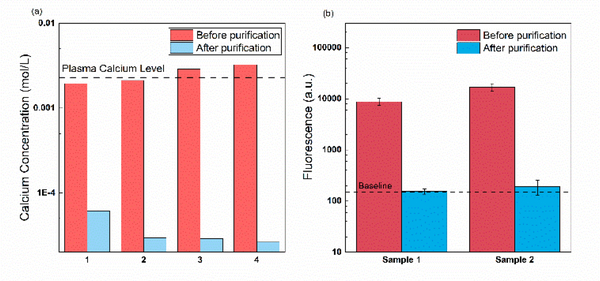
One of the major inhibitors of PCR amplification is calcium ion, particularly in urine and plasma samples. Calcium ions can compete with magnesium ions, which is a cofactor of the polymerase reaction40, during the latter’s binding with the DNA polymerase. To evaluate the calcium removal efficiency of our device, we perform pretreatment experiments on 1uM ssDNA spiked in 10 μL 0.5xPBS samples with ~ 2mM of calcium ions. These concentration levels are comparable to that in plasma and can cause inaccurate quantification or total inhibition of PCR amplification40. After pretreated with the optimized protocol (Vd = 1V, Vg = 80V, flow rate =0.75 μL/min). Fig. 3a shows that the calcium concentration in the eluted sample drops by three orders of magnitude, regardless of its initial concentration. At this low calcium concentration, PCR can be directly performed with the eluted DNA sample. A more extreme proof-of-concept experiment is done with E. coli DNA from lysed bacteria with 20mM spiked-in calcium chloride. As shown in Fig. S2,, where the PCR products of both treated and untreated sample are run on the gel, a positive result is only achieved with the treated sample while no amplification is observed with the untreated sample.
Another category of inhibitor is protein. Unlike nucleic acids which are strongly negatively charged, most proteins are weakly charged, and their polarity can be either positive or negative depending on their isoelectric point. The positively charged proteins can be easily removed by our system just as other cationic molecules. For negatively charged proteins, their mobilities are usually much smaller than that of nucleic acids33,41; thus, they tend to be dragged away by the flow instead of being collected into the eluting channel by the electric field. Here we use GFP molecules to validate the removal of protein using our device. The removal efficiency is demonstrated by loading 0.5×PBS spiked with GFP onto the pretreatment chip and running optimized protocol (Vd = 1V, Vg = 80V, Flow rate = 0.75μL /min) for nucleic acid extraction. The recombinant GFP is negatively charged in the physiological environment and the depletion region. However, because of its low electrophoretic mobility, it can be successfully separated from the isolated nucleic acids under the hydrodynamic drag force. As shown in Fig. 4b, the measured fluorescence signals from the eluted sample are very close to the baseline, which indicates almost none of the GFP molecules are collected into the eluting channel under this condition.
Fig. 4.
Efficient removal of PCR inhibitors: (a) Calcium ions, (b) Proteins(GFP).
Amplification of DNA extracted from Spiked Plasma Sample
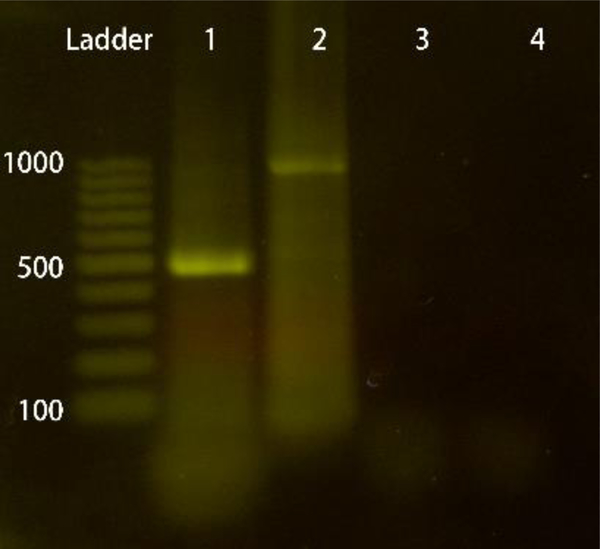
The ability of our device to extract and purify long DNA is verified with E. coli pUC18 plasmid spiked into human plasma samples. 10μL of lysed E. coli in 1×PBS is spiked into 190uL of human plasma. Human plasma contains 60–80mg/mL of total protein and is the most heterogeneous sample for molecular detection and quantification42. After applying the voltage (Vd = 1V, Vg = 80V) and stabilizing the current, 30uL of the prepared sample is loaded onto to the device at a flow rate of 0.75μL /min followed by 5μL of 0.1×PBS. 4μL of fluid is eluted from the chip for PCR amplification. Fig. 5 shows the PCR result on the gel. Two targets – rDNA (550bp product) and Ampicillin-resistance gene (1020bp product) are amplified separately. The successful amplification of these 2 long targets, compared to the absence of target bands for untreated samples, indicates that our device is capable of purifying long DNA from plasma for PCR. Moreover, secondary amplicon is absent in the gel image, which suggests long DNA molecules are intact during the pre-treatment.
Fig. 5.
Agarose gel electrophoresis results of PCR for (1) rDNA in nucleic acid extracted on chip, (2) Ampicillin-resistance gene in nucleic acid extracted on chip, (3) rDNA in untreated sample, (4) Ampicillin-resistance gene in untreated sample.
Quantification of Extracted DNA from Plasma
To quantify the yield of extracted nucleic acids and inhibitor removal efficiency of our BCFFF device, we perform pre-treatment of human plasma spiked with enterococcus DNA fragments. Human plasma contains 60–80mg/mL of total protein, which is one of the most complicated backgrounds for molecular detection and quantification42. The 111-bp enterococcus DNA is exogenous for human and suitable as a spiked-in control to evaluate purification efficiency. To achieve a higher yield with acceptable throughput, the spiked plasma is diluted by DI water of the same volume. 1μM of dsDNA sample is labelled with SYBR dye to visualize the process (Fig. S3). 10 μL of the sample, spiked with 1×10⁶ copies/ μL of dsDNA, is pretreated by the chip with a loading flow rate of 0.75 μL /min followed by 5 μL of 0.1×PBS to flush the remaining plug of the sample inside the loading channel. The entire pre-treatment process hence takes about 20 minutes. The successful isolation of nucleic acids is confirmed by fluorescence imaging of the BCFFF chip.
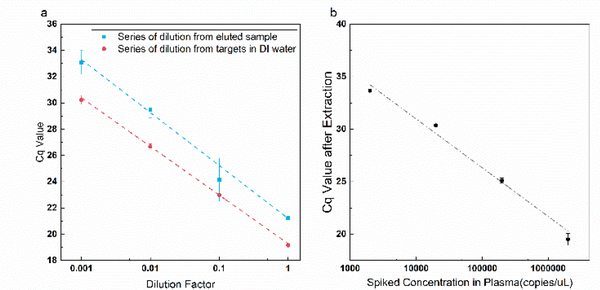
We evaluated the purification from inhibitors of the eluted sample by examining the PCR efficiency of the spiked enterococcus DNA. In PCR experiments, impurity in the sample could lead to low PCR efficiency and nonlinearity during serial dilution of the sample. A series of dilution is carried out on the eluted sample. The qPCR result of these diluted samples is compared with both the result from a series of dilution of inhibitor-free control in DI water (Fig. 5a). The amplification efficiency of the PCR reaction is evaluated by the slope of the fitting curve. An average ΔCq of 4 is found for target concentrations off by a factor of 10. The amplification efficiency is hence estimated to be larger than 60% (~62%). In contrast, no amplification is observed for the untreated plasma sample after 45 cycles, suggesting total inhibition in the inhibitor-rich plasma. After pretreatment, however, the slope of the fitting curve from the isolated nucleic acids (blue) is close to that of the inhibitor-free control, which demonstrates successful removal of inhibitory molecules from plasma with our pretreatment unit. With the estimated 85% extraction yield, we estimate the inhibitor-free PCR reaction yield is 80% and can be improved with a better selection of primers and thermal protocol.
A series of spiked plasma sample is pretreated on the chip following the same protocol described above (Fig. 5b). The result shows good linearity between Cq value and logarithm of the copy number, suggesting constant extraction efficiency over a three-decade range of the target concentration. Moreover, a similar ΔCq of 4 is found for a 10-fold change in target copy number as in the serially diluted samples in Fig. 5a—for all three decades of concentrations. This suggests we have removed all the inhibitors in both the undiluted and diluted plasma samples. The BCFFF pre-treatment module hence can effectively remove all the plasma inhibitors, independent of the target copy number. As far as we know, it is the first pre-treatment unit whose extraction yield is concentration-independent.
On-Chip miRNA Extraction
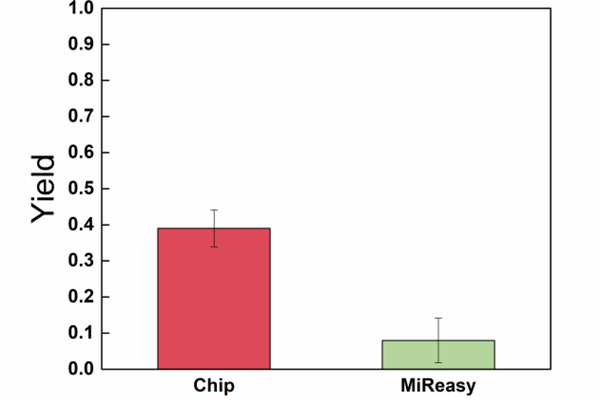
Not only can our BCFFF device purify large DNA fragments, but it also shows excellent performance for isolation of small miRNAs. The extraction efficiency of miRNA by our chip is compared with the commercial kit. Samples are prepared by spiking 3.5μL of 1.6×10⁸ copies/μL Synthetic 22-base cel-mir-39 into 200μL plasma. MiRNA is isolated from 20μL sample with the same protocol optimized for DNA extraction. For comparison, Commercial kit (Qiagen miReasy Serum/Plasma Kit) is used on 100μL samples with the protocol described in the manual. Reverse transcription is carried out on the eluted sample, and qPCR analysis is used to quantify the number of miRNAs and to calculate extraction efficiency. As shown in Fig. 6, overall reverse-transcription yield of over 40% is obtained, compared to less than 10% from the commercial kit, with an estimated 50% yield for the reverse transcription step and a near-100% yield for the PCR reaction for both. It is lower than the 60% to 80% yield of the ssDNA in Fig. 3 because of lower field in a higher ionic strength buffer, which can be corrected by applying a higher electric field.
Fig. 6.
(a) Evaluation of PCR efficiency by a series of dilution of the sample, the eluted sample has similar PCR efficiency to the inhibitor-free control. (b) Cq value from qPCR of the eluted sample with different initial spiked concentrations.
Conclusions
In summary, we have designed and validated an on-chip field-flow nucleic acid extraction BCFFF technology by using an ionic transistor to achieve local ionic strength control such that the target molecules in a continuous flow main channel can be extracted with a high field at a junction with a bifurcated channel. The stationary depletion front generated by the ionic transistor can be localized at the junction to produce a local high field with the necessary intensity, without Ohmic heating, bubble cavitation, and electrochemical reactions. The high field of the bifurcated-channel design, coupled with hydrodynamic drag, allows effective removal of both high-mobility counterion and low-mobility protein inhibitors by at least two orders of magnitude. The BCFFF platform is versatile and can be applied for isolation of both long dsDNAs and short miRNAs, without changing the device configuration or the operation protocol. High-efficiency (>85%) concentration-independent DNA extraction and 40% net rtPCR miRNA yield from plasma are reported, which is significantly higher than any other commercial liquid and solid extraction technologies. The PCR yield of dsDNA from plasma is shown to be comparable to that in a pure buffer without inhibitors over 3 decades in copy number. Its yield is hence concentration-independent, which is a welcomed feature for absolute nucleic acid quantification, with minimum normalization or calibration.
This chip-based extraction technology can be integrated with upstream lysis and downstream on-chip qRT-PCR module to build a fully integrated nucleic acid analysis platform with high throughput, sensitivity and quantification accuracy. Rapid and absolute quantification of nucleic acids in plasma is hence enabled with a minimum of steps. Because of the small required sample volume (less than 100 μl), our device is amenable to scale-up into parallel channels for larger volumes. The extraction yield can be further improved by staging multiple devices or recycling of the flow-through. This technology is best integrated with a portable electrical PCR detector and a chemical-free lysing module, such as our membrane sensor and Surface Acoustic Wave lysing module43,44. The integrated unit would be a turn-key and rapid PCR-based quantification platform, with electrical and microfluidic circuitry, that requires a small plasma sample volume (10 μL). Yet, its copy number estimate can be compared directly to lab-bound platforms with elaborate optics and multiple processing steps.
Supplementary Material
Fig. 7.
Yield of cel-mir-39 spiked in human plasma from chip and Qiagen MiReasy Kit.
Acknowledgement
The authors acknowledge the support of NIH 1R21CA206904-01 and the support of a China Scholarship Council fellowship for C.Z. The ICP-OES analyses were conducted at the Center for Environmental Science and Technology (CEST) at the University of Notre Dame.
Footnotes
Electronic Supplementary Information (ESI) available: See DOI:10.1039/c9lc00818g
Conflicts of interest
There are no conflicts to declare.
References
- 1.Tan SC and Yiap BC, DNA, RNA, and Protein Extraction, https://www.hindawi.com/journals/bmri/2009/574398/, (accessed November 9, 2018).
- 2.Al-Soud WA and Rådström P, J Clin Microbiol, 2001, 39, 485–493. [DOI] [PMC free article] [PubMed] [Google Scholar]
- 3.Schiebelhut LM, Abboud SS, Gómez Daglio LE, Swift HF and Dawson MN, Mol Ecol Resour, 2017, 17, 721–729. [DOI] [PubMed] [Google Scholar]
- 4.Choi JR, Hu J, Tang R, Gong Y, Feng S, Ren H, Wen T, Li X, Abas WABW, Pingguan-Murphy B and Xu F, Lab Chip, 2016, 16, 611–621. [DOI] [PubMed] [Google Scholar]
- 5.Kim C-J, Park J, Sunkara V, Kim T-H, Lee Y, Lee K, Kim M-H and Cho Y-K, Lab on a Chip,, DOI: 10.1039/C8LC00165K. [DOI] [Google Scholar]
- 6.Petralia S, Sciuto E. Luigi and Conoci S, Analyst, 2017, 142, 140–146. [DOI] [PubMed] [Google Scholar]
- 7.Tang R, Yang H, Gong Y, You M, Liu Z, Choi JR, Wen T, Qu Z, Mei Q and Xu F, Lab Chip,, DOI: 10.1039/C6LC01586G. [DOI] [PubMed] [Google Scholar]
- 8.Price CW, Leslie DC and Landers JP, Lab Chip, 2009, 9, 2484–2494. [DOI] [PubMed] [Google Scholar]
- 9.Agrawal P and Dorfman KD, Lab Chip, 2019, 19, 281–290. [DOI] [PMC free article] [PubMed] [Google Scholar]
- 10.Campos CDM, Gamage SST, Jackson JM, Witek MA, Park DS, Murphy MC, Godwin AK and Soper SA, Lab Chip, 2018, 18, 3459–3470. [DOI] [PMC free article] [PubMed] [Google Scholar]
- 11.Brassard D, Geissler M, Descarreaux M, Tremblay D, Daoud J, Clime L, Mounier M, Charlebois D and Veres T, Lab Chip, 2019, 19, 1941–1952. [DOI] [PubMed] [Google Scholar]
- 12.Simões AE, Pereira DM, Amaral JD, Nunes AF, Gomes SE, Rodrigues PM, Lo AC, D’Hooge R, Steer CJ, Thibodeau SN, Borralho PM and Rodrigues CM, BMC Genomics, 2013, 14, 181. [DOI] [PMC free article] [PubMed] [Google Scholar]
- 13.Zhao and Johnson JK, J. Am. Chem. Soc, 2007, 129, 10438–10445. [Google Scholar]
- 14.Saha S and Sarkar P, Phys. Chem. Chem. Phys, 2014, 16, 15355–15366. [DOI] [PubMed] [Google Scholar]
- 15.Park JS, Goo N-I and Kim D-E, Langmuir, 2014, 30, 12587–12595. [DOI] [PubMed] [Google Scholar]
- 16.Wang F, Liu B, Huang P-JJ and Liu J, Anal. Chem, 2013, 85, 12144–12151. [DOI] [PubMed] [Google Scholar]
- 17.Madhugiri S, Sun B, Smirniotis PG, Ferraris JP and Balkus KJ, Microporous and Mesoporous Materials, 2004, 69, 77–83. [Google Scholar]
- 18.Jimenez LA, Gionet-Gonzales Marissa A., Sedano S, Carballo JG, Mendez Y and Zhong W, Anal Bioanal Chem, 2018, 410, 1053–1060. [DOI] [PMC free article] [PubMed] [Google Scholar]
- 19.Vigneron N, Meryet-Figuière M, Guttin A, Issartel J-P, Lambert B, Briand M, Louis M-H, Vernon M, Lebailly P, Lecluse Y, Joly F, Krieger S, Lheureux S, Clarisse B, Leconte A, Gauduchon P, Poulain L and Denoyelle C, Molecular Oncology, 2016, 10, 981–992. [DOI] [PMC free article] [PubMed] [Google Scholar]
- 20.Cerón-Carrasco JP, Cerezo J and Jacquemin D, Phys Chem Chem Phys, 2014, 16, 8243–8246. [DOI] [PubMed] [Google Scholar]
- 21.Golberg A and Rubinsky B, Technol Cancer Res Treat, 2010, 9, 423–430. [DOI] [PubMed] [Google Scholar]
- 22.Sensale S, Peng Z and Chang H-C, J. Chem. Phys, 2018, 149, 085102. [DOI] [PMC free article] [PubMed] [Google Scholar]
- 23.Cheng I-F, Senapati S, Basuray X and Chang S, Lab on a chip, 2010, 10, 828–831. [DOI] [PubMed] [Google Scholar]
- 24.Sun G, Senapati S and Chang H-C, Lab on a chip, 2016, 16, 1171–7. [DOI] [PMC free article] [PubMed] [Google Scholar]
- 25.Sun G, Pan Z, Senapati S and Chang H-C, Phys. Rev. Applied, 2017, 7, 064024. [DOI] [PMC free article] [PubMed] [Google Scholar]
- 26.Slouka Z, Senapati S, Yan Y and Chang HC, Langmuir, 2013, 29, 8275–8283. [DOI] [PubMed] [Google Scholar]
- 27.Yossifon G and Chang HC, Physical Review Letters, 2008, 101, 1–4. [DOI] [PubMed] [Google Scholar]
- 28.Yossifon G and Chang YC, Physical Review Letters, 2009, 103, 1–4. [DOI] [PubMed] [Google Scholar]
- 29.Haugland RA, Siefring S, Lavender J and Varma M, Water research, 2012, 46, 5989–6001. [DOI] [PubMed] [Google Scholar]
- 30.de Carvalho SJ, Metzler R and Cherstvy AG, Soft Matter, 2015, 11, 4430–4443. [DOI] [PubMed] [Google Scholar]
- 31.Kim Y-K, Yeo J, Kim B, Ha M and Kim VN, Mol. Cell, 2012, 46, 893–895. [DOI] [PubMed] [Google Scholar]
- 32.Monleau M, Bonnel S, Gostan T, Blanchard D, Courgnaud V and Lecellier C-H, BMC Genomics, 2014, 15, 395. [DOI] [PMC free article] [PubMed] [Google Scholar]
- 33.Stellwagen NC, Gelfi C and Righetti PG, Biopolymers, 1997, 42, 687–703. [DOI] [PubMed] [Google Scholar]
- 34.Grossman PD and Soane DS, Journal of Chromatography A, 1991, 559, 257–266. [DOI] [PubMed] [Google Scholar]
- 35.Slater GW, Kenward M, McCormick LC and Gauthier MG, Current Opinion in Biotechnology, 2003, 14, 58–64. [DOI] [PubMed] [Google Scholar]
- 36.Grass K and Holm C, J. Phys.: Condens. Matter, 2008, 20, 494217. [DOI] [PubMed] [Google Scholar]
- 37.Quist J, Janssen KGH, Vulto P, Hankemeier T and van der Linden HJ, Anal. Chem, 2011, 83, 7910–7915. [DOI] [PubMed] [Google Scholar]
- 38.Quist J, Vulto P, van der Linden H and Hankemeier T, Anal. Chem, 2012, 84, 9065–9071. [DOI] [PubMed] [Google Scholar]
- 39.Marczak S, Senapati S, Slouka Z and Chang HC, Biosensors and Bioelectronics, 2016, 86, 840–848. [DOI] [PubMed] [Google Scholar]
- 40.Schrader C, Schielke A, Ellerbroek L and Johne R, J Appl Microbiol, 2012, 113, 1014–1026. [DOI] [PubMed] [Google Scholar]
- 41.Chun M-S and Lee I, Colloids and Surfaces A: Physicochemical and Engineering Aspects, 2008, 318, 191–198. [Google Scholar]
- 42.Walker HK, Hall WD and Hurst JW, Eds., Clinical Methods: The History, Physical, and Laboratory Examinations, Butterworths, Boston, 3rd edn., 1990. [PubMed] [Google Scholar]
- 43.Ramshani Z, Zhang C, Richards K, Chen L, Xu G, Stiles BL, Hill R, Senapati S, Go DB and Chang H-C, Commun Biol, 2019, 2, 1–9. [DOI] [PMC free article] [PubMed] [Google Scholar]
- 44.Taller D, Richards K, Slouka Z, Senapati S, Hill R, Go DB and Chang H-C, Lab Chip, 2015, 15, 1656–1666. [DOI] [PubMed] [Google Scholar]
Associated Data
This section collects any data citations, data availability statements, or supplementary materials included in this article.


