Introductory paragraph:
Relapse after allogeneic hematopoietic cell transplantation (HCT) is the leading cause of death in acute myeloid leukemia (AML) patients entering HCT with poor-risk features.1–3 When HCT does produce prolonged relapse-free survival (RFS), it commonly reflects graft-versus-leukemia (GVL) effects mediated by donor T cells reactive with antigens on leukemic cells.4 As graft T cells have not been selected for leukemia-specificity and frequently recognize proteins expressed by many normal host tissues, GVL is often accompanied by morbidity and mortality from graft-versus-host disease (GVHD).5 Thus, AML relapse risk might be more effectively reduced with T cells expressing receptors (TCRs) that target selected AML antigens.6 We therefore isolated a high-affinity Wilms’ Tumor Antigen 1-specific TCR (TCRC4) from HLA-A2+ normal donor repertoires, inserted TCRC4 into Epstein Bar Virus-specific donor CD8+ T cells (TTCR-C4) to minimize GVHD risk and enhance transferred T cell survival,7,8 and infused these cells prophylactically post-HCT into 12 patients ( ). RFS was 100% at a median of 44 months following infusion, while a concurrent comparative group of 88 patients with similar risk AML had 54% RFS (p=0.002). TTCR-C4 maintained TCRC4 expression, persisted long-term, and were polyfunctional. This strategy appears promising for preventing AML recurrence in individuals at increased risk of post-HCT relapse.
One-Sentence Summary:
Donor-derived, EBV-specific CD8+ T cells engineered to express a high-affinity WT1-specific TCR established persistent T cell responses that safely prevented post-HCT relapse in patients with high-risk AML.
Introduction
To identify targetable antigens in AML, we evaluated leukemic stem cells for differentially expressed genes that promote the leukemic phenotype.9 Wilms’ Tumor Antigen 1 (WT1) is a non-polymorphic intracellular protein that promotes proliferation and oncogenicity in AML, is over-expressed 10–1000× in AML, including leukemic stem cells, compared to normal CD34+ cells.9,10 Although essential during embryogenesis, physiologic WT1 expression is limited to low levels in a few adult tissues, predominantly kidney podocytes, mesothelial lining cells and hematopoietic CD34+ stem cells.11 Based on similar over-expression in other malignancies, WT1 was identified as a high-priority antigen target by the NCI.12
The binding affinity of a TCR for its target antigen largely determines the avidity of the T cell carrying that TCR; i.e., its ability to mediate anti-tumor effector functions.13 In a prior clinical study, we demonstrated direct anti-leukemia activity of WT1-specific CD8+ T-cell clones transferred post-HCT.14 Although the highest avidity T-cell clones were selected from each patient’s HLA-matched donor, most endogenous WT1-specific T cells were of low avidity. To increase potency in the first-in-man, anti-WT1 TCR study described here, we screened many donors to identify a high affinity, HLA-A*0201+ (HLA-A2)-restricted WT1-specific TCR (denoted TCRC4) that could impart consistently high avidity for WT1-expressing targets.15
Challenges for TCR-targeting an overexpressed self-antigen in the post-HCT setting include potential on-target, off-tissue toxicity mediated by the introduced TCR, and alloreactivity mediated by endogenous donor TCRs, as previously observed with donor lymphocyte infusions.4 To minimize the first risk, TCRC4 was purposefully isolated from the peripheral repertoire of a healthy HLA-A2+ donor, guaranteeing the TCR had passed thymic negative selection and did not mediate a peripheral autoimmune process.16 To decrease the likelihood of an endogenous TCR inducing GVHD,15 we used donor Epstein Barr virus (EBV)-specific cells, which can be readily isolated from most HCT donors.17
Post-transfer T-cell persistence is necessary to maintain immune responses that can achieve eradication and/or prevent late leukemia recurrences.18 In our previous trial, most selected T-cell clones had been extensively expanded and were terminally differentiated, with limited replicative capacity, and persisted for less than 14 days in vivo.14 By TCR-transducing donor cells, limited expansion is needed to achieve necessary cell doses, and EBV-specific substrate cells are naturally enriched for central memory T cells (TCM),7 which are predicted to have enhanced in vivo persistence after transduction.8,19
Results
EBV-specific TTCR-C4 demonstrate anti-tumor/anti-viral activity ex vivo.
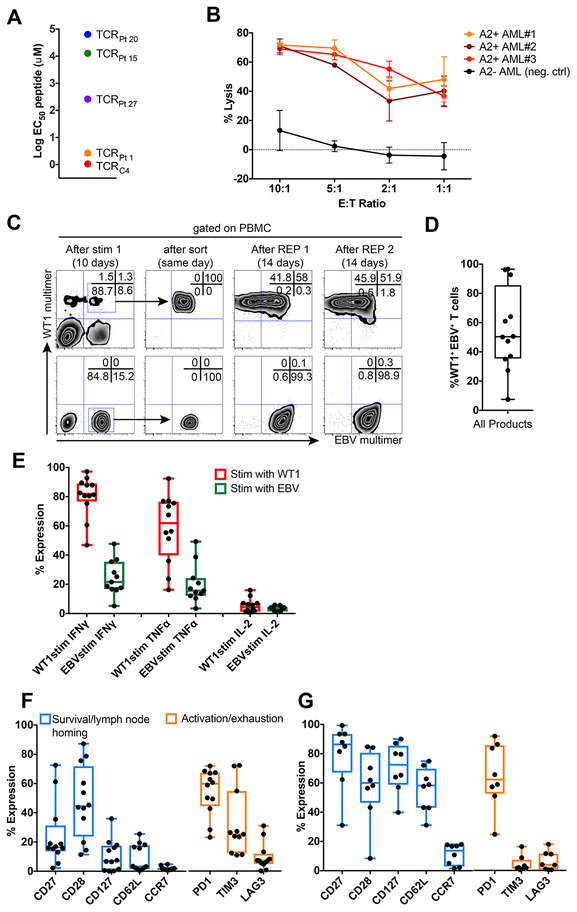
The avidity of TTCR-C4 was comparable to the highest avidity endogenous WT1-specific CD8+ T-cell clones infused in our previous study (Figure 1A).14 TTCR-C4 also efficiently killed fresh leukemia cells (Figure 1B). TCRC4 expression was maintained in transduced cells after repeated cycles of in vitro expansion, whereas the endogenous EBV-specific TCR was selectively down-regulated in a fraction of TTCR-C4 (Figure 1C). This likely resulted from enhanced expression of the codon-optimized TCRC4, regulated by the strong murine stem cell virus (MSCV) promoter, out-competing endogenous TCRs for limiting CD3 complexes required for membrane expression20 (Figure 1D). TTCR-C4 produced significantly more IFNγ, TNFα and IL2 in response to stimulation with WT1 peptide, compared to EBV peptide (Figure 1E, Supplementary Figure 1). After in vitro expansion, TTCR-C4 expressed molecules found in TCM and associated with survival and self-renewal, including CD28,21 CD2722 and CD127,23 but <20% expressed the TCM-associated lymph node-homing molecules CD62L and CCR7.24 TTCR-C4 also expressed activation/inhibitory receptors, including PD1, CD160 and LAG3 (Figure 1F, Supplementary Figure 2).25 By contrast, EBV-specific T cells that were isolated from donor leukaphereses by tetramer binding (tet+) to serve as TCRC4-transduction substrates expressed CD62L and CCR7 (median 58.3 and 13.7%); these cells expressed few activation/inhibitory receptors, except for PD1, likely reflecting a stably transmitted TCM phenotype acquired during persistent viral infection, previously reported not to interfere with function (Figure 1G).26
Figure 1: Phenotypic and functional characteristics of EBV-specific donor-derived TTCR-C4.
(A) Mean effective concentrations of peptide required to achieve 50% lysis (EC50) of WT1 peptide-pulsed TAP-deficient HLA-A2+ B-cell lymphoblastoid cells (T2 B-LCL) by Jurkat-Nur77 T cells transduced with TCRs isolated from infused clonal cell products (from our previous study) and TTCR-C4. (B) Lysis of 3 independent HLA-A2+ (red shades) primary leukemias versus a HLA-A2− (black) primary leukemia by donor TTCR-C4 at decreasing effector to target (E:T) ratios. For each independent leukemia, the median (dots) and standard error (bars) of triplicate values (n=3) are shown. (C) Specific downregulation of the endogenous EBV-specific TCR after TCRC4 transduction during the product generation process shown for a representative patient (Pt 10). These experiments were repeated >3 times with similar results. Binding of TCRC4-transduced (top panels) and non-transduced EBV-specific cells (lower panels) to WT1 (y axis) and EBV (x axis) tetramers before (left panels) or immediately after day 7 sorting (second to left panels) and after two rounds of expansion with anti-CD3/CD28 stimulus (right-most panels). (D) Percent of WT1-tet+ TTCR-C4 that also bound EBV tetramer, for infused products (n=12). (E) Percent of WT1 tet+ TTCR-C4 within the infusion products (n=12) that produced IFNγ, TNFα or IL-2 in response to WT1126–134 (red, n=12 individual values) and EBV BMLF1280–288 (green, n=11 individual values) peptides. (F) Expression of CD27, CD28, CD127, CD62L, CCR7, PD-1 (n=12 individual values), TIM3 (n=11) and LAG3 (n=12) in infused TTCR-C4 products (n=12), and (G) EBV-specific T cells in donor leukapheresis (n=8). For all figures: box and whisker plots include range (whiskers), interquartile range (box), median (horizontal line) and all individual values.
TTCR-C4 prevent AML recurrence in patients at increased risk of post-HCT relapse.
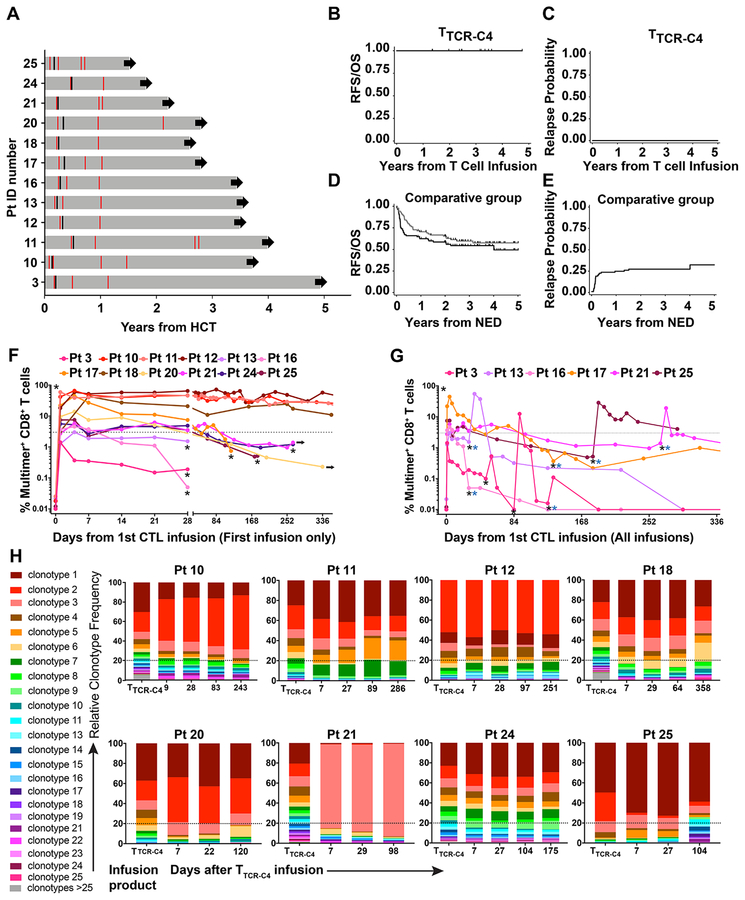
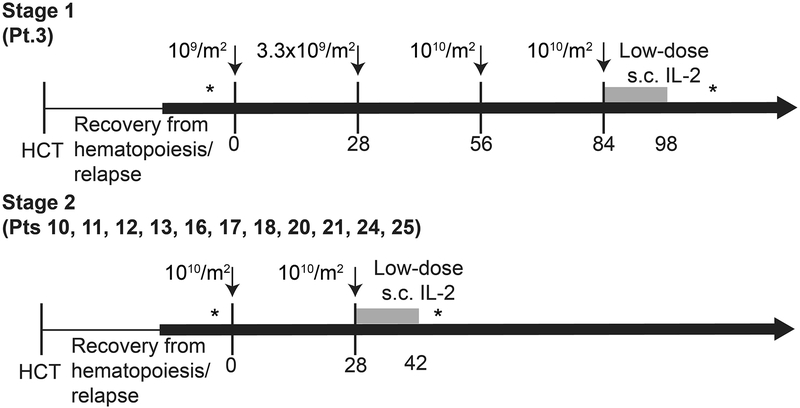
Twelve poor-risk patients (Table 1, Supplementary Figure 3), with no evidence of disease (NED) at ~28 days post-HCT and prior to subsequent infusions,27–29 received 21 infusions (Extended Data 1, 2). All received at least one infusion of 1010/m2 EBV-specific substrate TTCR-C4 (maximum target dose); seven patients with limited in vivo T-cell persistence received a second infusion of 1010/m2 21–797 days after the first infusion (see Online Methods). Three and two patients, respectively, did not receive a second infusion due to maintaining TTCR-C4 frequencies above the safety threshold (3% of total CD8+ T cells) or to personal preference/convenience. AML status was assessed at least once post-TTCR-C4 infusion(s), and then as clinically indicated (Figure 2A). With a median follow-up of 44 months (range 21–57 months) following the first TTCR-C4 infusion, all 12 patients were NED at all post-TTCR-C4 bone marrow assessments and remained alive with no additional AML-specific treatment (Figure 2A–C).
Table 1:
Patient Characteristics.
| Pt | M/F | Age | AML Characteristics | AML WT1 expression* | Risk stratification by genetics3 | Treatment History | Disease status at HCT1 | Post-HCT Relapse Risk2 | Conditioning Regimen | Days between HCT and Last NED assessment** | Days between HCT and TTCR-C4 infusion | TTCR-C4 infusions received |
|---|---|---|---|---|---|---|---|---|---|---|---|---|
| 3 | M | 48 | Inv.16, trisomy 8,21,22 | Yes | intermediate | CR2 (Cytarabine/idarubicin induction lasting 1 year; cytarabine/idarubicin then decitabine/mitoxantrone/etoposide/cytarabine to achieve CR2) | CR | High | Flu/Bu (MA) | 66 | 70 | 4 |
| 10 | M | 74 | 5q- | Yes | adverse | CR1 after 2 inductions (ifosfamide/cisplatin/doxorubicin × 2 then 2 additional cycles) | CR | Intermediate | Flu, 2Gy TBI (NMA) | 28 | 47 | 1 |
| 11 | M | 59 | IDH1 codon 132 mutation, trisomy 8 | Yes | intermediate | CR1 after 3 inductions (cytarabine/idarubicin, High-dose cytarabine × 2 to achieve CR1) | Molecular MRD | Intermediate | Bu/Cy (MA) | 173 | 190 | 2 |
| 12 | F | 55 | FLT3-ITD, 3-way translocation (3,20,13)(p13;q11.2;q12), t(7;7) | Yes | adverse | Persistent MRD after induction/consolidation (cytarabine/idarubicin, high-dose cytarabine × 3). | Cytogenetic MRD | High | Bu/Cy (MA) | 109 | 110 | 1 |
| 13 | F | 59 | 11q23/MLLgene rearrangement | Yes | adverse | CR1 after 2 inductions (Ara-C/Idarubicin then mitoxantrone, etoposide) | CR | Intermediate | Bu/Cy (MA) | 65 | 74 | 2 |
| 16 | M | 65 | Secondary AML from JAK2+ MPN, duplication of 1q | Yes | intermediate | CR1 (G-CSF-cladribine, cytarabine and mitoxantrone, then cladribine/cytarabine consolidation) | Active relapse | High | Flu/Bu (MA) | 89 | 104 | 2 |
| 17 | M | 30 | 11q23/MLLgene rearrangement | Unavailable | adverse | CR1 (G-CSF/cladribine/cytarabine/mitoxantrone × 2) | CR | Intermediate | Flu/TBI/Thio (MA) | 92 | 127 | 2 |
| 18 | M | 47 | Inv.16 | Unavailable | favorable | CR2 (CR1 lasting 1 year with ifosfamide/cisplatin/doxorubicin; fludarabine/cytarabine/G-CSF, high-dose cytarabine consolidation; CR2 with G-CSF/cladribine/cytarabine/mitoxantrone/mylotarg) | CR | low | Bu/Cy (MA) | 82 | 84 | 1 |
| 20 | F | 77 | Mutated NPM1 | Yes | favorable | CR2 (CR1 lasting 1 year with cytarabine/idarubicin, high-dose cytarabine consolidation; Mylotarg) | CR | Intermediate | Flu, 2Gy TBI (NMA) | 84 | 120 | 1 |
| 21 | F | 59 | Complex cytogenetics (+4, +8, +13, +15, +16, +19, +22), FLT3-ITD | Yes | adverse | CR1 (cytarabine/idarubicin, high-dose cytarabine consolidation) | CR | High | Bu/Cy (MA) | 81 | 90 | 1 |
| 24 | M | 57 | Normal Karyotype | Yes | intermediate | CR2 (Cytarabine/idarubicin × 2 achieved CR1 lasting 6 months; G-CSF/cladribine/cytarabine/mitoxantrone) | Flow cytometric MRD | Intermediate | Bu/Cy (MA) | 173 | 175 | 2 |
| 25 | F | 67 | Secondary AML from MDS; 5q- | Yes | adverse | CR1 (G-CSF/cladribine/cytarabine/mitoxantrone, G-CSF/cladribine/cytarabine consolidation) | CR | Intermediate | Flu, 2Gy TBI (NMA) | 56 | 61 | 2 |
NED: No evaluable disease, MA: myelo-ablative, NMA: non-myelo-ablative; CR: complete remission, MRD: minimal residual disease, MDS: myelo-dysplastic syndrome; MPN: myelo-proliferative disease; TBI: total body irradiation, Flu: fludarabine, Bu: busulfan, Cy: cyclophosphamide, Thio: thiotepa.
Assessed by immunohistochemistry
Days between HCT and the bone marrow assessment immediately before TTCR-C4 infusions that confirmed NED status and triggered infusion on the Prophylactic Arm.
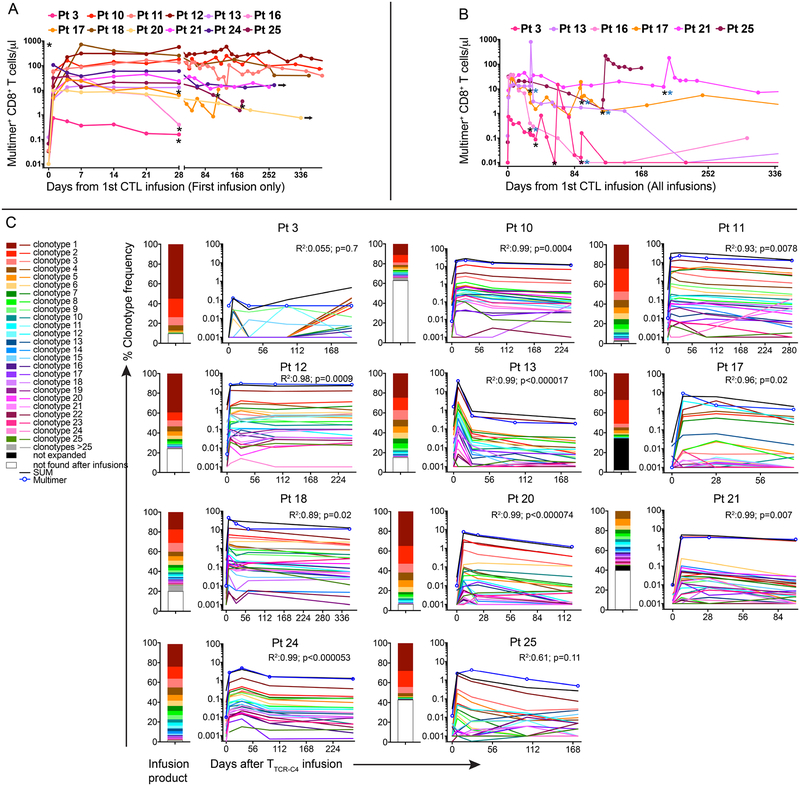
Figure 2: Prophylactic effect, kinetics of in vivo persistence and clonotype evolution of TTCR-C4 in vivo.
(A) Swimmer plot of the 12 patients who received TTCR-C4 prophylactically after HCT (grey horizontal bars) - timing of marrow assessments (red lines) prior to and after TTCR-C4-infusions, the first T cell infusion (black lines) and continuing follow-up in CR (black arrows) are shown. (B) Overall survival, relapse-free survival and (C) relapse probability for treated patients (n=12), from time of TTCR-C4 infusion. (D) Overall survival (black line), relapse-free survival (grey line) and (E) relapse probability for comparative-group patients (n=88), from time of documented NED. For accuracy, RFS/OS and relapse probabilities are shown in years from T cell infusion for treated patients and years from NED for TTCR-C4-treated and comparative-group patients respectively. (F) Percent tet+CD8+ T cells (left y-axis) in PBMCs collected after the first infusion for all patients (n=12), and (G) for selected patients (n=6) who received a second infusion within 365 days of their first. Pt 11’s second infusion is not depicted here. Black asterisks indicate TTCR-C4 infusion and blue asterisks indicate the infusion was followed by low-dose s.c. IL-2 (250,000 IU/m2 twice daily for 14 days). (H) Frequencies of individual clonotypes (y-axis) in infused cells (left-most bar-graph) and their frequencies in blood after infusions (bar-graphs to the right) for 8 select patients (Patients 10, 11, 12, 18, 20, 21, 24 and 25) whose tet+ frequency was detectable for >84 days. Dotted line indicates 20%.
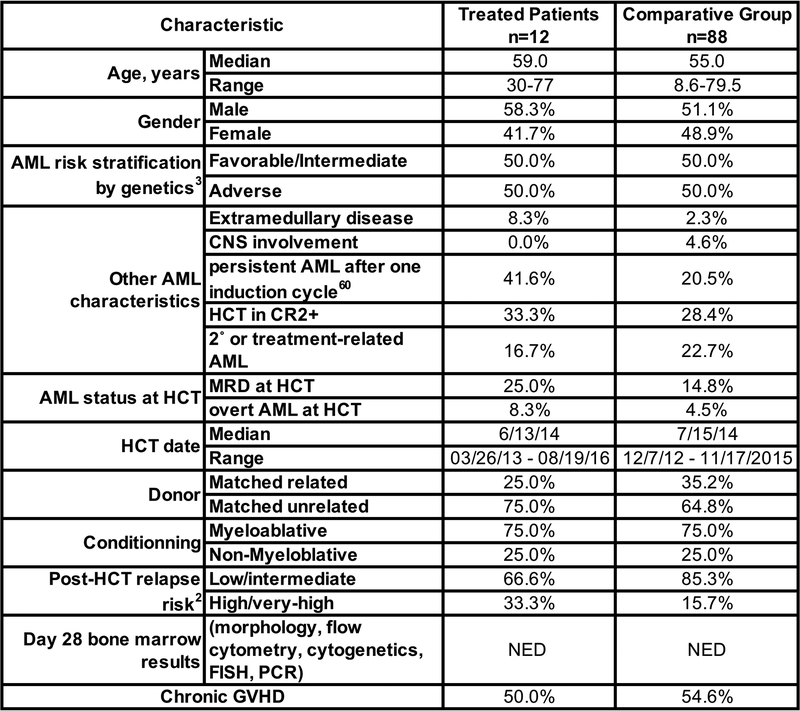
To provide clinical context for patient outcomes, we identified a comparator group of 88 AML patients with NED at day ~28 post-HCT marrow evaluation and who concurrently received HCT at our institution. Some of these patients also had a negative marrow evaluation at ~day 80. These patients had similar demographics, risk assessments and HCT characteristics as in our study cohort (Extended Data 3). Among the 88 comparative-group patients, there were 35 deaths (39%) and 25 relapses (28%), resulting in a total of 40 failures (relapse or death, 45%) (Figure 2D, E). The 3-year estimates of relapse-free survival (RFS), overall survival (OS), relapse and non-relapse mortality (NRM) following NED assessments among comparator patients were 54%, 60%, 28% and 18%, respectively, as compared to 100%, 100%, 0%, and 0% for TTCR-C4-treated patients. Using statistical methods described in Online Methods, the formal comparison yields p=0.002 for both OS and RFS, and p=0.01 for relapse. Hazard ratios were zero for the TTCR-C4 vs. comparative group, as there were no relapses or deaths in the TTCR-C4 group.
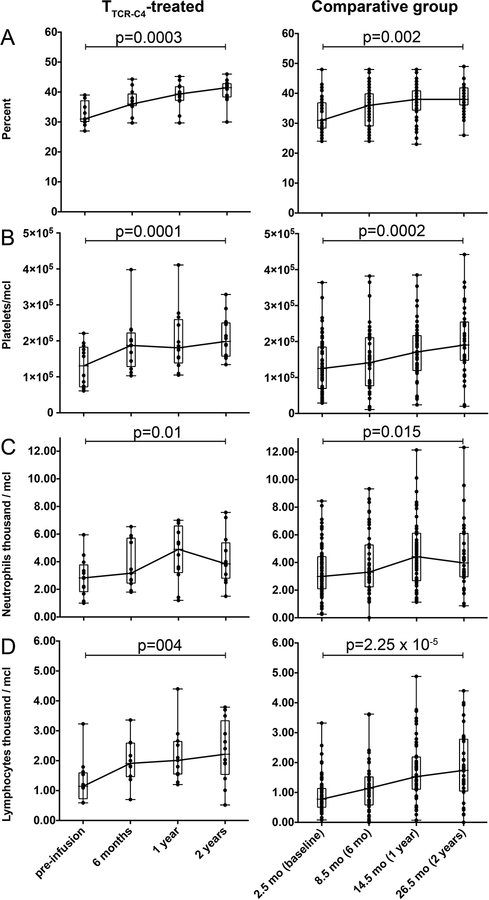
We sought to determine if non-TTCR-C4 factors might explain the encouraging results observed in TTCR-C4-treated patients. The risk of chronic GVHD, which can be associated with a lower relapse rate due to GVL effect,30 was not significantly different between TTCR-C4-treated and comparative group patients (55% and 61%, respectively; HR=0.78, 95% confidence interval: 0.33 to 1.84, p=0.57). All TTCR-C4 treated patients were necessarily HLA-A2+, but the subset of HLA-A2+ patients (44%) in the comparator group had a comparable OS (HR 0.72; 95% CI 0.37–1.44) and RFS (HR 0.91; 95% CI 0.49–1.71) to HLA-A2– patients, suggesting that the HLA-A2 allele did not drive improved outcomes. Post-HCT recovery of hematocrit, platelet, neutrophil and lymphocyte counts were similar for TTCR-C4-treated patients after their infusion, and for comparative group patients who remained alive after day 80 post-HCT (Extended Data 4).
No evidence of TTCR-C4 toxicity to normal tissues.
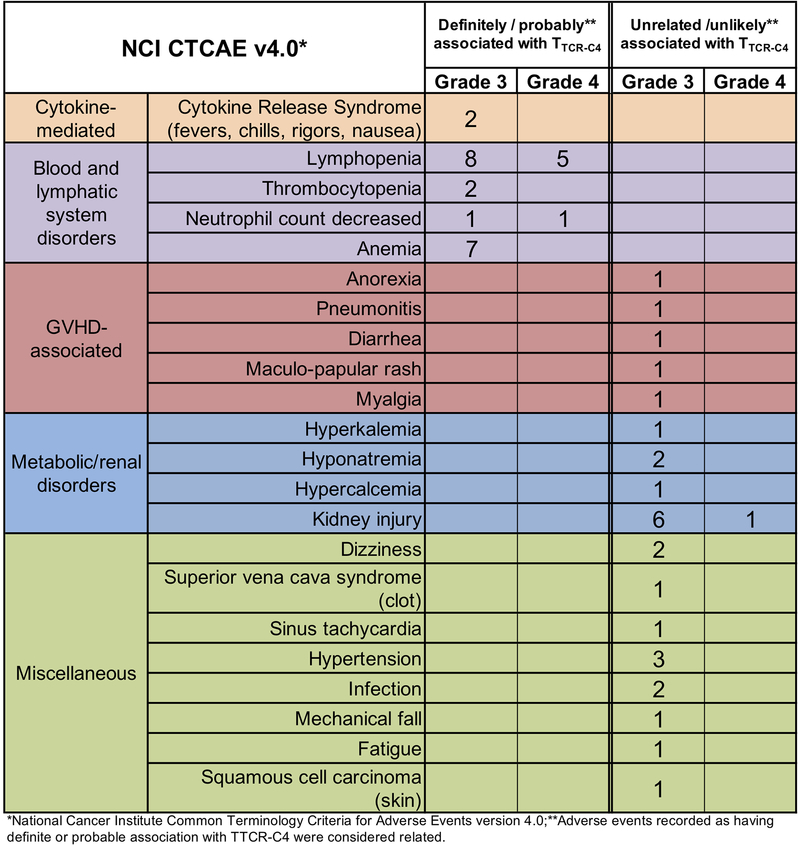
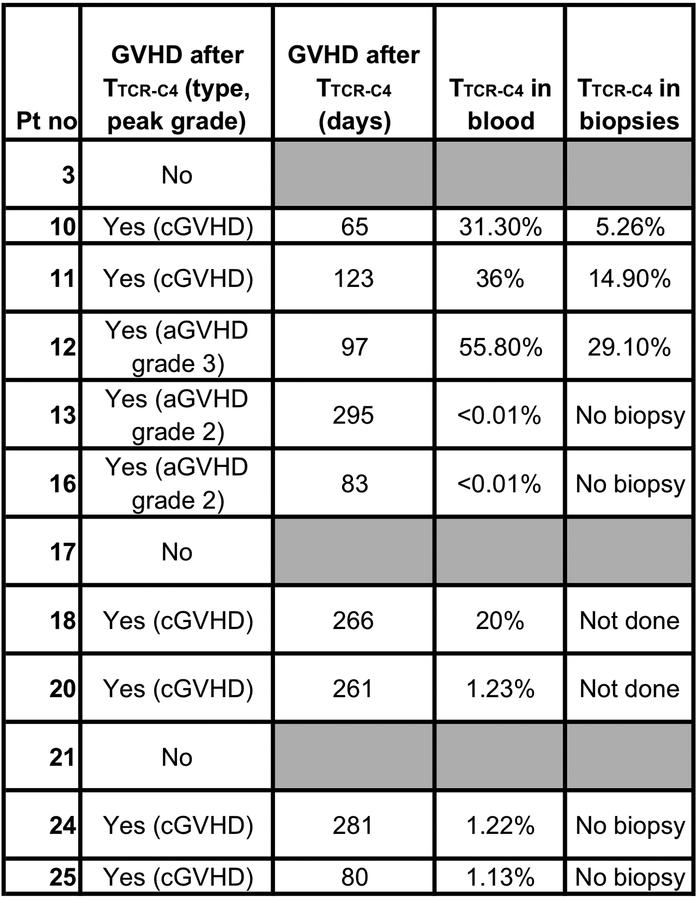
Infusions were well tolerated (Extended Data 5). Nine and nine patients exhibited Grade 1 to 2 GVHD before and after TTCR-C4 infusions, respectively (Extended Data 6). Only one TTCR-C4 treated patient (Patient 12) developed grade 3 acute GVHD with onset 97 days after the TTCR-C4 infusion. Biopsies obtained from patients 10 and 11 (chronic GVHD) and 12 (late acute GVHD) demonstrated lower frequencies of TTCR-C4 in affected tissue, compared to blood, suggesting the absence of preferential localization. GVHD also did not correlate with TTCR-C4 infusions, as onset occurred well after infusions (range 65–295 days, median 123 days). Thus, the signs of GVHD could not be associated with TTCR-C4, either temporally or by localization of transferred cells.
Oligoclonal EBV-specific TTCR-C4 persist post-infusion.
Only rare, pre-existing WT1-specific tet+ T cells were detected in peripheral blood mononuclear cells (PBMC; range 0.01% [limit of detection]-0.026%) (Figure 2F, Day 0). Nine of 12 patients achieved frequencies >3% of CD8+ T cells at day 28 after the 1st infusion, with 4/12 (Patients 10, 11, 12 and 18) maintaining this level for >365 days; these frequencies were associated with high absolute TTCR-C4 counts (Extended Data 7A). These four patients demonstrated TTCR-C4 frequencies >10% (range 11–51% tet+ CD8+ T cells) at 365 days post-infusion. Patients 10 and 12, with the longest follow-up, maintained frequencies of 29.2% and 49.7% at 912 and 1014 days, respectively. In nine of 12 patients, frequencies eventually dropped below 3%, and seven received a 2nd infusion (Figures 2G and Extended Data 7B). Patients 20 and 24 declined 2nd infusions. Infusions administered after patients had received the maximum targeted cell dose were followed by low-dose, subcutaneous IL-2, but no direct benefit was observed (Supplementary Figure 4). Unlike our previous observations,14 TTCR-C4 cell numbers in these patients with no detectable AML were not higher in bone marrow than in blood, suggesting absence of persisting AML cells (Supplementary Figure 5).
Infused TCRC4-transduced clonotypes (median 41, range 17–245) were identified by high-throughput TCRβ chain sequencing (HTTCS) for their endogenous EBV-specific TCR (Supplementary Table 1, Figure 7C).31 In eight patients who maintained responses in vivo for >84 days after one infusion, a median of 5.5 (range 1–9) infused clonotypes ultimately composed >80% of transferred cells detected at the last analysis timepoint (Figure 2H), suggesting most persistent responses were mediated by oligoclonal T cells. The persisting clonotypes were also the most frequent in the TTCR-C4 infusion products, suggesting preferential expansion during in vitro stimulation (Figure 2H, left column).
Persisting TTCR-C4 are functional, with phenotypic markers of long-lived memory cells.
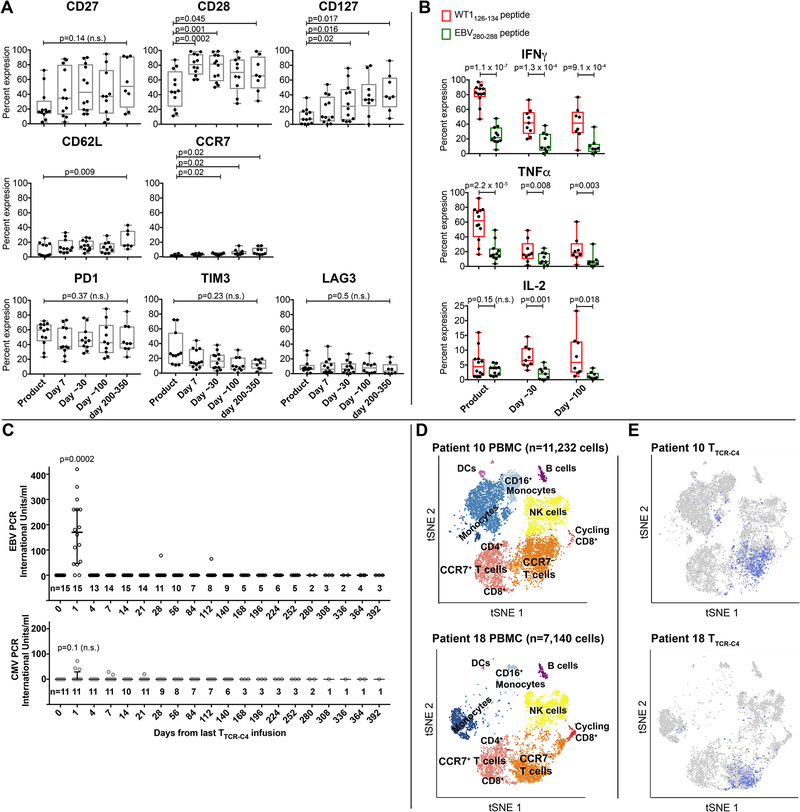
Compared to cell products at infusion, TTCR-C4 tet+ cells persisting in vivo expressed significantly higher levels of CD28, CD27 and CD12, CD62L and CCR7 (Figure 3A, top and middle panels).21–24 Persisting TTCR-C4 also maintained expression of PD1, but not TIM3 or LAG3 (Figure 3A, lower panels).25 TTCR-C4 demonstrated not only maintenance of in vivo function, but also greater responsiveness to the WT1 versus EBV peptide, both pre-infusion and at 30 and 100 days post-infusion (Figure 3B), likely reflecting the observed downregulation of the endogenous EBV-specific TCR (Figure 1D). As a fraction of the TTCR-C4 was still capable of signaling through the endogenous TCR, the transferred T cells might have been expanded in vivo by exposure(s) to EBV. Therefore, we assessed if EBV was detectable in patient sera after transfer (Figure 3C top panel). Surprisingly, low-level EBV viremia was detectable one day after the initial T-cell infusion (median 160 IU, range 0.1–420 UI), with no evidence of EBV reactivation at later time points; non-specific induction of CMV viremia was not detected (median 0.01, range 0.01–72) (Figure 3C lower panel, Supplementary Table 2). Thus, the transferred T cells may have targeted EBV reservoirs immediately after infusion, which may have also served as a vaccine stimulus to TTCR-C4.32
Figure 3. Phenotypic, functional characteristics and transcriptome of TTCR-C4 in vivo.
(A) Expression of CD27, CD28, CD127, CD62L, CCR7 (top row) and PD1, TIM3 and LAG3 (bottom row) (y-axis) on gated tet+ cells from TTCR-C4 products (n=12), immediately before infusion (n=12) and after 7 (n=12), ~30 (n=12), ~100 (n=10) and 200–300 (n=7) days in vivo. (B) Percent of WT1 tet+ TTCR-C4 within the infusion products (n=12), and after ~30 (n=9) and ~100 (n=8) days in vivo in patients who had >1% detectable TTCR-C4 tet+ cells, which produced IFNγ (top graph), TNFα (middle graph) and/or IL-2 (bottom graph) in response to 1μM WT1 peptide. Box and whisker plots include range (whiskers), interquartile range (box), median (horizontal line) and all individual values. Two-sided paired t-tests were used for statistical analysis. n.s.: not significant. (C) EBV (top graph) and CMV (bottom graph) viremia (IU/ml, y-axis) measured after each infusion for all patients (EBV) and in the subset in whom the patient and/or donor were CMV+ respectively (Supplementary Table 2). The number of values (n) obtained after infusions is indicated above the timepoint. Median and interquartile range are shown. Two-sided paired t-tests were used for statistical analysis. n.s.: not significant. (D) tSNE visualization of clustering of PBMC for selected Patient 10 (top) and Patient 18 (bottom) after 320 and 253 days in vivo, respectively. Cells clustered into populations, as indicated. Representative marker genes shown in Extended Data 9. (E) Location in clusters of CD8+ lymphocytes carrying the TCRC4 transgene (blue) for each respective patient. Consistent with flow cytometry data (Figure 3A), most TTCR-C4 clustered with endogenous CCR7– populations and a small subpopulation clustered with CCR7+ populations (for patients 10 and 18, respectively, 1.44% and 2.8% in the scRNAseq CCR7+ cluster, compared to 2.86% and 3.2% by flow cytometry). Note: T cells and monocytes sometimes form doublets attached to the same gel-bead, which can result in some TTCR-C4 clustering with monocytes.
Infused TTCR-C4 clonotypes populate multiple phenotypic subsets in vivo.
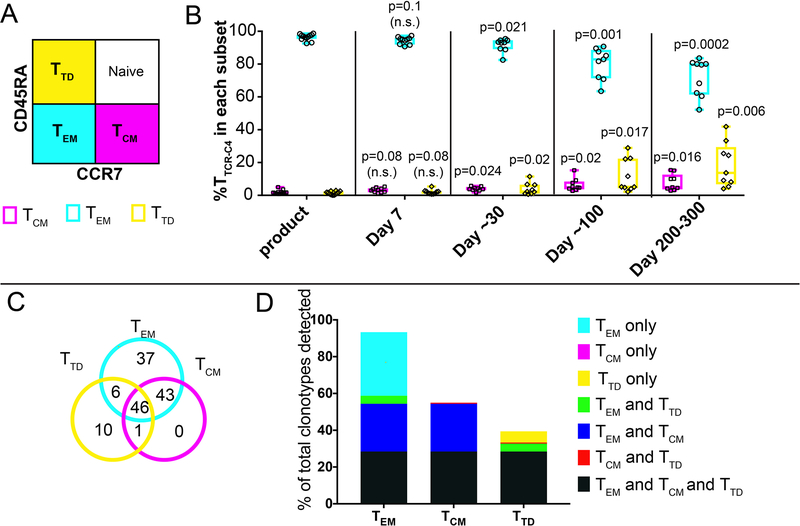
Using published criteria,33 infused clonotypes were classified largely (median 96.7%) within the CD45RA–CCR7– effector memory (TEM) subset (Extended Data 8A,B). However, persisting TTCR-C4 included TEM, terminally differentiated (TTD) and TCM subsets (median 83%, 5% and 4.8%, respectively, at 100 days). In four patients analyzed >84 days post-transfer, nearly all clonotypes (98.8%) of persisting WT1/tet+ TTCR-C4 cells in TCM fractions were also found in TEM (Extended Data 8C,D). These results are similar to the subset evolution we observed for melanoma- and HIV-specific T cells after adoptive transfer in patients,34,35 and as seen in a primate model,8 suggesting that TCM acquire effector differentiation markers during in vitro expansion while retaining imprinted TCM characteristics that are re-expressed in a subpopulation after transfer.
Long-term persisting TTCR-C4 are molecularly similar to endogenous CD8+ T cells.
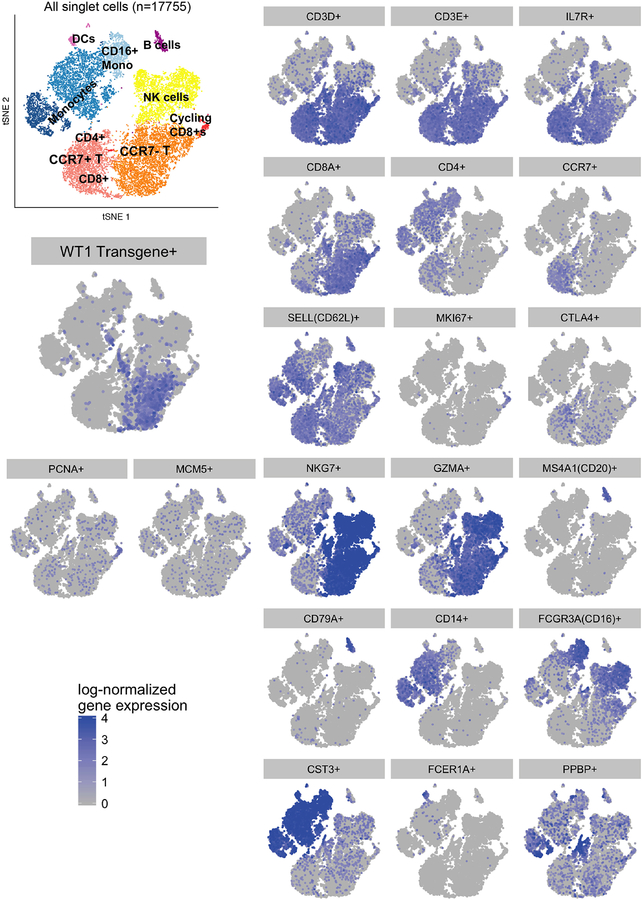
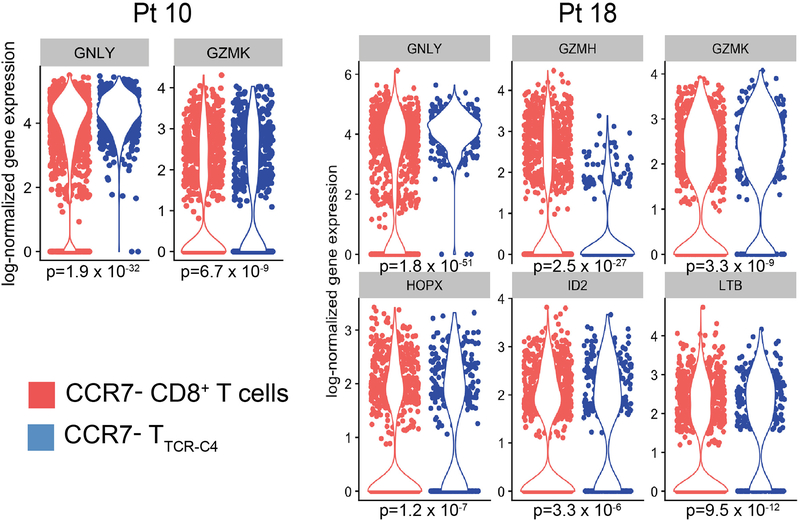
We used single cell RNA sequencing (scRNAseq) to probe the transcriptional profile of transferred TTCR-C4 subsets in vivo and determine if in vitro expansion and expression of TCRC4 altered the gene expression profile of the host cells. Unsupervised clustering analyses36 performed on PBMC from Patients 10 (11,232 cells) and 18 (7,140 cells) at 320 and 253 days after infusion, respectively, revealed nine distinct cell clusters visualized in a two-dimensional projection of t-distributed stochastic neighbor embedding (tSNE)37 (Figure 3D). Expression of transcripts for cluster-specific encoding genes showed common PBMC populations (Extended Data 9). TTCR-C4 were readily distinguished among CD8+ T cells by the codon-optimized TCRC4 sequence (Figure 3E). TTCR-C4 grouped with endogenous CD8+ T cells, revealing similar transcription profiles. Compared to endogenous CD8+ T cells, TTCR-C4 expressed higher transcript levels of only six genes (Extended Data 10). This suggests that transferred TTCR-C4 were not permanently significantly altered by the prior in vitro manipulation and re-infusion.
Discussion
Despite advances in cell therapy and synthetic biology, no broadly effective T cell therapy yet exists for AML.38 We and others previously showed that WT1 is a relevant target in AML9,12,14 and we isolated the high-affinity, WT1-specific TCRC4. When introduced into donor EBV-specific TCM-enriched T cells,7 resulting TTCR-C4 persisted post-transfer and prevented relapse in 12 poor-risk patients treated post-HCT.
TTCR-C4 infusions were well-tolerated, with no toxicity to tissues expressing physiologic levels of WT1, and no apparent promotion of GVHD, although we could not formally exclude participation of contaminating cells or cells expressing the WT1-specific TCR in patients who experienced post-infusion GVHD. We also observed no HCT-related deaths in the 12 TTCR-C4-treated patients. There is no purported role for TTCR-C4 to reduce HCT-related NRM and the lack of such events in our TCRC4-treated group could be due to the limited patient numbers.
Paradoxically, the inability to detect leukemia post-HCT in these patients who have all had sustained remissions made formal assessment of direct TTCR-C4 anti-tumor activity challenging. Therefore, to provide a clinical context and approximate how many TTCR-C4-treated patients would have been expected to relapse, we compared the treatment group to a concurrently transplanted similar group of patients using clinically-accepted pre-HCT risk stratification indices.1–3,39 The incidence of post-HCT chronic GVHD, was also similar in both groups, revealing that the treated group did not have a GVL advantage over the comparative group.30 Based on all these factors, the treated patients, none of whom have relapsed, would be expected to have a decreased RFS, comparable to patients in the comparative group, who had a RFS of 54% at 3 years.
TTCR-C4 introduced into EBV-specific donor CD8 T cells provided surprisingly high levels of engraftment and long-term persistence. A few “fit” clonotypes that preferentially expanded ex vivo ultimately represented the majority of cells persisting in vivo.31 Although infusion products were composed primarily of TEM, a limited population of TEBV-TCR-C4 clonotypes progressively accumulated as TCM in vivo. This is reminiscent of results in macaque models,8 suggesting expanded EBV-specific TTCR-C4 include cells that can establish long-term TCM-like cells post-transfer. The high-level persistence was obtained without pre-conditioning the patients, affirming lympho- and/or myelo-ablation is not an absolute requirement to establish long-term T-cell persistence.14 Thus, the inherent quality of individual infused cells appears to contribute to therapeutic efficacy.
The transfer of TEBV-TCR-C4 might also have distinct therapeutic advantages over other TCM populations, as these cells can potentially also respond to known viral antigens.40 Low-level EBV reactivation was detected immediately after transfer of TEBV-TCR-C4 in all evaluable patients, perhaps reflecting lysis of a reservoir of EBV-infected cells following encounter with infused activated TEBV, as opposed to spontaneous EBV reactivation. This target recognition and viral burst might have been sufficient to provide TEBV-TCR-C4 a survival advantage, analogous to what is expected from an intentional vaccination.32 This can be addressed in future studies by comparing outcomes after transfer of EBV-specific versus non-EBV-specific TCM populations.
Our results are very encouraging and warrant further study in larger randomized trials, to formally determine if TTCR-C4 can reproducibly reduce the risk of leukemic relapse in high-risk AML patients, after chemotherapy or HCT.
Online Methods:
Clinical protocol.
The trial was approved by the Fred Hutchinson Cancer Research Center (FHCRC) Institutional Review Board, the U.S. Food and Drug Administration, and the National Institute of Health Recombinant DNA Advisory Committee, and registered at clinicaltrials.org as . Patients (Pts) with ‘high-risk’ AML features and their respective fully HLA-matched (10/10) related or unrelated donors, expressing HLA A*0201 (HLA-A2) were eligible for treatment.
Patient Selection.
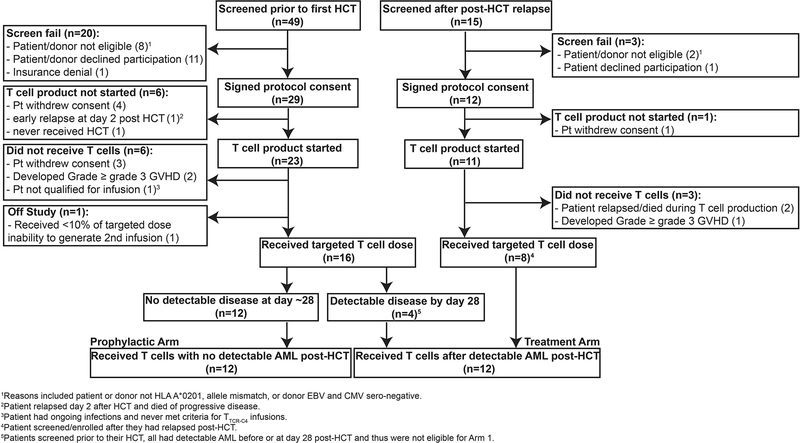
HLA-A2 genotype was confirmed by high-resolution typing,1 prior to pre-HCT formal enrollment. High-risk features included: AML with adverse genetic abnormalities,2 AML beyond 1st remission, primary refractory AML, therapy-related AML, AML arising in patients with antecedent hematologic disorders, and/or AML with evidence of minimal residual disease (MRD)/overt disease at time of HCT.2–4 Additionally, exclusion criteria included: active CNS disease, HIV seropositivity, grade ≥3 graft-versus-host disease (GVHD), and no available EBV-seropositive matched donor. Patients with no detectable disease post-HCT received treatment on the Prophylactic Arm discussed here, and patients with evidence of disease post-HCT received TTCR-C4 on the Treatment Arm (not described here) (Extended Data 1). The sample size for this study was not based on formal power calculations, but on feasibility and the potential to provide descriptive information, determine whether further study was warranted and reveal if the toxicity was acceptable.
Treatment plan.
Patients were eligible to receive a first infusion of TTCR-C4 only after demonstrating hematologic engraftment, absence of grade ≥3 GVHD, no evaluable disease (NED) by morphology, flow cytometry or molecular analyses on marrow assessments performed at day ~28 and within 3 weeks prior to the 1st infusion. The median time to last NED assessment prior to first TTCR-C4 infusion was day 83 (range, 28–173 days) post-HCT; the median time to receive the first TTCR-C4 infusion was day 97 (range, 47–190 days) post-HCT. Of note, Patients 17 and 20 declined repeat biopsies and performed their marrows 35 and 36 days respectively before T cell infusions. Patients could not be receiving ≥0.5 mg/kg prednisone and ≥1g per day mycophenolate mofetil. A second infusion was administered only if the frequency of TTCR-C4 was <3% of total peripheral CD8+ T cells (Extended Data 2). Patients 3, 11, 13, 16, 17, 21 and 25 received a second infusion respectively 28, 797, 28, 28, 119, 266 and 182 days after the 1st. Patients were monitored for toxicities, based on Common Toxicity Criteria v4.0 (https://ctep.cancer.gov/protocoldevelopment/electronic_applications/ctc.htm#ctc_40).
Comparative group selection and characteristics.
Patients who underwent HCT for AML during the study enrollment period and were not enrolled on the study protocol (reasons included HLA-A2 negative, participation in transplant protocols with relapse as endpoint,5 and declined participation), but who met criteria for treatment on the Prophylactic Arm (other than HLA-A2 expression) were consented on an observation protocol (FHCRC #999) and included in the comparison group. Inclusion was further limited to patients with absence of grade 3 GVHD before day 80, NED at their first (~28 days) and when available 2nd (~80 days) post-HCT marrows, corresponding to the time patients enrolled on the Prophylactic Arm generally became eligible to receive infusions (Extended Data 3). We estimated the post-HCT relapse risk for both groups based on pre-HCT AML and clinical characteristics using three different stratification algorithms currently used clinically to classify patients and predict outcomes: The European LeukemiaNet (ELN) risk-stratification based on AML cytogenetic and molecular factors,2 the post-HCT Disease Risk Index based on cytogenetics and AML stage,4 and the presence of MRD/active disease at the time of HCT.3 Using ELN criteria, patients with adverse risk have a predicted RFS of 36% (95% CI 17–43%) at 5 years post-HCT,6 and patients with favorable/intermediate risk have a RFS predicted at 56% (95% CI 40–73%). The TTCR-C4-treated and comparative patients were similar using this classification, with 50% of patients in both groups having the adverse risk classification and the remaining 50% having an intermediate/favorable risk. Using the post-HCT Disease Risk Index, patients are classified as high/very high and low/intermediate, and RFS is predicted at 6–18% and 40–56% respectively at 4 years.4 Of the treated and comparative group patients, 33.3% and 15.7% respectively fell in the high/very high classification, and 66.6% and 85.2% respectively fell in the low/intermediate classification, revealing that a larger proportion of treated patients had a higher risk of relapse when using the post-HCT Disease Risk Index. MRD entering transplant is associated with a RFS of 12% at 3 years.3 Again, a higher proportion of treated patients (25%) had MRD entering HCT compared to the comparative group (14%), revealing treated patients were proportionally more at risk for relapse than comparative group patients. A reduced-intensity pre-HCT conditioning regimen is also associated with a lower RFS, which is estimated at 60% at 2 years.7 For this factor, the groups were similar, as both had 25% of patients who received a reduced-intensity pre-HCT conditioning. Finally, the incidence of chronic GVHD, which is associated with a potentially beneficial graft-versus-leukemia effect,8 was similar in both groups (55% in TTCR-C4 and 61% in comparative group patients respectively), revealing the treated group did not have a GVL advantage over the comparative group.
Assessment of disease status.
Morphology, multiparameter flow cytometry,9 standard cytogenetics10 or genomic technologies11 were routinely performed on bone marrow aspirates that were obtained from all patients. Any level of residual disease was considered to indicate positivity for MRD.
Isolation of TCRC4 and lentiviral vector construction.
More than 1000 T cell clones from >50 HLA-A2+ healthy donors (of which 25 had participated in our previous study)12 were screened to identify high avidity WT1-specific clones. T cell lines recognizing WT1126–134 peptide (RMFPNAPYL) were generated for each donor, cloned by limiting dilution, and screened for high functional avidity for an HLA-A2+ TAP-deficient B-lymphoblastoid cell line [T2 B-LCL] pulsed with the WT1126–134 peptide, as previously described.12 The clone selected as TCR donor, C4 (TCRC4), demonstrated the lowest KD value for tetramer binding. TCRC4 Vα1.3 and Vβ17 TCR chains were isolated using Rapid Amplification of cDNA Ends-Polymerase Chain Reaction (RACE-PCR) and sequenced. Based on the wild-type sequences, the final construct was synthesized by GeneArt (Regensburg, Germany) in a codon-optimized format to promote high-level protein expression in human cells.13 The final construct was engineered to encode a single open reading frame consisting of the TCR β and TCRα chains, separated by a 2A element from the porcine teschovirus (P2A) to ensure coordinated gene expression.14,15 The construct was designed to incorporate complementary cysteine residues at positions 48 (Thr to Cys) and 57 (Ser to Cys) of the constant domains of the TCRC4 α and β genes, respectively, to enhance appropriate inter-chain pairing and discourage mispairing of TCRC4 chains with endogenous TCR chains.16 The TCRC4 gene construct was then inserted into the pRRLSIN.cPPT.MSCV/GFP.wPRE vector obtained from the lab of Richard Morgan after excising the green fluorescent protein (GFP) gene.15
Generation of TTCR-C4.
All ex vivo manipulations involving processing of products destined for infusion were performed in the cGMP Cell Processing Facility (CPF) of FHCRC. For ease and feasibility, the substrate CD8+ T cells for generating the TCRC4-transduced T cells (TTCR-C4) were obtained from an aliquot the G-CSF stimulated PBMC donation (mobilized leukapheresis) of allogeneic stem cell donors of patients enrolled in Protocol FHCRC #2498. Cells were stimulated with the HLA-A2-restricted EBV (EBV280–288 BMLF1 [GLCTLVAML]) peptide. On day +1 and day +2 of the stimulation, the responding cells were transduced using the pRRLSIN.cPPT.MSCV/TCRC4βP2ATCRC4α.wPRE lentiviral vector at a target multiplicity-of-infection of ≤3. Protamine sulfate (10 μg/mL), IL-2 (50 IU/mL), IL-21 (30 ng/mL), IL-7 (5 ng/mL), and IL-15 (1 ng/mL) were added, and the cells were centrifuged at 2,500 rpm for 90 minutes at 30°C, and then incubated overnight at 37°C. On day +12 (+/− 2) days of the stimulation cycle, CD8+ T cells specific for both WT1 and EBV were sorted by labeling with tetramers that bound selectively to the WT1-specific TCR (APC) or the EBV-specific TCR (PE) (FHCRC in-house production), using a clinical grade fluorescence-activated cell sorter (FACS) in the cGMP-grade CPF. Sorted double-positive cells (to meet specifications for further processing, the purity of sorted double-positive cells had to be >95%) were then stimulated once or twice using the Rapid Expansion Protocol.17 CTL products were freshly infused in 17 of 21 infusions. Alternatively, the cells were thawed and washed before infusion, for a total production time of 4–6 weeks. Quality control of the infused products included assessment of inserted lentiviral vector copy number per cell (≤5 copies/cell), envelope VSV-G DNA by qPCR as a surrogate marker for RCL (<10copies/50ng DNA), V β17 expression (≥30% of live cells) and binding to the WT1126–134 HLA-A2-restricted tetramer (≥30% of live cells).
Comparative avidity of TTCR-C4.
Jurkat-Nur77 T cells (Jurkat cells transduced with CD8α ® and mTomato fluorophor knocked in the Nur77 locus - gifted from Juno Therapeutics) were lentivirally transduced with TCRC4, or with TCRs isolated from infused WT1-specific clonal cell products from our previous study (Patients 1, 15, 20 and 27),12 and sorted to yield a uniformly tetramer positive (tet+) cell population. Sorted cells were expanded and then mixed 1:1 with T2 B-LCL pulsed with titrating doses of the HLA-A2 restricted WT1126–134 peptide. After 48 hours of incubation at 37°C, cells were analyzed by flow cytometry to determine the percentage of (Nur77) mTomato+ Jurkats for each sample. These data were fit to dose-response curves by non-linear regression using Graphpad Prism 7 (four parameter-variable slope, with the bottom and top of the curve constrained to 0 and 100, respectively), to determine half-maximal effective peptide concentration (EC50) for stimulation.
AML Cytotoxicity Assay.
TTCR-C4 cells were cultured with primary AML cells at the indicated E:T ratios in triplicates for 18 hours as previously described.18 Briefly, after the culture period, surviving AML cells were identified by staining for CD45, CD34, CD38, CD117, CD15, CD90, CD96, CD123, HLA-DR (BioLegend) and quantified with Flow Count beads (Molecular Probes). Percent killing was calculated by the formula: (Absolute number of AML targets in co-culture / Absolute number of AML targets in target only control well) × 100.
Immunohistochemistry (IHC).
WT1 IHC was performed by a College of American Pathologists (CAP) Clinical Laboratory Improvement Amendments (CLIA) certified laboratory with the standard clinical protocol. Paraffin-embedded core bone marrow biopsies or particle preparations were sectioned (4μM) and antigen retrieval performed by heat treatment in 10mM sodium citrate buffer (pH 6) before staining with DAKO mouse anti-WT1 monoclonal antibody (mAb) clone 6F-H2, at a 1:800 dilution (Supplementary Figure 3).
T cell tracking by WT1 peptide/HLA (pHLA) tetramers.
WT1 p/HLA-specific tetramers (produced by the FHCRC immune monitoring core facility) were used to detect TTCR-C4 in PBMCs collected after infusions, with a staining sensitivity of 0.01% of total CD8+ T-cells, as previously described.19
Clonotype identification and tracking by high throughput TCR β sequencing.
To identify clonotypes composing infused TTCR-C4, high-throughput TCRβ sequencing (HTTCS) analysis was performed on WT1/HLA-A2 pHLA tet+ cells from the infusion products to obtain >99% purity. As the TCRC4 sequence was codon-optimized, HTTCS could not identify the introduced WT1-specific TCR. Instead, HTTCS identified clonotypes based on the endogenous EBV-specific TCR sequence. To track the identified clonotypes, HTTCS was performed on whole PBMC obtained after transfer as described.20 Briefly, DNA was extracted from T cell products and sorted PBMC using Qiagen Maxi DNA isolation kits (QIAGEN Inc.). TCR β CDR3 regions were amplified and sequenced from 750ng of extracted DNA by Adaptive Biotechnologies Corp (Seattle, WA) using the ImmunoSEQ assay as previously described using “deep” resolution.21 Raw sequence data was filtered using the Adaptive bioinformatic website based on the TCR β V, D and J gene definitions provided by the International ImMunoGeneTics collaboration (IMGT)22, using the IMGT database (www.imgt.org ). Productive nucleotide sequences were used for all tracking experiments. The limit of detection of HTTCS was set at 0.001% of all TCR reads, below which frequency could not be reliably determined.23 Only clonotypes present in the infusion products were tracked in PBMC obtained after infusions. However, clonotypes in the infusion product that were not detected in vivo after infusions and which did not undergo expansion throughout the ex-vivo culture process, signifying bystander clonotypes, were eliminated for further analysis.20 The frequency of each clonotype detected by HTTCS is based on all TCR Vβ reads which include CD4+ and CD8+ T cells.
Phenotypic evolution of clonotype subsets.
To determine whether the individual infused clonotypes with TEM characteristics had evolved in vivo to include alternate subsets (TCM or TTD), PBMC obtained at ~100 days from Pts. 10, 11, 12 and 24, who were selected based on TTCR-C4 persistence and sample availability, were flow-sorted for TEM, TCM or TTD tet+ cells, and the clonotypes comprising each subset were determined.
Flow cytometry.
TTCR-C4 in infusion products and PBMCs post-transfer were identified by binding to the APC dye-labeled HLA-A2/WT1126–134 tetramer (FHCRC in-house production), and analyzed by flow cytometry after staining with fluorochrome-conjugated mAbs to CD16 (PE-Cy5 clone 3G8, Becton Dickinson), CD19 (PE-Cy5 HIB19, Becton Dickinson) (dump channel), CD8 (Qdot 605 clone 3B5, Life Technologies), CD28 (BV421clone CD28.05, Biolegend), CD27 (FITC clone M-T271, Biolegend), CD127 (IL7Rα) (BV650clone A019D5, Biolegend), CD62L (PE clone SK11 Becton Dickinson) and CCR7 (PECy7 clone 3D12, Becton Dickinson) (memory markers), and PD1 (BV421 clone EH12,2H7), TIM3 (PE clone 344823, R&D Systems), LAG3 (FITC Clone 874525, R&D Systems) (activation/exhaustion markers). A representative example of the initial gating algorithm is shown in Supplementary Figure 2. Of note, phenotypic studies were performed on bulk TTCR-C4 tetramer+ cells, but, since TCR clonotypes were determined by HTTCS following extraction of DNA from killed cells, it was not possible to determine the phenotypic characteristics of clonotype-specific TTCR-C4 cells.
Dual tetramer and intracellular cytokine staining.
Cryopreserved PBMCs were thawed and rested overnight in RPMI medium, supplemented with 10% fetal bovine serum (FBS) (R10). Intracellular cytokine staining and stimulations were performed using a 15-color staining panel, as previously described,24 with the following modifications: tetramers specific for HLA-A2/WT126–134 (APC) and HLA-A2/EBV280–288 (PE) were added at 1:1000 and 1:400, respectively, in 50μL R10 and incubated 30 minutes at room temperature before the addition of the stimulation cocktail containing either the WT1126–134, EBV280–288 peptide in R10 at a final peptide concentration of 1 μg/mL or the addition of R10 with an equivalent amount of dimethyl sulfoxide (DMSO) used to preserve the peptides (negative control). The staining panel was modified to accommodate the addition of the PE and APC tetramers, by excluding IL-21, CD56 and CXCR5, changing IL-2 to PE-dazzle 594 (clone MQ1–17H12, Biolegend) and adding granzyme B on alexa 700 (clone GB11, BD Biosciences). Cells were analyzed on an LSRII instrument (Becton Dickinson), using FACS-Diva software v 8.0.1. The resulting flow cytometry data was analyzed using FlowJo v9.9.4 (Treestar). Percent cytokine expression (% of tetramer+ cells that are both cytokine+ and tetramer+ in the DMSO only sample [negative control]) was calculated for each sample. Percent tetramer+cytokine+ cells in the presence of DMSO without peptide varied among samples from 0–2.27% with a median of 0.745%. A representative example of the initial gating algorithm is shown in Supplementary Figure 1.
Serum EBV and CMV quantification.
EBV PCR: Primers specific for the EBER gene were developed at the FHCRC.25 The limit of quantitative detection (the minimum virus level that gives a positive result in 95% of replicates) is 250 IU/mL (2.40 log IU/mL). Quantitative results less than 250 IU/mL are described as very low positive. CMV PCR: Primers specific for the UL123 and gB genes were developed at the FHCRC.26 The limit of quantitative detection (the minimum virus level that gives a positive result in 95% of replicates) is 20 IU/mL (1.3 log IU/mL). Quantitative results less than 20 IU/mL are described as very low positive. Results for 21 infusions total, 15 of which could be assessed in patients who had sufficient post-infusion material available for analysis are shown in Figure 3C.
Single Cell RNA Sequencing (scRNAseq).
Cell were thawed, washed and labelled in a single fashion using the 10× Genomics 3’ Chromium v2.0 platform as per manufacturer’s instructions. Library preparation was performed as per manufacturer’s protocol with no modifications. Library quality was confirmed by Agilent 2200 TapeStation high sensitivity (evaluates library size), qubit (evaluates dsDNA quantity), and KAPA qPCR analysis v. 4.14 (KAPA Biosystems, evaluates quantity of amplifiable transcript). Samples were mixed in equimolar fashion and sequenced on an Illumina HiSeq 2500 rapid run mode according to standard 10× genomics protocol.
Computational Analysis for scRNAseq transcriptome alignment, barcode assignment and UMI counting.
The Cell Ranger Single-Cell Software Suite (v2.0.0) was used to perform sample demultiplexing, barcode processing and single-cell 3’ gene counting (http://10xgenomics.com/). First, raw base BCL files were demultiplexed using the Cell Ranger mkfastq pipeline into sample-specific FASTQ files. Second, these FASTQ files were individually processed using the Cell Ranger count pipeline. Reads, which contain cDNA inserts, were aligned to the hg38 human reference genome (Ensembl) and the known transgene codon-optimized sequence using STAR.27 Aligned reads were then filtered for valid cell barcodes and unique molecular identifiers (UMIs). Cell barcodes with 1-Hamming-distance from a list of known barcodes were examined. UMIs with sequencing quality score > 10% and not homopolymers were retained as valid UMIs. A UMI with 1-Hamming-distance from another UMI with more reads, for a same cell and a same gene was corrected to this UMI with more reads. The default estimated number of cells used were 7,500 and 10,000 cells for Patients 10 and 18 respectively.
Data normalization.
Samples from patients 10 and 18 were aggregated for data normalization. UMI normalization was performed as proposed by Seurat.28 First, only genes with at least one UMI count detected in at least 3 cells were kept (16,639 genes from 18,493 cells). Then, for each cell, a library-size normalization was performed. UMI counts were divided by the total number of UMI in each cell followed by a multiplication by 10,000. Data were then natural-log transformed before analysis using Seurat and MAST. Regressing uninteresting sources of variation can improve downstream analyses.29 We used the specific ScaleData R function implemented by Seurat on the normalized matrix to remove technical effects due to the library size (number of UMIs - highly correlated with the number of genes detected) and the percentage mitochondrial gene content, as proposed by Seurat. As high mitochondrial gene expression might be suggestive of low-quality libraries,30 the corrected gene-barcode matrix was used as input for downstream analyses (dimension reduction and clustering). In the Model-based Analysis of Single Cell Transcriptomics (MAST), the normalized gene-cell barcode matrix was used as input, the number of genes detected was taken into account as proposed.31 We elected to filter out 121 outlier cells having unique gene counts less than 250, percentage of mitochondrial genes more than 15% or more than 20,000 UMIs, discarding <1% of cells. The percentage of UMI mapping to mitochondrion-related genes is a common scRNAseq quality metric - high mitochondrial gene expression is suggestive of low-quality libraries.30
Statistical Methods:
1. Statistical methods for comparison of treated and comparative group patient outcomes.
Cox regression was used to compare risk of overall mortality and relapse, failure for relapse-free survival (earliest of relapse or death), and chronic GVHD between patients who received TTCR-C4 and comparative patients who survived without relapse to ~day 28 or ~day 80. Time zero was time of HCT, and the data were considered to be left-truncated, with patients not entering the risk set until day 28 (n=18) or day 80 (n=70) for the comparative group patients, or the last NED marrow prior to T cell infusion for the treated group. Comparative patients NED both at ~day 28 and day 80 entered the risk set at day 80. To account for different T cell infusion times, a time-dependent covariate assumed a value of zero throughout for comparative group patients and a value of zero for the treated group until the time of T cell infusion, at which point the time-dependent covariate assumed a value of 1.32 For example, the patient who received a first infusion on day 190 was, for analysis purposes, evaluated as being in the comparative group up until day 190. This approach is a means to take into account lead-time (or immortal-time) bias that results from the fact that patients were evaluated for and who received TTCR-C4 did so at varying times (timing between HCT and NED assessment ranged from 28–173 days; timing between HCT and TTCR-C4 infusions ranged from 47–190 days), and hence they had lived without relapse long enough to receive TTCR-C4. Since there were no deaths or relapses in the T cell group, p-values for comparing groups for the outcomes mortality, relapse and relapse-free survival were estimated from the likelihood-ratio test. An effect size could not be calculated as there was no failures in the treated group. For chronic GVHD, the p-value from the regression model was estimated from the Wald test. Kaplan-Meier estimates of overall and relapse-free survival were calculated for the comparative group patients and cumulative incidence estimates used to summarize the probability of relapse (treating death without relapse as a competing risk) from time of NED assessment.
2. Statistical correlations between values obtained by HTTCS and tetramer binding (Extended Data 7).
Regression was performed on the log of the sum of clonotype frequencies obtained by HTTCS and log percent tet+ cells. Goodness of fit was evaluated with R2.
3. Paired two-sided T tests.
These are indicated on individual figures and were performed with the Graph-Pad prism 7 for Mac OSX, Excel or with the R-package for statistical analysis (http://www.r-project.org ).
4. Statistical analysis for scRNAseq data on patient PBMC.
Dimension reduction and clustering analyses were performed for both patients together. Seurat was used to compute dimension reduction and clustering analyses. First, principal component analyses (PCAs) were performed, using the top 1,736 variable genes (defined by log-mean expression values greater than 0.0125 and dispersion (variance/mean) greater than 0.5). Then, the top 10 PCs were selected for t-Distributed Stochastic Neighbor Embedding (tSNE) visualization for both patients. To determine the number of principal components to use, the Jackstraw procedure, elbow plot, and supervised analysis (PCHeatmap) were all explored, reassuringly all three yielded similar results. One thousand iterations of the tSNE algorithm (Barnes-Hut implementation) using a perplexity value of 30 and the top ten PCs were performed for both patients. We then classified the cells according to a graph-based clustering method as proposed by Seurat (FindClusters R function - share nearest neighbor (SNN) modularity optimization based clustering algorithm). A total of nine clusters were identified, most of which were well-distributed across both samples (Extended Data 9). For both patients, the annotation of the clusters was performed using the FindAllMarkers R function implemented by Seurat, which find makers for each of the identity classes. Cluster identity was confirmed by manual review. Cells corresponding to platelets, and platelet doublets (two cells in the same gel-emulsion complex) were removed (356 and 316 cells in patients 10 and 18 respectively), leaving a total of 9 clusters. Two populations of CD8+ T cells were present, mostly driven by CCR7 expression (Extended Data 9). Consistent with flow cytometry data (Figure 3, Extended Data 2), the majority of TTCR-C4 did not express CCR7 and thus differential expression analysis was only possible on the CCR7– clusters (orange and red clusters in Figure 3E) due to cell number. Differential expression analysis of transgenic T cells versus non-transgenic T cells was performed using the MAST R/Bioconductor package for analyzing single-cell gene expression data.31 MAST provides functionality for significance testing of differential expression using a Hurdle model, gene set enrichment and facilities for visualizing patterns in residuals indicative of differential expression. It is a two-part generalized linear model that simultaneously models the rate of expression over the background of various transcripts (logistic regression), and the positive expression mean (Gaussian). These tests are two sided and adjust for the bimodal nature of single cell RNA sequencing data. Differential expression was performed separately with the same approach for each patient, to account for patient-specific differences. The normalized gene-cell barcode matrix was used as input. The model included the cellular detection rate (CDR) as a covariate to correct for biological and technical nuisance factors that can affect the number of genes detected in a cell (e.g. cell size and amplification bias). Genes were declared significantly differentially expressed at a false discovery rate (FDR) of 5% and a fold-change > 1.3.
Additional Methods information can be found in the Life Sciences Reporting Summary associated with this submission.
Supplementary Material
Supplementary Figure 1: Gating strategy for intracellular assays.
Supplementary Figure 2: Gating strategy for surface stains.
Supplementary Figure 3: WT1 expression in leukemic cells.
Supplementary Figure 4: Effect of low-dose s.c IL-2 on post-infusion TTCR-C4 frequencies.
Supplementary Figure 5: TTCR-C4 do not preferentially localize to bone marrow in patients with no detectable AML.
Supplementary Table 1: Clonotype composition of infusion products.
Supplementary Table 2: Patient/donor EBV and CMV status.
Extended Data
Extended Data 1:
Flow diagram of patients enrolled on the clinical study.
Extended Data 2:
Treatment Plan.
Extended Data 3:
Characteristics of treated and comparative group patients.
Extended Data 4:
Normal count recovery after HCT and TTCR-C4 infusions.
Extended Data 5:
Adverse events.
Extended Data 6:
Timing and grade of GVHD observed after TTCR-C4 infusion.
Extended Data 7:
In vivo persistence kinetics and clonotype evolution of transferred post-HCT TTCR-C4.
Extended Data 8:
TEM Clonotypes composing infused TTCR-C4 differentiate into TCM and TTD in vivo (Figure).
Extended Data 9:
Identification of PBMC sub-populations.
Extended Data 10:
Significantly expressed genes in TTCR-C4.
Acknowledgements:
Drs. Elihu Estey and F. Milano for critical review of the manuscript. Fred Hutch Good Manufacturing Practice Cell Processing Facility for generating TTCR-C4, Immune Monitoring Laboratory for generating tetramers, Flow Cytometry Facility for providing instruments and assistance in flow cytometry assays, Program in Immunology, Immunotherapy Integrated Research Center, Seattle Cancer Care Alliance Immunotherapy Clinic staff and Kieu-Thu Bui RN for supporting the clinical protocol implementation.
Competing interests: A.G.C. has received support from Juno Therapeutics. P.D.G. is a consultant, has received support from, and had ownership interest in Juno Therapeutics. He consults and has ownership interest in Immune Design Corp, Innate Pharma, and FLX Bio. P.D.G., T.M.S., H.N.N. and the Fred Hutch have intellectual property related to TCRC4. A.G.C. and K.G.P. have received reagents from 10× Genomics. R.G. has received consulting fees from Juno Therapeutics, Takeda Pharmaceuticals, Infotech Soft, and has received support from Johnson and Johnson and Juno Therapeutics. The authors declare no other competing interests.
Funding:
P01CA18029-41 (P.G.), NIH-5K08CA169485 (A.G.C), Immunotherapy Integrated Research Center at FHCRC (A.G.C.), Damon Runyon (A.G.C), Guillot Family ZachAttacksLeukemia Foundation, Juno Therapeutics.
Footnotes
Data Availability:
All requests for raw and analyzed data and materials will be promptly reviewed by the Fred Hutchinson cancer Research Center to verify if the request is subject to any intellectual property confidential obligations. Patient-related data not included in the paper were generated as part of a clinical trial and may be subject to patient confidentiality. Any data and materials that can be shared will be released via a Material Transfer Agreement. PBMC scRNAseq data for Patients 10 and 18, as well as the R code to generate the tSNE plots using Seurat software packages, are available at the National Center for Biotechnology Information Gene Expression Omnibus (NCBI GEO), accession number GSE128933.
References:
- 1.Araki D, et al. Allogeneic Hematopoietic Cell Transplantation for Acute Myeloid Leukemia: Time to Move Toward a Minimal Residual Disease-Based Definition of Complete Remission? J Clin Oncol 34, 329–336 (2016). [DOI] [PMC free article] [PubMed] [Google Scholar]
- 2.Armand P, et al. Validation and refinement of the Disease Risk Index for allogeneic stem cell transplantation. Blood 123, 3664–3671 (2014). [DOI] [PMC free article] [PubMed] [Google Scholar]
- 3.Dohner H, et al. Diagnosis and management of AML in adults: 2017 ELN recommendations from an international expert panel. Blood 129, 424–447 (2017). [DOI] [PMC free article] [PubMed] [Google Scholar]
- 4.Parmar S, Fernandez-Vina M & de Lima M Novel transplant strategies for generating graft-versus-leukemia effect in acute myeloid leukemia. Curr Opin Hematol 18, 98–104 (2011). [DOI] [PubMed] [Google Scholar]
- 5.Kolb HJ, et al. Graft-versus-leukemia effect of donor lymphocyte transfusions in marrow grafted patients. Blood 86, 2041–2050 (1995). [PubMed] [Google Scholar]
- 6.Harris DT & Kranz DM Adoptive T Cell Therapies: A Comparison of T Cell Receptors and Chimeric Antigen Receptors. Trends Pharmacol Sci 37, 220–230 (2016). [DOI] [PMC free article] [PubMed] [Google Scholar]
- 7.Appay V, et al. Memory CD8+ T cells vary in differentiation phenotype in different persistent virus infections. Nat Med 8, 379–385 (2002). [DOI] [PubMed] [Google Scholar]
- 8.Berger C, et al. Adoptive transfer of effector CD8+ T cells derived from central memory cells establishes persistent T cell memory in primates. J Clin Invest 118, 294–305 (2008). [DOI] [PMC free article] [PubMed] [Google Scholar]
- 9.Ochsenreither S, et al. Cyclin-A1 represents a new immunogenic targetable antigen expressed in acute myeloid leukemia stem cells with characteristics of a cancer-testis antigen. Blood 119, 5492–5501 (2012). [DOI] [PMC free article] [PubMed] [Google Scholar]
- 10.Sugiyama H WT1 (Wilms’ tumor gene 1): biology and cancer immunotherapy. Jpn J Clin Oncol 40, 377–387 (2010). [DOI] [PubMed] [Google Scholar]
- 11.Ariyaratana S & Loeb DM The role of the Wilms tumour gene (WT1) in normal and malignant haematopoiesis. Expert Rev Mol Med 9, 1–17 (2007). [DOI] [PubMed] [Google Scholar]
- 12.Cheever MA, et al. The prioritization of cancer antigens: a national cancer institute pilot project for the acceleration of translational research. Clin Cancer Res 15, 5323–5337 (2009). [DOI] [PMC free article] [PubMed] [Google Scholar]
- 13.Stone JD & Kranz DM Role of T cell receptor affinity in the efficacy and specificity of adoptive T cell therapies. Frontiers in immunology 4, 244 (2013). [DOI] [PMC free article] [PubMed] [Google Scholar]
- 14.Chapuis AG, et al. Transferred WT1-Reactive CD8+ T Cells Can Mediate Antileukemic Activity and Persist in Post-Transplant Patients. Science translational medicine 5, 174ra127 (2013). [DOI] [PMC free article] [PubMed] [Google Scholar]
- 15.Stromnes IM, Schmitt TM, Chapuis AG, Hingorani SR & Greenberg PD Re-adapting T cells for cancer therapy: from mouse models to clinical trials. Immunol Rev 257, 145–164 (2014). [DOI] [PMC free article] [PubMed] [Google Scholar]
- 16.Coulie PG, Van den Eynde BJ, van der Bruggen P & Boon T Tumour antigens recognized by T lymphocytes: at the core of cancer immunotherapy. Nat Rev Cancer 14, 135–146 (2014). [DOI] [PubMed] [Google Scholar]
- 17.Styczynski J, et al. Impact of Donor Epstein-Barr Virus Serostatus on the Incidence of Graft-Versus-Host Disease in Patients With Acute Leukemia After Hematopoietic Stem-Cell Transplantation: A Study From the Acute Leukemia and Infectious Diseases Working Parties of the European Society for Blood and Marrow Transplantation. J Clin Oncol 34, 2212–2220 (2016). [DOI] [PubMed] [Google Scholar]
- 18.Busch DH, Frassle SP, Sommermeyer D, Buchholz VR & Riddell SR Role of memory T cell subsets for adoptive immunotherapy. Seminars in immunology 28, 28–34 (2016). [DOI] [PMC free article] [PubMed] [Google Scholar]
- 19.Wherry EJ, et al. Lineage relationship and protective immunity of memory CD8 T cell subsets. Nat Immunol 4, 225–234 (2003). [DOI] [PubMed] [Google Scholar]
- 20.Jones S, et al. Lentiviral vector design for optimal T cell receptor gene expression in the transduction of peripheral blood lymphocytes and tumor-infiltrating lymphocytes. Hum Gene Ther 20, 630–640 (2009). [DOI] [PMC free article] [PubMed] [Google Scholar]
- 21.Topp MS, et al. Restoration of CD28 expression in CD28- CD8+ memory effector T cells reconstitutes antigen-induced IL-2 production. J Exp Med 198, 947–955 (2003). [DOI] [PMC free article] [PubMed] [Google Scholar]
- 22.Ochsenbein AF, et al. CD27 expression promotes long-term survival of functional effector-memory CD8+ cytotoxic T lymphocytes in HIV-infected patients. J Exp Med 200, 1407–1417 (2004). [DOI] [PMC free article] [PubMed] [Google Scholar]
- 23.Kimura MY, et al. IL-7 signaling must be intermittent, not continuous, during CD8(+) T cell homeostasis to promote cell survival instead of cell death. Nature immunology 14, 143–151 (2013). [DOI] [PMC free article] [PubMed] [Google Scholar]
- 24.Gattinoni L, et al. A human memory T cell subset with stem cell-like properties. Nat Med 17, 1290–1297 (2011). [DOI] [PMC free article] [PubMed] [Google Scholar]
- 25.Legat A, Speiser DE, Pircher H, Zehn D & Fuertes Marraco SA Inhibitory Receptor Expression Depends More Dominantly on Differentiation and Activation than “Exhaustion” of Human CD8 T Cells. Frontiers in immunology 4, 455 (2013). [DOI] [PMC free article] [PubMed] [Google Scholar]
- 26.Utzschneider DT, et al. T cells maintain an exhausted phenotype after antigen withdrawal and population reexpansion. Nat Immunol 14, 603–610 (2013). [DOI] [PubMed] [Google Scholar]
- 27.Fang M, et al. Prognostic impact of discordant results from cytogenetics and flow cytometry in patients with acute myeloid leukemia undergoing hematopoietic cell transplantation. Cancer 118, 2411–2419 (2012). [DOI] [PMC free article] [PubMed] [Google Scholar]
- 28.Festuccia M, et al. Minimal Identifiable Disease and the Role of Conditioning Intensity in Hematopoietic Cell Transplantation for Myelodysplastic Syndrome and Acute Myelogenous Leukemia Evolving from Myelodysplastic Syndrome. Biol Blood Marrow Transplant 22, 1227–1233 (2016). [DOI] [PMC free article] [PubMed] [Google Scholar]
- 29.Zhou Y & Wood BL Methods of Detection of Measurable Residual Disease in AML. Current hematologic malignancy reports 12, 557–567 (2017). [DOI] [PubMed] [Google Scholar]
- 30.Storb R, et al. Graft-versus-host disease and graft-versus-tumor effects after allogeneic hematopoietic cell transplantation. J Clin Oncol 31, 1530–1538 (2013). [DOI] [PMC free article] [PubMed] [Google Scholar]
- 31.Chapuis AG, et al. Tracking the Fate and Origin of Clinically Relevant Adoptively Transferred CD8+ T Cells In Vivo. Sci Immunol 2(2017). [DOI] [PMC free article] [PubMed] [Google Scholar]
- 32.Klebanoff CA, et al. Determinants of successful CD8+ T-cell adoptive immunotherapy for large established tumors in mice. Clin Cancer Res 17, 5343–5352 (2011). [DOI] [PMC free article] [PubMed] [Google Scholar]
- 33.Champagne P, et al. Skewed maturation of memory HIV-specific CD8 T lymphocytes. Nature 410, 106–111 (2001). [DOI] [PubMed] [Google Scholar]
- 34.Chapuis AG, et al. HIV-specific CD8+ T cells from HIV+ individuals receiving HAART can be expanded ex vivo to augment systemic and mucosal immunity in vivo. Blood 117, 5391–5402 (2011). [DOI] [PMC free article] [PubMed] [Google Scholar]
- 35.Chapuis AG, et al. T-Cell Therapy Using Interleukin-21-Primed Cytotoxic T-Cell Lymphocytes Combined With Cytotoxic T-Cell Lymphocyte Antigen-4 Blockade Results in Long-Term Cell Persistence and Durable Tumor Regression. J Clin Oncol (2016). [DOI] [PMC free article] [PubMed] [Google Scholar]
- 36.Zheng GX, et al. Massively parallel digital transcriptional profiling of single cells. Nature communications 8, 14049 (2017). [DOI] [PMC free article] [PubMed] [Google Scholar]
- 37.Satija R, Farrell JA, Gennert D, Schier AF & Regev A Spatial reconstruction of single-cell gene expression data. Nat Biotechnol 33, 495–502 (2015). [DOI] [PMC free article] [PubMed] [Google Scholar]
- 38.Gill S Chimeric antigen receptor T cell therapy in AML: How close are we? Best Pract Res Clin Haematol 29, 329–333 (2016). [DOI] [PMC free article] [PubMed] [Google Scholar]
- 39.Tauro S, et al. Allogeneic stem-cell transplantation using a reduced-intensity conditioning regimen has the capacity to produce durable remissions and long-term disease-free survival in patients with high-risk acute myeloid leukemia and myelodysplasia. J Clin Oncol 23, 9387–9393 (2005). [DOI] [PubMed] [Google Scholar]
- 40.Pule MA, et al. Virus-specific T cells engineered to coexpress tumor-specific receptors: persistence and antitumor activity in individuals with neuroblastoma. Nat Med 14, 1264–1270 (2008). [DOI] [PMC free article] [PubMed] [Google Scholar]
- 41.Horowitz MM High-resolution typing for unrelated donor transplantation: how far do we go? Best Pract Res Clin Haematol 22, 537–541 (2009). [DOI] [PMC free article] [PubMed] [Google Scholar]
- 42.Deeg HJ, et al. Transplant Conditioning with Treosulfan/Fludarabine with or without Total Body Irradiation: A Randomized Phase II Trial in Patients with Myelodysplastic Syndrome and Acute Myeloid Leukemia. Biol Blood Marrow Transplant (2017). [DOI] [PubMed] [Google Scholar]
- 43.Hemmati PG, et al. Predictive significance of the European LeukemiaNet classification of genetic aberrations in patients with acute myeloid leukaemia undergoing allogeneic stem cell transplantation. Eur J Haematol 98, 160–168 (2017). [DOI] [PubMed] [Google Scholar]
- 44.Scholten KB, et al. Codon modification of T cell receptors allows enhanced functional expression in transgenic human T cells. Clin Immunol 119, 135–145 (2006). [DOI] [PubMed] [Google Scholar]
- 45.Dossett ML, et al. Adoptive immunotherapy of disseminated leukemia with TCR-transduced, CD8+ T cells expressing a known endogenous TCR. Mol Ther 17, 742–749 (2009). [DOI] [PMC free article] [PubMed] [Google Scholar]
- 46.Kuball J, et al. Facilitating matched pairing and expression of TCR chains introduced into human T cells. Blood 109, 2331–2338 (2007). [DOI] [PMC free article] [PubMed] [Google Scholar]
- 47.Riddell SR, et al. Restoration of viral immunity in immunodeficient humans by the adoptive transfer of T cell clones. Science 257, 238–241 (1992). [DOI] [PubMed] [Google Scholar]
- 48.Jedema I, van der Werff NM, Barge RM, Willemze R & Falkenburg JH New CFSE-based assay to determine susceptibility to lysis by cytotoxic T cells of leukemic precursor cells within a heterogeneous target cell population. Blood 103, 2677–2682 (2004). [DOI] [PubMed] [Google Scholar]
- 49.Robins H Immunosequencing: applications of immune repertoire deep sequencing. Curr Opin Immunol 25, 646–652 (2013). [DOI] [PubMed] [Google Scholar]
- 50.Yousfi Monod M, Giudicelli V, Chaume D & Lefranc MP IMGT/JunctionAnalysis: the first tool for the analysis of the immunoglobulin and T cell receptor complex V-J and V-D-J JUNCTIONs. Bioinformatics 20 Suppl 1, i379–385 (2004). [DOI] [PubMed] [Google Scholar]
- 51.Robins H, et al. Ultra-sensitive detection of rare T cell clones. J Immunol Methods (2012). [DOI] [PMC free article] [PubMed] [Google Scholar]
- 52.Horton H, et al. Optimization and validation of an 8-color intracellular cytokine staining (ICS) assay to quantify antigen-specific T cells induced by vaccination. Journal of immunological methods 323, 39–54 (2007). [DOI] [PMC free article] [PubMed] [Google Scholar]
- 53.Limaye AP, Huang ML, Atienza EE, Ferrenberg JM & Corey L Detection of Epstein-Barr virus DNA in sera from transplant recipients with lymphoproliferative disorders. J Clin Microbiol 37, 1113–1116 (1999). [DOI] [PMC free article] [PubMed] [Google Scholar]
- 54.Boeckh M, et al. Optimization of quantitative detection of cytomegalovirus DNA in plasma by real-time PCR. J Clin Microbiol 42, 1142–1148 (2004). [DOI] [PMC free article] [PubMed] [Google Scholar]
- 55.Dobin A, et al. STAR: ultrafast universal RNA-seq aligner. Bioinformatics 29, 15–21 (2013). [DOI] [PMC free article] [PubMed] [Google Scholar]
- 56.Buettner F, et al. Computational analysis of cell-to-cell heterogeneity in single-cell RNA-sequencing data reveals hidden subpopulations of cells. Nat Biotechnol 33, 155–160 (2015). [DOI] [PubMed] [Google Scholar]
- 57.Ilicic T, et al. Classification of low quality cells from single-cell RNA-seq data. Genome Biol 17, 29 (2016). [DOI] [PMC free article] [PubMed] [Google Scholar]
- 58.Finak G, et al. MAST: a flexible statistical framework for assessing transcriptional changes and characterizing heterogeneity in single-cell RNA sequencing data. Genome Biol 16, 278 (2015). [DOI] [PMC free article] [PubMed] [Google Scholar]
- 59.Kalbfleisch JD & Prentice RL The statistical analysis of failure time data, (J. Wiley, Hoboken NJ, 2002). [Google Scholar]
- 60.Freeman SD, et al. Measurable Residual Disease at Induction Redefines Partial Response in Acute Myeloid Leukemia and Stratifies Outcomes in Patients at Standard Risk Without NPM1 Mutations. J Clin Oncol 36, 1486–1497 (2018). [DOI] [PMC free article] [PubMed] [Google Scholar]
Associated Data
This section collects any data citations, data availability statements, or supplementary materials included in this article.
Supplementary Materials
Supplementary Figure 1: Gating strategy for intracellular assays.
Supplementary Figure 2: Gating strategy for surface stains.
Supplementary Figure 3: WT1 expression in leukemic cells.
Supplementary Figure 4: Effect of low-dose s.c IL-2 on post-infusion TTCR-C4 frequencies.
Supplementary Figure 5: TTCR-C4 do not preferentially localize to bone marrow in patients with no detectable AML.
Supplementary Table 1: Clonotype composition of infusion products.
Supplementary Table 2: Patient/donor EBV and CMV status.


