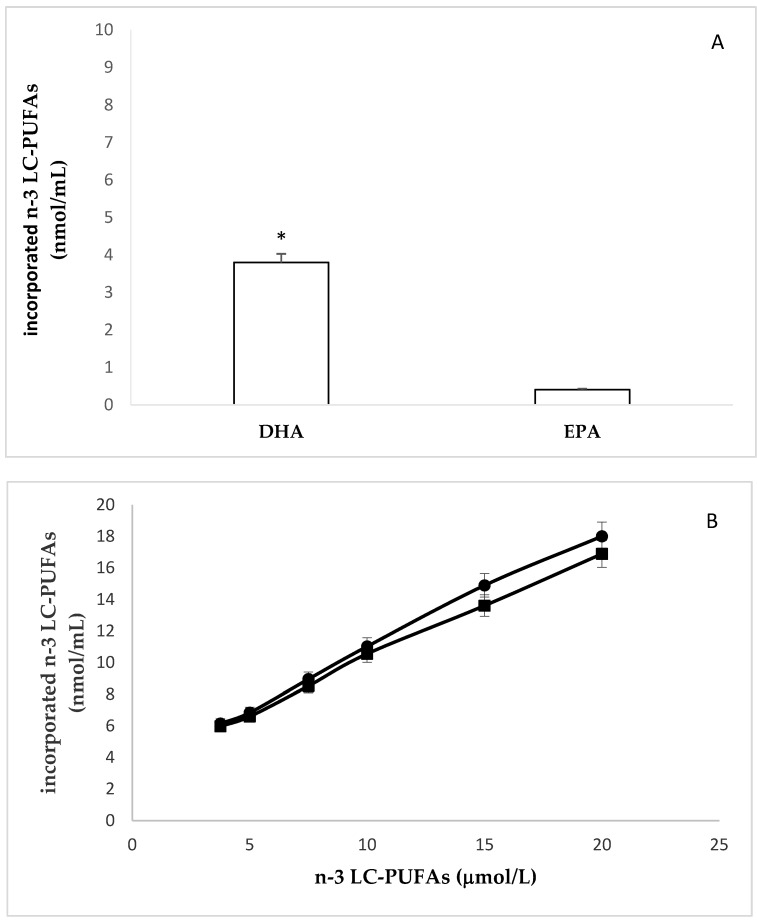
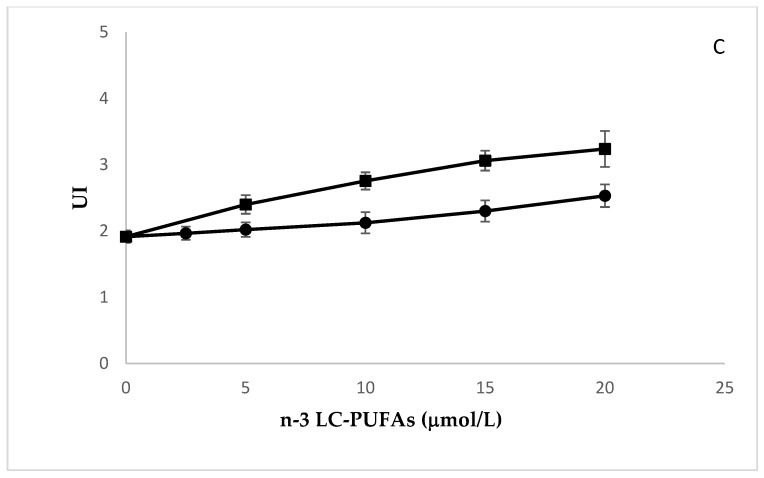
Figure 2.
Incorporation of EPA or DHA in HMEC. (A): Basal levels of EPA and DHA. * EPA vs DHA p ≤ 0.001 (B): incorporation of EPA (●) and DHA (∎) after 24 h of cell incubation with increasing amounts of these n-3-LC-PUFAs. (C): Changes of unsaturation index (UI) after cell incubation with increasing amounts of EPA (●) and DHA (∎). Pearson’s r = 0.9999, p < 0.0001 and Pearson’s r = 0.9996, p < 0.0001. Slope EPA vs. slope DHA p ≤ 0.0001.


