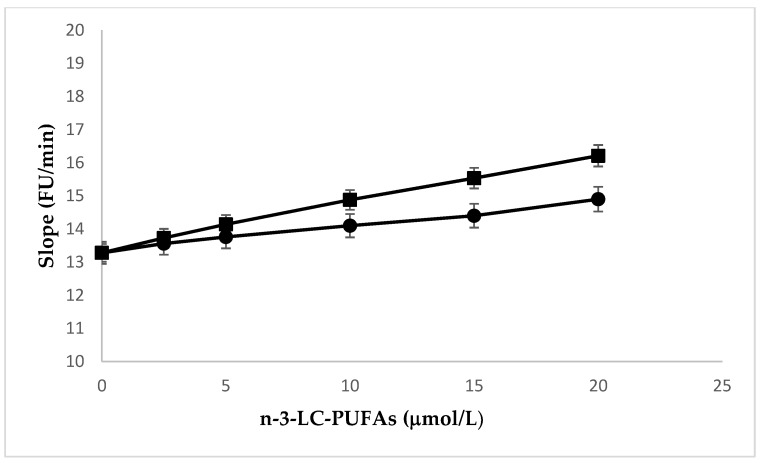
Figure 4.
Effect of the incubation with increasing amounts of EPA (●) and DHA (∎) enrichment on peroxidation kinetics of HMEC. Experiments were performed in triplicate. Data are expressed as mean ± SD of replicates. Pearson’s r = 0.9921, p < 0.0001 and Pearson’s r = 0.9973, p < 0.0001; EPA and DHA, respectively. Slope EPA vs. slope DHA p ≤ 0.0001.

