

Abstract
While TERT promoter mutations have been associated with a worsened prognosis in melanoma, the relationship between mutation status and downstream telomerase activity and telomere length remains convoluted. Using Sanger sequencing and qPCR-based techniques, we evaluated 60 melanoma cell lines for TERT promoter mutational status, copy number, gene expression, and telomere length in order to provide a comprehensive analysis of the TERT/telomere pathway and establish a classification system whereby the associations between TERT mutations and their downstream molecular manifestations can more easily be ascertained. Mutations at positions −124/125 and −146 were associated with the highest levels of TERT gene expression but had no appreciable impact on absolute telomere length. In contrast, the common variant rs2853669 (at position −245) was significantly associated with longer telomere length via a recessive model in our cohort (p=0.003). Our results, which are from assays performed on purified melanoma cell lines, suggest that the TERT promoter harbors a more complex mutational landscape than previously thought. Furthermore, the failure of TERT promoter mutations to consistently correlate with TERT expression and telomere length suggests an alternative method whereby tumor cells escape the critical shortening of telomeres.
Keywords: melanoma, genetics, TERT, telomere, telomerase
INTRODUCTION
Mutations in the promoter region of TERT (telomerase reverse transcriptase) are associated with a decreased disease-free survival, increased tumor recurrence, and an increased rate of metastasis in melanoma (Hugdahl et al., 2018, Nagore et al., 2016a, Nagore et al., 2016b). Long known to be crucial for the maintenance of telomere length and the immortalization of cancer cells of all types, TERT promoter (TERTp) mutations are found in over 90% of aggressive malignancies and over 60% of melanomas (2015, Bell et al., 2015). For these reasons, the TERT/telomerase/telomere pathway has been identified as a promising avenue for the targeted therapy, prognostication, and management of tumors of all types, melanoma included.
Several studies have confirmed a relationship between the most commonly observed mutations in TERTp (C>T transitions at positions −124 and −146 from the ATG start site) and TERT mRNA expression, telomerase activity, and telomere length (2015, Chiba et al., 2017, Heidenreich et al., 2014, Huang et al., 2015, Lee et al., 2016, Vinagre et al., 2013). Despite these findings, no clinically actionable knowledge has been ascertained, and there exists only one drug (imetelstat, a telomerase inhibitor) that has demonstrated moderate success in phase 1 and 2 clinical trials in various cancers. Furthermore, the functional relevance of several additional TERTp variants (particularly at positions −138/139 and −245) and the correlation between any of these mutations and their expected phenotypic manifestations have not been firmly established. To address this inconsistency, we have comprehensively characterized the TERT/telomere pathway in 60 cutaneous melanoma cell lines. What we observed was a clustering pattern based on a mutual exclusivity amongst the three most commonly mutated TERTp loci (−124 or −125, - 146, and −138/139), which established a framework for characterizing the downstream effects of these mutations. Our results confirm a relationship between the −124/125 and −146 variants and elevated TERT gene expression, while presenting data that suggest an inverse relationship for the −138/139 variant. We also present evidence that expands upon the suggestion that the rs2853669 common variant (at position −245) contributes to the role of TERT in the survival and recurrence of melanomas by being significantly associated with longer telomere length (p=0.003) (Nagore et al., 2016b).
RESULTS
We identified seven unique mutations in TERTp in 58/60 (96.7%) cell lines: −124C>T (43.3%), −146C>T (33.3%), −124/125CC>TT (10.0%), −138/139CC>TT (10.0%), −136C>T (1.7%), −100C>T (1.7%), and the familial variant −57A>C (1.7%) (Table S1 and Figure S1). We additionally identified the previously described single nucleotide polymorphism (SNP) rs2853669 (at position −245) in 51.7% of our cohort. The observed mutual exclusivity at the most frequently occurring loci in our cohort (−124 or −125, −146, and −138/139) revealed a clustering pattern whereby four unique subgroups were established (Figure 1).
Figure 1:
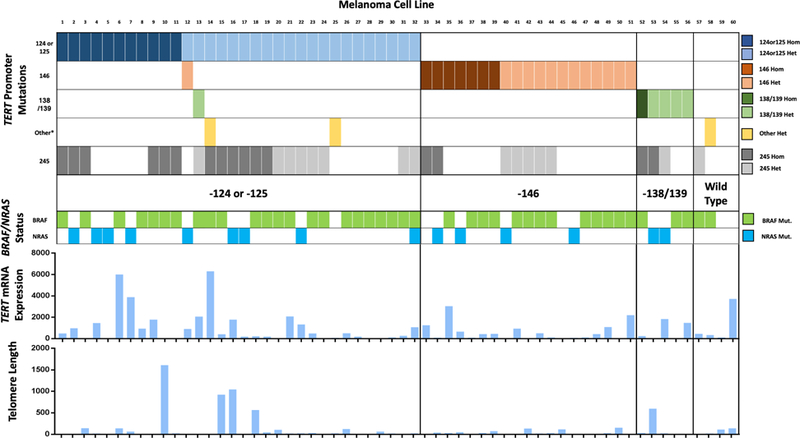
“TERT Classification.” Color-coded clustering of TERTp mutations in each subgroup (top) and their association with melanoma driver mutations (middle), and both TERT mRNA expression (fold change) and telomere length (kb; bottom). *Other mutations: −136C>T, - 100C>T, and −57A>C.
41/60 cell lines (68.3%) additionally harbored BRAF and 15/60 (25.0%) NRAS alterations, with no significant variability in the mutational frequency between classes (BRAF: X2=0.97 p=0.81; NRAS: X2=2.26, p=0.52). Loss of heterozygosity (LOH) in TERT was detected at a rate of 33.9% in those cell lines with a mutated TERTp, both suggesting a mechanism of selection and reinforcing a possible functional advantage for TERTp mutations.
Consistent with the results of prior studies, TERTp mutations at −124/−125 and −146 were associated with the highest levels of TERT gene expression with median fold changes of 442.2 and 423.5, respectively, relative to a fibroblast control value. In contrast, mutations at position - 138/139 were associated with a fold change of 242.5, which was considerably lower than the TERT Wild Type gene expression of 390.9-fold change.
There was no measurable relationship between telomere length and TERT gene expression (Pearson coefficient R2 = 0.005, p = 0.59) or TERT copy number amplification (R2 = 0.016, p = 0.33, linear regression analysis), despite 50.0% of cell lines displaying copy gain. The TERT Wild Type subgroup, however, was associated with the longest telomere length with a median value of 64.3kb compared to values of 20.58kb, 28.93kb and 22.67kb in −124/125, −146, and −138/139, respectively. This paradoxical result may be explained by one proposed strategy whereby TERTp mutations allow for the maintenance of critically short telomeres that promote genomic instability (Chiba et al., 2017). Despite this finding in the Wild Type subgroup, the lack of relationship between telomere length and TERT gene expression remained consistent even when analyzing only those cell lines with mutated TERT promoters (Pearson coefficient R2 = 0.006, p = 0.58).
The rs2853669 variant, which was recently found to modify the effects of TERTp mutations on both survival and recurrence in melanoma (Nagore et al., 2016b), was significantly associated with a longer absolute telomere length via a recessive model in our cohort (p=0.003, linear regression analysis), suggesting a possible molecular explanation for these clinical consequences. None of the remaining mutations revealed any statistically significant relationship with TERT gene expression or telomere length (Figure 2).
Figure 2:
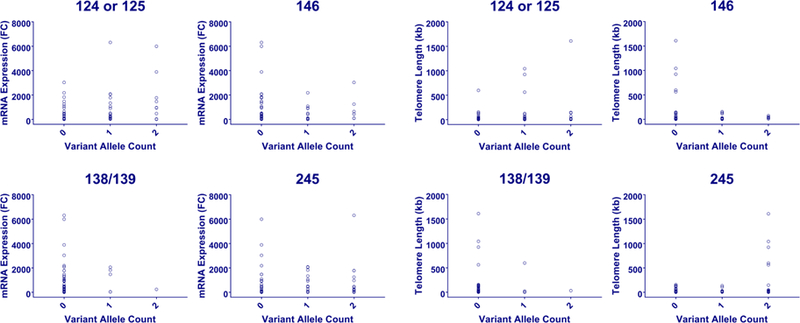
“Effect of promoter variants on gene expression and telomere length.” Dot plots of mRNA expression (left) and telomere length (right) for each of the most commonly observed TERTp mutations broken down by variant allele count (0, 1, or 2).
DISCUSSION
Mutations in the promoter region of TERT are nearly ubiquitous in cancer. TERT’s role in tumorigenesis and as a harbinger of poorer outcomes in melanoma is relatively unquestioned, but a precise mechanism behind this association remains elusive. In their retrospective study of 116 melanoma tumor samples, Populo et al. (2014) reported that TERTp mutations are significantly associated with both disease-free and overall survival, despite there being no measurable relationship between actual TERT gene expression and either promoter mutational status or survival (Populo et al., 2014). In this study, we sought to develop a better understanding of this pathway by studying cell lines that lack the contamination from fibroblasts, lymphocytes, endothelial cells, etc. that likely alters the results of similar studies on human or animal-derived tissues. What we found was a lack of consistent association between the most well-studied mutations and their molecular phenotype, which is partially in contrast to the published literature on this topic. Furthermore, our data, which is based on in vitro studies of purified melanoma cell lines, reveals a more complex mutational landscape of the TERTp than that of similar studies on primary tumor samples. While we cannot rule out the possibility of similar complexity within TCGA’s analysis without access to their primary data, their mention of just two TERTp variants (−124 and −146) can only be seen as a portion of the picture. The loss of heterozygosity present in our cell lines further suggests a growth advantage to TERTp mutations, which appear to have accumulated in several generations of in vitro selection.
The lack of a clear link between TERTp mutations and telomere length makes it more plausible that there are auxiliary genetic phenomena playing a role in the way tumor cells escape the critical shortening of telomeres. Alternative lengthening of telomeres (ALT), TERT gene rearrangement, and DNA hypermethylation have all been proposed as possible additional mechanisms, the last of which having been identified as a possible driver, and thus therapeutic target, of pediatric and adolescent melanomas by Fan et al. (Fan et al., 2016). Any one of these alternative mechanisms of preventing telomere attrition might explain the disappointing and inconclusive attempts at targeting the TERT/telomerase/telomere pathway to date (Ivancich et al., 2017, Reyes-Uribe et al., 2018).
Limitations
We acknowledge several limitations in this study. Our results are based on TERT gene expression rather than the enzymatic activity of telomerase, which prevents us from detecting any variability in translational or post-translational processing, in addition to any unforeseen discrepancies in protein function. However, the two measures should otherwise be tightly correlated, and none of the variants in the TERTp are known to alter the active site of telomerase. Our cell lines are likely heterogeneous populations with variable mutational compilations. It is safe to assume that this genetic variability has hindered our ability to appreciate a direct relationship between TERTp mutations and TERT expression or telomere length, and this may also explain the observed higher mRNA expression, more variable telomere length, and higher copy number than might be expected. Additionally, we were unable to determine whether the amplified copies of TERT were associated with a Wild Type or a mutant promoter in those cell lines with TERT gene amplification, which may explain the failure of gene amplification to modify gene expression in our cohort.
Conclusion
We believe the results presented here, although in contrast to those of other studies, are a significant contribution to the overall depiction of a TERT/telomerase/telomere pathway that continues to trouble researchers with its convoluted, yet undeniable, connection with worsening outcomes in melanoma. While the data herein are not independently relevant in a clinical setting, we hope that this newfound information will help to guide further research into the alternative pathways underlying this crucial tumorigenic process. By respecting the complexity of these pathways, we might better be able to understand where our efforts are best put forth to improve clinical outcomes. Given that all attempted strategies of targeting TERT have proven unfruitful, more research is needed to uncover the true relevance of alternate mechanisms to the TERT/telomerase/telomere pathway.
MATERIALS AND METHODS
Melanoma Cell lines
We adopt stringent criteria for establishing the veracity and identity of our cell lines. All new lines are purchased directly from trusted repositories (e.g ATCC). Legacy cell lines in our laboratory (e.g. those gifted from collaborators) are stratified into to 3 levels of confidence:
All our lines have been STR genotyped. Those lines which demonstrated an unequivocal match between our designation and the STR database are considered “CONFIRMED”; those which showed an unequivocal mismatch to another cell line have been discarded. All new ATCC cell lines are considered “CONFIRMED.”
For those with “no hits” in the STR database, we pe rformed a manual search of key melanoma mutations (e.g. BRAF(V600E), NRAS(Q61), CDKN2A, TP53, etc) reported for each line in either COSMIC, CCLE or in individual publications in the literature. We subsequently compared Sanger or whole exome sequence information generated in our lab for these lines. If there is a direct match between our sequence information and the public domain data, we designate these lines as “CO NSISTENT.”
For cell lines without public domain information because they have been recently derived from melanoma patients and have not been published, we analyzed levels of MITF (M-isoform) to determine if the cells are compatible with melanocytic cells. Those that express significant M-isoform MITF are designated as “COMPATIBLE.”
When choosing cell lines for experimentation, the order of preferential selection is “CONFIRMED” > “CONSISTENT” > “COMPATIBLE.”
Furthermore, all cell lines have been tested for common pathogens, such as mycoplasma, and are pathogen free. All lines were cultured in Dulbecco’s modified Eagle’s medium (DMEM; Corning Cellgro, Corning, NY) with 10% fetal bovine serum (FBS; Atlanta Biologicals, Flowery Branch, GA) and 1% penicillin/streptomycin (Gibco).
Sanger Sequencing
DNA of sufficient quality (confirmed using spectrophotometry and the 260/280nm ratio) was extracted from cultures of 60 human cutaneous melanoma cell lines using the QIAspin Miniprep Kit (QIAGEN, Valencia, CA). The TERTp region was first amplified by PCR using primer sequences targeting positions −27 to −286 from the ATG start site (See Tables S2–4 for primer sequences, PCR settings and reagents). The same was done using primers targeting exons 11 and 15 of BRAF and exons 2 and 3 of NRAS. The amplicons were size confirmed by gel electrophoresis and then treated with ExoSAP-IT (Affymetrix/USB Corporation, Cleveland, OH) prior to being submitted to the institutional sequencing core. Sequencing data were analyzed using Chromas software (Version 2.6, Technelysium Pty Ltd, South Brisbane, Australia).
TERT Gene Expression and Amplification
Total RNA was isolated using the QIAGEN RNeasy kit. It was converted to cDNA using the High Capacity RNA-to-cDNA kit (Applied Biosystems, Foster City, CA) according to the protocol provided by the manufacturer (Table S2–4). Using the TaqMan Gene Expression Assay (Applied Biosystems), TERT mRNA expression levels were quantified in triplicate relative to the housekeeping gene, GUSB, on the LightCycler 480 (Roche, Indianapolis, IN) (Table S2–4).
Assessment of copy number amplification affecting the TERT gene was performed in triplicate using qPCR with the TaqMan Copy Number Assay (Applied Biosystems). RPPH1 (RNase P) was employed as a single copy gene for the purposes of normalization and copy number calculation. TERT copy number in fibroblasts was used as a normal control with an expected copy number of 2 (Table S2–4). Calculation of copy number status was performed using CopyCaller software (Version 2.1, Applied Biosystems).
Absolute Telomere Length
After DNA extraction as above, absolute telomere length was quantified in triplicate using the SYBR green-based qPCR method defined by O’Callaghan and Fenech (O’Callaghan and Fenech, 2011). Two separate qPCR reactions were run for each sample, one to quantify the total amount of telomere length and one to quantify the number of genomic copies in the DNA extracted from each cell line (Table S2–4). Two sets of primers, one set that is designed to target the TTAGGG telomeric repeat segments and the other targeting the hemoglobin subunit beta (HBB) gene, a single copy gene, were utilized for the telomere length and genomic copy reactions, respectively. Two standard curves were developed using known concentrations of telomeric DNA and a known number of genomic copies that were serially diluted. Experimental values were extrapolated from these curves using Roche LightCycler 480 software (See Table S5 for calculation of standard values, standard curves, and sample PCR-plate setup). Absolute telomere length was calculated as the ratio of telomeric DNA (kilobases [kb]) to genomic copies, which represents the total amount of telomeric sequence in one genome.
Statistical Analysis
Initially, the dataset was subjected to several quality-check steps. First, we analyzed observed distributions of copy number, telomere length and normalized expression. Several significantly outlying data points were removed as they would strongly bias downstream analysis. Specifically, a data point was removed if its value on one or more metrics exceeded the value of the next largest data point by more than 20%. We constructed a model for linear regression: y = β1x + β0, where y is a measured “phenotype” (i.e. expression, telomere length, CNV, etc.) and x is an observed genotype (taking values of 0, 1, 2 with respect to count of alternative alleles). Significance threshold of phenotypic associations was estimated using Bonferroni correction: 0.05 / 8 DNA variants tested = 0.00625.
Supplementary Material
Figure S1: “Sanger Sequencing Chromatograms.” TERT Sanger sequencing chromatograms from selected cell lines with heterozygous mutations (left) and homozygous mutations (right). Variant alleles are identified with a green arrow.
Table S1: “Cell Line Genotype.” Mutational status of the TERT, BRAF, and NRAS genes for each of the 60 cell lines studied.
Table S2: “Primer Sequences.” Sequences of forward and reverse primers for telomere length qPCR reactions (above) and PCR-Sanger sequencing reactions (below).
Table S3: “PCR Settings.” PCR and qPCR reaction settings.
Table S4: “PCR Mix.” PCR and qPCR reaction mixes.
Table S5: “Telomere Length Assay Standard Curve.” Calculations for generation of a standard curve (top left), Roche software generated standard curve results (top right), and sample qPCR arrangement (bottom).
ACKNOWLEDGEMENTS
This activity was supported in part by the U.S NIH (K24CA149202 to H.T.)
Footnotes
IRB approval status: N/A
Publisher's Disclaimer: This is a PDF file of an unedited manuscript that has been accepted for publication. As a service to our customers we are providing this early version of the manuscript. The manuscript will undergo copyediting, typesetting, and review of the resulting proof before it is published in its final citable form. Please note that during the production process errors may be discovered which could affect the content, and all legal disclaimers that apply to the journal pertain.
DATA AVAILABILITY STATEMENT
The authors confirm that the data supporting the findings of this study are available within the article and its supplementary materials.
CONFLICT OF INTEREST
The authors state no conflict of interest.
REFERENCES
- Imetelstat Sodium in Treating Younger Patients With Relapsed or Refractory Solid Tumors, https://ClinicalTrials.gov/show/NCT02011126; [accessed.
- Study of GRN163L With Paclitaxel and Carboplatin in Patients With Advanced or Metastatic Non Small Cell Lung Cancer, https://ClinicalTrials.gov/show/NCT00510445; [accessed October 30th.2019].
- Genomic Classification of Cutaneous Melanoma. Cell 2015;161(7):1681–96. [DOI] [PMC free article] [PubMed] [Google Scholar]
- Bell RJ, Rube HT, Kreig A, Mancini A, Fouse SD, Nagarajan RP, et al. Cancer. The transcription factor GABP selectively binds and activates the mutant TERT promoter in cancer. Science (New York, NY) 2015;348(6238):1036–9. [DOI] [PMC free article] [PubMed] [Google Scholar]
- Chiba K, Lorbeer FK, Shain AH, McSwiggen DT, Schruf E, Oh A, et al. Mutations in the promoter of the telomerase gene TERT contribute to tumorigenesis by a two-step mechanism. Science (New York, NY) 2017;357(6358):1416–20. [DOI] [PMC free article] [PubMed] [Google Scholar]
- Fan Y, Lee S, Wu G, Easton J, Yergeau D, Dummer R, et al. Telomerase Expression by Aberrant Methylation of the TERT Promoter in Melanoma Arising in Giant Congenital Nevi. The Journal of investigative dermatology 2016;136(1):339–42. [DOI] [PMC free article] [PubMed] [Google Scholar]
- Heidenreich B, Nagore E, Rachakonda PS, Garcia-Casado Z, Requena C, Traves V, et al. Telomerase reverse transcriptase promoter mutations in primary cutaneous melanoma. Nature communications 2014;5:3401. [DOI] [PubMed] [Google Scholar]
- Huang DS, Wang Z, He XJ, Diplas BH, Yang R, Killela PJ, et al. Recurrent TERT promoter mutations identified in a large-scale study of multiple tumour types are associated with increased TERT expression and telomerase activation. European journal of cancer (Oxford, England : 1990) 2015;51(8):969–76. [DOI] [PMC free article] [PubMed] [Google Scholar]
- Hugdahl E, Kalvenes MB, Mannelqvist M, Ladstein RG, Akslen LA. Prognostic impact and concordance of TERT promoter mutation and protein expression in matched primary and metastatic cutaneous melanoma. British journal of cancer 2018;118(1):98–105. [DOI] [PMC free article] [PubMed] [Google Scholar]
- Ivancich M, Schrank Z, Wojdyla L, Leviskas B, Kuckovic A, Sanjali A, et al. Treating Cancer by Targeting Telomeres and Telomerase. Antioxidants (Basel, Switzerland) 2017;6(1):15. [DOI] [PMC free article] [PubMed] [Google Scholar]
- Lee S, Opresko P, Pappo A, Kirkwood JM, Bahrami A. Association of TERT promoter mutations with telomerase expression in melanoma. Pigment cell & melanoma research 2016;29(3):391–3. [DOI] [PMC free article] [PubMed] [Google Scholar]
- Nagore E, Heidenreich B, Rachakonda S, Garcia-Casado Z, Requena C, Soriano V, et al. TERT promoter mutations in melanoma survival. International journal of cancer 2016a;139(1):75–84. [DOI] [PMC free article] [PubMed] [Google Scholar]
- Nagore E, Heidenreich B, Requena C, Garcia-Casado Z, Martorell-Calatayud A, Pont-Sanjuan V, et al. TERT promoter mutations associate with fast-growing melanoma. Pigment cell & melanoma research 2016b;29(2):236–8. [DOI] [PubMed] [Google Scholar]
- O’Callaghan NJ, Fenech M. A quantitative PCR method for measuring absolute telomere length. Biological procedures online 2011;13:3-. [DOI] [PMC free article] [PubMed] [Google Scholar]
- Populo H, Boaventura P, Vinagre J, Batista R, Mendes A, Caldas R, et al. TERT promoter mutations in skin cancer: the effects of sun exposure and X-irradiation. The Journal of investigative dermatology 2014;134(8):2251–7. [DOI] [PubMed] [Google Scholar]
- Reyes-Uribe P, Adrianzen-Ruesta MP, Deng Z, Echevarria-Vargas I, Mender I, Saheb S, et al. Exploiting TERT dependency as a therapeutic strategy for NRAS-mutant melanoma. Oncogene 2018;37(30):4058–72. [DOI] [PMC free article] [PubMed] [Google Scholar]
- Vinagre J, Almeida A, Populo H, Batista R, Lyra J, Pinto V, et al. Frequency of TERT promoter mutations in human cancers. Nature communications 2013;4:2185. [DOI] [PubMed] [Google Scholar]
Associated Data
This section collects any data citations, data availability statements, or supplementary materials included in this article.
Supplementary Materials
Figure S1: “Sanger Sequencing Chromatograms.” TERT Sanger sequencing chromatograms from selected cell lines with heterozygous mutations (left) and homozygous mutations (right). Variant alleles are identified with a green arrow.
Table S1: “Cell Line Genotype.” Mutational status of the TERT, BRAF, and NRAS genes for each of the 60 cell lines studied.
Table S2: “Primer Sequences.” Sequences of forward and reverse primers for telomere length qPCR reactions (above) and PCR-Sanger sequencing reactions (below).
Table S3: “PCR Settings.” PCR and qPCR reaction settings.
Table S4: “PCR Mix.” PCR and qPCR reaction mixes.
Table S5: “Telomere Length Assay Standard Curve.” Calculations for generation of a standard curve (top left), Roche software generated standard curve results (top right), and sample qPCR arrangement (bottom).