

Abstract
Background: Food insecurity as a major public health problem has associations with a wide range of adverse consequences on health and quality of life. The aim of this study is to determine the prevalence of food insecurity among Iranian households, its key socioeconomic risk factors and population attributable risk via a large-scale cross-sectional study in the capital of Iran.
Methods: This cross-sectional study was performed among 30,809 households with complete questionnaires of food security, during 2011. The univariate test was used to investigate the association between economic status and covariates with household food insecurity. Multiple logistic regression model was used to assess the independent effect of economic status on household food insecurity.
Results: Totally, 37.8% (95% CI: 37.25, 38.34%) of the households were food insecure. There were significant associations between economic status and household food insecurity after adjustment for other variables (p-value<0.001). The extent of household food insecurity that could be attributed to the economic status in the 1st and 2nd quintiles (poorest and poor households), compared with the 5th quintile (richest households), was estimated to be 48.43% and 60.12%, respectively.
Conclusion: Food insecurity is relatively prevalent among households in Tehran. Economic status was identified as the most significant determinant of household food security, as 62.7% of poorest households were food insecure. Therefore, there is a crucial need to address food insecurity as a priority in food policies.
Keywords: Food insecurity, Risk factor, Population attributable risk, Socio-economic status
↑ What is “already known” in this topic:
Food insecurity as a major public health problem has associations with a wide range of adverse consequences on health and quality of life. There are knowledge gaps about the risk factors of food insecurity. So, it is important to determine these risk factors.
→ What this article adds:
Economic status was identified as the most significant determinant of food security, as 62.7% of poorest households were food insecure. Therefore, there is a crucial need to address food insecurity as a priority in food policies.
Introduction
Food is vital for survival. The current situation on food accessibility shows that achieving global food security is difficult (1). Food security is defined as ” having of physical and economic access to sufficient, safe and nutritious food for all people to meet their dietary needs and food preferences for an active and healthy life at all times” (2). The concept of food insecurity is complex (3) and multifactorial, including behavioral, social, cultural, environmental, and economic factors. It can provide a valuable tool for evaluating nutritional patterns in households. The factors mentioned above may influence the way households manage their food sources.
Evidence shows that nearly one billion people in the world do not have adequate food, and this is probably getting worse by 2050 reaching more than 40% of the global population (4). While there is an increase in food production, food insecurity continues to be unsatisfactorily high. Economic and demographic development has faced the limits of sustainability in food production, ecology, and economy, giving increase to deeper worries on food security at universal levels (5).
Socio-economic factors affect household food security status (6). Although poverty is the strongest predictor of food insecurity (7), it contains different features of social and economic privation that are powerfully related to food insecurity (8). Several studies have indicated that food insecurity is more among drug addicts (9), unemployed people or those with a low income (10), smokers (11), households with large family size (12), presence of chronic disease in the household (13), and ethnic/racial minority groups (14).
Since food security is a major public health problem, influencing many aspects of daily life and considering that its insecurity is associated with a wide range of adverse consequences on health and quality of life, it is important to know the risk factors of food insecurity as knowledge gaps still exist in this field (7). On the other hand, the development of different diseases is more probable in individuals facing food insecurity, especially due to socio-economic factors. Therefore, we aimed to determine the prevalence of food insecurity among Iranian households and the key socio-economic factors influencing it, with a special focus on the economic status of surveyed households. Furthermore, we calculated adjusted population attributable risks (aPARs) for the identified risk factors in this study, to estimate the extent of food insecurity that could be attributed to these risk factors. To our knowledge, this study is the first to calculate population attributable risk for the risk factors of food insecurity.
Methods
Study Population
This cross-sectional study was conducted in the framework of Urban Health Equity Assessment and Response Tool (Urban Heart –phase 2) study in households of Tehran, Iran, during 2011. In this study, 33865 households (118452 individuals) were selected from all 22 districts of Tehran using multistage cluster random sampling. Details of the sampling method of Urban Heart study have been described in a previous published study (15). One person of each household was interviewed by trained interviewers and questionnaires were completed. Exclusion criteria include: (a) all persons less than 20 years old, (b) having more than 20% missing in their questionnaires. Therefore, of all surveyed individuals (n=33865) that participated in this study, 3056 were excluded because some items were missed in their questionnaires. To enhance accuracy, all participating households were informed that their responses would remain confidential.
Study Instrument
An Iranian version of the household food security short questionnaire (six questions) was used to measure the prevalence of food insecurity in different districts of Tehran. This questionnaire was validated in Iran (16) and contains six items, as follows:
The food that I/we bought just didn’t last, and I/we didn’t have money to get more.
I/ we couldn’t afford to eat balanced meals.
In the last 30 days, since last month, did you or other adults in your household ever cut the size of your meals or skip meals because there wasn’t enough money for food?
[If yes on item 3] in the last 30 days, how many days did this happen?
In the last 30 days, did you ever eat less than you felt you should because there wasn’t enough money for food?
In the last 30 days, were you ever hungry but didn’t eat because there wasn’t enough money for food?
For items number 1 and 2, “Often” and “Sometimes” were considered as positive responses and “Never” in the last 30 days as a negative response. For questions number 3, 5 and 6 “Yes” was considered as a positive response. Responses of 3 days or more on item 4 were coded as positive (Yes). The sum of positive responses to the six items in the module yielded the household’s raw score on the scale. Households were classified as ‘food-insecure’ if the respondent answered positively to two or more of the six household food security questions.
Economic Status
We used the “Wealth Index” to determine household economic status. The wealth index is a composite measure of a household’s cumulative living standard. In this study, the wealth index was calculated using easy- to- collect data on a household’s ownership of 14 selected assets; including: owning a telephone (yes, no), a mobile phone (yes, no), a fridge (yes, no), a microwave (yes, no), a personal computer (yes, no), a washing machine (yes, no), a bathroom (yes, no), a kitchen (yes, no), a toilet (yes, no), a car (yes, no), a motorcycle (yes, no), house ownership (proprietary or rental), number of rooms per capita (once and more vs. less than one) ) and infrastructure of the house per capita (above the median vs. below the median).
We used principal component analysis (PCA) to assign weighting values to the indicator variables. In PCA, the indicator variables are first standardized (calculating Z-scores). Then the coefficient factor scores (factor loading) are computed. After that, the indicator values are multiplied by the loading and summed to produce the household’s index value for each household. In this process, only the first produced components are used to generate the wealth scores. Higher scores indicate higher economic status and vice versa. Finally, in order to determine each household’s economic status, the scores were converted to five ordered categories (based on quintiles), from the poorest (1st quintile) to the richest (5th quintile) (17).
Statistical analysis
Quantitative data is presented as mean ± standard deviation (SD). The Chi-square test was used to investigate the relationship between economic status and covariates with household food insecurity (univariate test). These relationships were adjusted for factors that could affect household food insecurity including family size, the presence of smokers in the household, presence of addicts in the household, having insurance and ethnicity by using multiple-logistic regression model (with the backward method), to assess the independent effect of economic status on household food insecurity. According to the results of multiple logistic regression models, adjusted odds ratio (OR) with 95% confidence interval (CI) was reported in this study.
In this study in order to answer the question “to what extent food insecurity could be attributed to economic status, in the studied households?”, we computed population attributable risk. Adjusted population attributable risks (aPAR) were calculated, using adjusted odds ratio (aOR) for each variable, which had a significant association with food insecurity in multiple logistic regression model. The PAR equation is:
Pi= proportion of source population in its exposure level; ORi= Adjusted odds ratio comparing its exposure level with the reference group (i=0) (18).
To calculate PAR, we assume that each factor exerted an independent effect. Therefore, the sum of the percentages of aPAR can be more than 100%.
p<0.2 in univariate analyses (Chi-square) and p<0.05 in multiple-logistic regression model were considered statistically significant. The statistical analysis of the data was performed using SPSS software version 20 (IBM; USA)
Results
The mean±SD age of the respondents was 44.5±15.9 years (range: 20–90 years). There were 19967 women and 10842 men. Characteristics of the studied households are shown in Table 1 with respect to their food security status. Totally, 11633 households (37.8%, 95% CI: 37.25, 38.34%) were identified as food insecure. As shown in Table 1, the prevalence of food insecurity was more than 60% in the poorest households. It is also observed that the prevalence of food insecurity increased as the level of household economic status decreased. The lowest prevalence of food insecurity was observed in district 3 (17.9%, 95% CI: 15.9, 19.9%) and the highest in district 18 (52.5%, 95 CI: 50.05, 54.95%, Fig. 1). As shown in Figure 1, the prevalence of household food insecurity was more than 30% in 81.1% of the surveyed districts (including districts 4, 5, 7-22) and even in 13.6% of them (including districts 15, 17, 18) was more than 50%. Moreover, Figure 1 shows that the prevalence of household food insecurity without hunger was more than 30% in 40.1% of the districts. It is also noticeable that household food insecurity with hunger was observed in all districts of Tehran (even in the more affluent districts such as 1, 2, and 3).
Table 1. Characteristics of study population by their household food security status in Tehran, 2011 (n=30809) .
|
All (n=30809) |
Food Secure | Food Insecure | ||
| No. | % | % | % | |
| Family Size | ||||
| ≤ 3 | 15253 | 49.5 | 64.6 | 35.4 |
| > 3 | 15556 | 50.5 | 60 | 40 |
| Presence of smoker in household | ||||
| No | 23261 | 75.5 | 64.5 | 35.5 |
| Yes | 7548 | 24.5 | 55.3 | 44.7 |
| Presence of addicts in household | ||||
| No | 30152 | 97.9 | 62.7 | 37.3 |
| Yes | 657 | 2.1 | 40.5 | 59.5 |
| Having Insurance | ||||
| No | 6700 | 21.7 | 56.5 | 43.5 |
| Yes | 24109 | 78.3 | 63.8 | 36.2 |
| Ethnicity | ||||
| Fars | 28560 | 92.7 | 63.2 | 36.8 |
| Other | 2249 | 7.3 | 50.4 | 49.6 |
| Economic Index* | ||||
| Poorest | 2392 | 7.8 | 37.3 | 62.7 |
| Poor | 9013 | 29.3 | 52 | 48 |
| Moderate | 4115 | 13.4 | 58.3 | 41.7 |
| Rich | 7839 | 25.4 | 67.2 | 32.8 |
| Richest | 6556 | 21.3 | 81.7 | 18.3 |
*Some data were missing in these variables
Fig. 1.
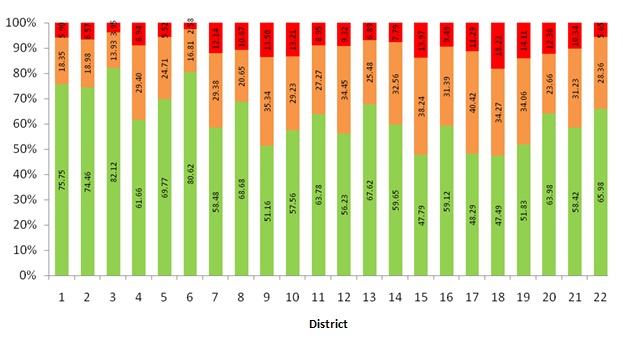
Prevalence of food security (green), food insecurity without hunger (orange), food insecurity with hunger (red) in households in different districts of Tehran, 2011.
Univariate test (Chi-square) showed that there were significant associations (p<0.2) between food insecurity status in the surveyed households and variables such as household size, the presence of smokers in the household, presence of addicts in the household, having insurance, ethnicity, and economic status (Table 2). Moreover, the final multiple logistic regression models on the relationship between food insecurity and surveyed variables show that there were significant relationships between all entered variables in the model with food insecurity (p<0.001, Table 2). According to aORs shown in Table 2, economic status had the strongest relationship with food insecurity among all variables. As the economic status of the studied households decreased, the chance of food insecurity increased. As Table 2 shows, the extent of food insecurity that could be attributed to the economic status in the 1st and 2nd quintiles (poorest and poor households), compared with the 5th quintile (richest households), was estimated to be 48.43% and 60.12%, respectively. Furthermore, 40.68% and 39.77% of food insecurity in the 3rd and 4th quintiles, respectively, were also attributed to economic status (Table 2).
Table 2. Odds ratio (OR) estimates of household food insecurity based on univariate analyses (Chi-square) and multiple logistic regression model in Tehran, 2011 .
| Variables | Unadjusted OR | (95% CI) | p |
Adjusted OR |
(95% CI) | p | PAR% |
| Family size | |||||||
| ≤ 3 | 1 | - | <0.001 | 1 | - | <0.001 | |
| > 3 | 1.22 | (1.16 , 1.28) | 1.45 | (1.38 , 1.52) | 16.62 | ||
| Presence of smoker in household | |||||||
| No | 1 | - | <0.001 | 1 | - | <0.001 | |
| Yes | 1.47 | (1.39 , 1.55) | 1.36 | (1.28 , 1.44) | 7.68 | ||
| Presence of addicts in household | |||||||
| No | 1 | <0.001 | 1 | <0.001 | |||
| Yes | 2.47 | (2.11 , 2.89) | 1.65 | (1.39 , 1.95) | 1.32 | ||
| Having Insurance | |||||||
| No | 1 | - | <0.001 | 1 | - | <0.001 | |
| Yes | 0.73 | (0.70 , 0.78) | 0.86 | (0.81 , 0.92) | -12.20 | ||
| Ethnicity | |||||||
| Fars | 1 | - | <0.001 | 1 | - | <0.001 | |
| Other | 1.69 | (1.55 , 1.84) | 1.22 | (1.11 , 1.33) | 1.73 | ||
| Economic Status | |||||||
| Richest | 1 | 1 | |||||
| Rich | 2.18 | (2.02 , 2.36) | <0.001 | 2.4 | (1.98 , 2.32) | <0.001 | 39.77 |
| Moderate | 3.20 | (2.93 , 3.49) | <0.001 | 3.24 | (2.97 , 3.54) | <0.001 | 40.69 |
| Poor | 4.13 | (3.83 , 4.45) | <0.001 | 4.31 | (3.99 , 4.66) | <0.001 | 60.12 |
| Poorest | 7.51 | (6.77 , 8.34) | <0.001 | 7.80 | (7.01 , 8.68) | <0.001 | 48.43 |
Discussion
In this study, we aimed to investigate the association between economic status and food insecurity in Iranian households, using a validated instrument (short six-items) to identify household food insecurity. In this study, the prevalence of food insecurity was 37.8% which was similar to the result of a previous study in Tehran, Iran, showing that 36.6% of households experienced food insecurity (19). In contrast, Dastgiri reported that 59.3% of the households in the northwest region of Iran were food insecure (16). Additionally, in another study by Mohammadi Nasrabadi, the prevalence of food insecurity in urban and rural Iranian households was 23.2%, which is less than the finding in our study (20). This indicates an urgent need to recover substructures.
We found that in 45.5% of the surveyed districts in Tehran, the prevalence of household food insecurity with hunger was more than 10%. Ramesh reported that the prevalence of food insecurity with hunger was 27.8% in Shiraz (21), similar to the results of another study from Thailand showing that 30.1% of households experienced food insecurity with hunger (22). Hunger and food insecurity pose multidimensional and complicated difficulties due to their close association with poverty. National nutrition support programs and community food security plans may help decrease these challenges by providing fair access to healthy and nutritious food supplies for all people.
We found that the lowest prevalence of household food insecurity was observed in district 3 (17.9%) and the highest was in district 18 (52.5 %) of Tehran. The prevalence of household food insecurity in 81.1% of the districts was more than 30%. Food insecurity was more than 50% in 13.6% of the districts. No other study has assessed household food insecurity in different districts of Tehran to compare the results with. We just found a study conducted by Djazayery among high school girls from two areas in North and South of Tehran, Iran, reporting food insecurity was 36.8% and 42.5% in the North and South of Tehran, respectively (23). Therefore, the difference in the prevalence of household food insecurity in different districts of Tehran is probably the result of cultural and economic differences between the districts and the level of household income dedicated to the food supply.
After adjusting for other variables to control their confounding effects, it was detected that the food insecurity determinants included all entered variables in the model: The household size, presence of smokers in the household, presence of addicts in the household, having insurance, ethnicity, and economic status were all effective factors on household food insecurity in this study. Based on these results, food insecurity was directly related to household size, which is similar to a previous study (12). The detected association between these factors is perhaps due to the fact that when food prices or unemployment increase, the household food supply decreases, and in larger families the amount of food for each member in the household will decrease consequently.
This study recommends that smoking is related to food insecurity among household members, which is consistent with the results of a previous study (11). Our findings indicated that households with smokers had more odds of being food insecure than households without smokers. These results recommend that being a smoker may result in a dietary deficiency in a household which is already influenced by poverty and low health outcomes.
Confirming the findings of a previous study (24), our study showed an association between food insecurity and the presence of addicted persons in a household. It has been assumed that addiction may cause a delay in accessing health and social support programs and at the same time, addicted persons have a higher risk of being food insecure because they are less aware of food resource programs (25) and may need more support in this field. Because of the lack of information among addicted people who have problems with the accessibility of food facilities provided, it is very difficult to address food insecurity difficulty by treatment service staffs (26).
Our results demonstrated that Fars ethnicity had lower odds of being food insecure compared to other Iranian ethnicities. Based on the findings of Rezazadeh’ study, Kurdish people were more food insecure compared to Azeris (27). In Mohammadi’ study, Azeri’s women were also more food insecure than that of Tehranian women (28). It must be considered that it is difficult to interpret the association between ethnicity and food insecurity in the multicultural background of Iran without studying other ethnic groups. To understand the correct relationship between ethnicity and food insecurity, more comprehensive studies are required, and this information could be very important in designing community-based interventions to prevent food insecurity in ethnic populations.
The large sample size in this study might influence the relationship between these variables (family size, the presence of smoking and addiction among family members, insurance and ethnicity) and food insecurity. It was also observed that the odds ratio for these variables in the final model (multiple analyses) is not reliable to be used for judging these relationships because of their proximity to one. Multiple analysis was performed in order to control the effects of these variables on the relationship between economic status and food insecurity in addition to their independent relationship with food insecurity in univariate analysis.
We also found a strong negative association between food insecurity and economic status. When the findings were categorized by economic status (poorest, poor, moderate, rich, and richest), we found an increased risk of food insecurity status in households with low economic status, which was not observed in the richest households. Although some studies have investigated this association, few studies have observed a weak influence of economic status on food insecurity. For instance, a study in China that investigated the influence of food security and dietary deficiency on literacy found that economic status was positively associated with food insecurity (29). It is thus reasonable that households with varied foods may face food insecurity less than households which completely depend on bought foods. This possibly describes the association between poverty and food insecurity.
In our study, the odds ratio of food insecurity was 7.8 times higher in the poorest households or even 2.4 times higher in the rich households compared with the richest households. Food security and poverty are inseparable. Although food security alone does not eradicate poverty any strategy to fight poverty must be integrated with policies to ensure the best chance of reducing mass poverty and hunger. The structure of poverty in Iran makes this assumption that poor households will have to cut at least some foods. In our study, the proportion of food insecurity that could be attributed to the economic status in the 1st and 2nd quintiles (poorest and poor households), compared with the 5th quintile (richest households) was estimated to be 48.43% and 60.12%, respectively. It means that more than 48% and more than 60% of the population risks of food insecurity in poorest and poor households, respectively, would be eliminated if their economic status increases to the level of the richest households.
About 63% of poorest families suffered from food insecurity. Low income has also been related to food insecurity in another study (30). Based on Temple’s findings, the risk of food insecurity increased per amount of income reduction (31). In contrast, another study had found an inverse association between food insecurity and the economic level (32). Higher household income increases purchasing power and increases food security. The ability to consume adequate amounts of food in order to decrease food insecurity depends on household income and economic status. Overall, the association between food insecurity and economic status could be described through the significant role of economic status in food accessibility.
Strength and limitations
The strength of this study includes having a large sample size and using logistic regression analysis as well as assessing economic index and its effect on food insecurity which was the judging criteria for the economic status of Iranian households. Due to the cross-sectional design of the present study, determining fundamental inferences between food insecurity and economic status is difficult. A prospective study is needed to clarify the causality direction. Additionally, we acknowledge that households residing in Tehran are a heterogeneous group with main differences in socio-economic status and probably different food insecurity levels. Since this information could be a key to modify economic policies and food insecurity interventions, more comprehensive studies are necessary for the future.
Conclusion
Food insecurity was relatively prevalent among households in Tehran. Household size, the presence of smokers or addicts in the household, having insurance, ethnicity, and economic status were risk factors for food insecurity in this study. Among these risk factors, economic status was identified as the most significant determinant of food security, as 62.7% of poorest households were food insecure. This shows that it is hard to address food insecurity in Iran without addressing economic status. To achieve this goal it is necessary to combine national nutrition and food policies to improve the unpleasantly high level of food insecurity in Iranian poor households. Dietary supportive and educational programs are also necessary for these households.
Acknowledgments
The authors gratefully acknowledge households who willingly contributed to this study and also Tehran Municipality and Iranian Institute for Health Sciences Research for supporting this study. The Urban HEART study (phase 2) funded by the Municipality of Tehran.
Conflict of Interests
The authors declare that they have no competing interests.
Cite this article as: Asadi-Lari M, Moosavi Jahromi L, Montazeri A, Rezaee N, Haeri Mehrizi AA, Shams-Beyranvand M, Vaez-Mahdavi MR, AbbasiGhahramanloo A, Khazaee-Pool M, Ghanbari A, Gholami A. Socio-economic risk factors of household food insecurity and their population attributable risk: A population-based study. Med J Islam Repub Iran. 2019 (9 Nov);33:119. https://doi.org/10.34171/mjiri.33.119
References
- 1.Ajao KO, Ojofeitimi EO, Adebayo AA, Fatusi AO, Afolabi OT. Influence of family size, household food security status, and child care practices on the nutritional status of under-five children in Ile-Ife, Nigeria. Afr J Reprod Health. 2010;14(4 Spec no):117–26. [PubMed] [Google Scholar]
- 2.Vozoris N, Tarasuk V. Household food insufficiency is associated with poorer health. J Nutr. 2003;133(1):120–6. doi: 10.1093/jn/133.1.120. [DOI] [PubMed] [Google Scholar]
- 3.Fakayode S, Rahji M, Oni O, Adeyemi M. An assessment of food security situations of farm households in Nigeria; a USDA approach. Soc Sci. 2009;4:24–9. [Google Scholar]
- 4. Food and Agriculture Organization of the United Nations: The State of Food Insecurity in the World. Food and Agriculture Organization of the United Nations. Rome 2010.
- 5.Parris B. Climate change threat to food security. Global Future. 2008;3:16–17. [Google Scholar]
- 6.Sanusi R, Badejo C, Yusuf B. Measuring Household Food Insecurity in Selected Local Government Areas of Lagos and Lbadan, Nigeria. Pak J Nutr. 2006;5:62–7. [Google Scholar]
- 7.Ramsey R, Giskes K, Turrell G, Gallegos D. Food insecurity among adults residing in disadvantaged urban areas: potential health and dietary consequences. Public Health Nutr. 2012;15(2):227–37. doi: 10.1017/S1368980011001996. [DOI] [PubMed] [Google Scholar]
- 8.Bartfield J, Dunifon R. State-level predictors of food insecurity among households with children. J Policy Anal Manag. 2006;25(4):921–42. [Google Scholar]
- 9.Strike C, Rudzinski K, Patterson J, Millson M. Frequent food insecurity among injection drug users: correlates and concerns. BMC Public Health. 2012;12:1058. doi: 10.1186/1471-2458-12-1058. [DOI] [PMC free article] [PubMed] [Google Scholar]
- 10.Beatty T. Do the Poor Pay More for Food? Evidence from the United Kingdom. Am J Agric Econ. 2010;92:608–21. [Google Scholar]
- 11.John RM RH, Blecher E. Tobacco expenditure and its implications for household resource allocation in Cambodia. Tob Control. 2012;21(3):341–6. doi: 10.1136/tc.2010.042598. [DOI] [PubMed] [Google Scholar]
- 12.Chaput JP, Gilbert JA, Tremblay A. Relationship between food insecurity and body composition in Ugandans living in urban Kampala. J Am Diet Assoc. 2007;107:1978–82. doi: 10.1016/j.jada.2007.08.005. [DOI] [PubMed] [Google Scholar]
- 13.Gholami A, Sani TR, Askari M, Jahromi ZM, Dehghan A. Food Insecurity Status and Associated Factors among Rural Households in North-East of Iran. Int J Prev Med. 2013;4(9):1018. [PMC free article] [PubMed] [Google Scholar]
- 14.Omidvar N, Ghazi-Tabatabie M, Sadeghi R, Mohammadi F, Abbasi-Shavazi MJ. Food Insecurity and Its Sociodemographic Correlates among Afghan Immigrants in Iran. J Health Popul Nutr. 2013;31(3):356–66. doi: 10.3329/jhpn.v31i3.16828. [DOI] [PMC free article] [PubMed] [Google Scholar]
- 15.Asadi-Lari M, Vaez-Mahdavi MR, Faghihzadeh S, Montazeri A, Farshad AA, Kalantari N. The application of urban health equity assessment and response tool (Urban HEART) in Tehran; concepts and framework. Med J Islam Repub Iran. 2010;24(3):175–185. [Google Scholar]
- 16. Creation of a wealth index. World food Programme. 2017. Available from:https://docs.wfp.org/api/documents/WFP-0000022418download/.
- 17.Dastgiri S, Sharafkhani R, Gharaaghaji R, Ghavamzadeh S. Prevalence, influencing factors and control of food insecurity: a model in the northwest of Iran. Asia Pac J Clin Nutr. 2011;20(4):613–7. [PubMed] [Google Scholar]
- 18.Rockhill B, Newman B, Weinberg C. Use and misuse of population attributable fractions. Am J Public Health. 1998;88(1):15–9. doi: 10.2105/ajph.88.1.15. [DOI] [PMC free article] [PubMed] [Google Scholar]
- 19.Mohammadzadeh A, Dorosty A, Eshraghian M. Household food security status and associated factors among high-school students in Esfahan, Iran. Public Health Nutr. 2010;13(10):1609–13. doi: 10.1017/S1368980010000467. [DOI] [PubMed] [Google Scholar]
- 20.Mohammadi Nasrabadi F, Omidvar N, Hoshyar rad A. The association between food security and weight status among Iranian adults. Iran J Nutr Food. 2008;2:41–53. (Persian). [Google Scholar]
- 21.Ramesh T, Motlagh A, Abdollahi M. Prevalence of Food Insecurity on Urban Household in Shiraz City and It’s Related Socioeconomic Factors. Iran J Nutr Food Tech. 2010;1388(4):53–64. [Google Scholar]
- 22.Piaseu N, Mitchell P. Household food insecurity among urban poor in Thailand. J Nurs Scholarsh. 2004;36:115–21. doi: 10.1111/j.1547-5069.2004.04023.x. [DOI] [PubMed] [Google Scholar]
- 23.Djazayery A, Pourmoghim M, Omidvar N. Assessment and comparison of food security and nutrient intake among high school girls from two areas in North and South of Tehran. Iran Public Health J. 1999;1(4):21–7. (Persian). [Google Scholar]
- 24.Saeland M, Haugen M, Eriksen FL, Wandel M, Smehaugen A, Böhmer T. et al. High sugar consumption and poor nutrient intake among drug addicts in Oslo. Norway Br J Nutr. 2011;105(4):618–24. doi: 10.1017/S0007114510003971. [DOI] [PubMed] [Google Scholar]
- 25.Kaufman R, Isralowitz R, Reznik A. Food insecurity among drug addicts in Isreal: Implications for social work practice. J Soc Work Practice Addict. 2005;5:21–32. [Google Scholar]
- 26.Del Castillo SE, Patino GA, Herran OF. Food insecurity: associated variables and issues for public policy. Biomedica. 2012;32(4):545–56. doi: 10.1590/S0120-41572012000400010. [DOI] [PubMed] [Google Scholar]
- 27.Rezazadeh A, Omidvar N, Eini-Zinab H, Ghazi-Tabatabaie M, Majdzadeh R, Ghavamzadeh S. et al. Food insecurity, socio-economic factors and weight status in two Iranian ethnic groups. Ethnicity Health. 2016;21(3):233–50. doi: 10.1080/13557858.2015.1061102. [DOI] [PubMed] [Google Scholar]
- 28.Mohammadi-Nasrabadi F, Omidvar N, Khoshfetrat M, Kolahdooz F. Household Food Insecurity in the Islamic Republic of Iran: A Systematic Review and Meta-Analysis East Mediterr. Health J. 2014;20(11):698–506. [PubMed] [Google Scholar]
- 29.Hannum E, Liu J, Frongillo E. Poverty, Food Insecurity and Nutritional Deprivation in Rural China: Implications for Children's Literacy Achievement. Int J Educ Dev. 2014;34:90–7. doi: 10.1016/j.ijedudev.2012.07.003. [DOI] [PMC free article] [PubMed] [Google Scholar]
- 30.Gholami A, Foroozanfar Z. Household food security status in the Northeast of Iran: a cross-sectional study. Med J Islam Repub Iran. 2015;29:227. [PMC free article] [PubMed] [Google Scholar]
- 31.Temple JB. Severe and moderate forms of food insecurity in Australia: are they distinguishable? Aust J Soc Issues. 2008;43(4):649. [Google Scholar]
- 32.Coleman-Jensen A, Nord M, Andrews M, Carlson S. Household Food Security in the United States in 2010 ERR-125, US Dept of Agriculture. Econ Res Serv. 2011 [Google Scholar]