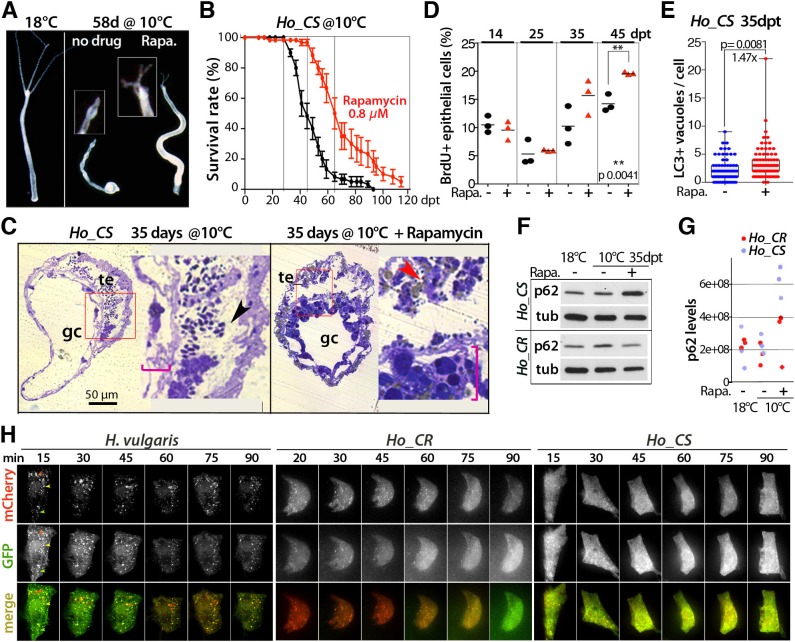
Fig. 6.
Rapamycin treatment delays aging in Ho_CS without enhancing the autophagy flux. (A,B) Aging phenotype at 58 dpt (A) and survival rate (B) in Ho_CS animals exposed, or not, to rapamycin from day 3 (dpt). Error bars represent s.e.m. (C) Toluidine-stained transversal sections of gastric regions from untreated (left) or rapamycin-treated (right) Ho_CS animals taken at 35 dpt. Red boxes indicate the enlarged areas shown on the right; pink brackets indicate gastrodermis thickness; black arrowhead indicates sperm cells in the testis lumen and red arrowhead indicates sperm cells engulfed in an epithelial cell. gc, gastric cavity; te, testis. (D) BrdU-labeling index values measured after 96 h BrdU exposure in Ho_CS animals maintained at 10°C in the presence (red triangles) or absence (black circles) of rapamycin. (E) Number of LC3+ vacuoles in ESCs of Ho_CS animals exposed (red dots) or not (blue dots) to rapamycin. Error bars represent s.d.; P-values calculated using the unpaired t-test. (F,G) p62 levels assessed by western blotting (F) or proteomic analysis (G) in Ho_CR and Ho_CS animals maintained at 18°C or transferred to 10°C and exposed to rapamycin for 35 days. tub: α-tubulin. (H) Live imaging of epithelial cells transiently expressing the mCherry-eGFP-hyLC3A/B autophagy sensor in animals maintained at 18°C and exposed to rapamycin (0.8 µM) from day 0. Arrowheads indicate newly formed autophagosomes with full GFP fluorescence and limited mCherry fluorescence (green); mature autophagosomes with double fluorescence GFP/mCherry (yellow); or autolysosomes with quenched GFP fluorescence (red).

