

Abstract
Objectives:
A non-invasive protocol was previously developed using three-dimensional ultrasound and a sensation meter to characterize real-time bladder sensation. This study the protocol by measuring the effects of fill rateand ultrasound probe pressure during oral hydration.
Methods:
Healthy volunteers with no urinary symptoms (based on International Consultation on Incontinence Questionnaire on Overactive Bladder surveys) were recruited into an oral hydration study. Throughout two complete fill–void cycles, participants drank 2 L Gatorade G2 (The Gatorade Company, Inc., Chicago, Illinois) and used a touch-screen sensation meter to record real-time bladder sensation (0%-100%). The study was repeated three times, once per week (Visits A, B, and C). In Visits A and B, ultrasound was used to measure bladder volume every 5 minutes. Ultrasound was not used in Visit C except at 100% capacity. Volume data from Visit B were used to estimate volumes throughout the fills in Visit C. Sensation–capacity curves were generated for each fill for comparative analysis.
Results:
Ten participants completed three visits (60 total fills). Increased fill rate led to decreased sensation throughout filling, andultrasound probe pressure led to increased sensation. Participants reported higher sensation at low volumes during Fill 1 of Visit A before training with the sensation meter. Sensation curves with intermittent ultrasound showed repeatability for Fill 2 in Visits A and B. Fill rate and ultrasound probe pressure affect real-time bladder sensation during oral hydration.
Conclusions:
This study demonstrated repeatability of real-time bladder sensation during a two-fill oral hydration protocol with ultrasound.
Keywords: bladder, micturition, overactive bladder, ultrasound, urodynamics
1 |. INTRODUCTION
Nearly 30 million adults over 40 years of age in the US suffer from overactive bladder (OAB).1 OAB is defined as “urinary urgency with or without urge incontinence, usually with frequency and nocturia, in the absence of a pathologic or metabolic condition that might explain these symptoms.”2 The current gold standard for evaluating bladder function and identifying different forms of voiding dysfunction involves using invasive urodynamics.3 This test has well-known risks and requires expensive technology operated by an experienced technician. Furthermore, the urodynamics procedure produces uncomfortable and embarrassing experiences for patients and is non-physiologic in the assessment of bladder sensation during filling.4,5
Due to the invasiveness, patient risk, and cost of this test, non-invasive hydration protocols have been developed to characterize real-time bladder sensation in patients with and without OAB.6–11 Some of these studies have used a tablet-based sensation meter that participants used to track real-time, unprompted bladder sensation.6,8 In addition, several previous studies have used three-dimensional (3D) ultrasound to measure bladder volume,12 shape,13 and biomechanics.14 Together, the use of the sensation meter and ultrasound permits non-invasive assessments of bladder sensation and function; however, these techniques require participant training on the use of the sensation meter, and bladder sensation is potentially influenced by pressure from the ultrasound probe. Furthermore, in a comparison of ambulatory and conventional urodynamics, faster filling led to greater voided volumes in healthy volunteers.15 Thus, the fill rate due to diuresis is likely an important consideration in the design of accelerated oral hydration studies. Because many variables can potentially affect bladder sensation during hydration studies, a critical research objective is to study the effects of sensation meter training, ultrasound probe pressure, and fill rate on bladder sensation in order to ensure reproducibility of this protocol so that it can be more broadly applicable in urologic practice.
Therefore, the purpose of the present repeatability study was to validate our non-invasive comparative-fill hydration protocol by specifically evaluating the effects of bladder fill rate, ultrasound probe pressure, and sensation meter training experience on patient-reported real-time bladder sensation during oral hydration studies. In doing so, we aimed to create a validated, reproducible, and non-invasive alternative for the evaluation of real-time bladder sensation.
2 |. METHODS
This prospective study was approved by the Virginia Commonwealth University’s Institutional Review Board. Healthy volunteers without symptoms of urinary urgency were asked to complete the International Consultation on Incontinence Questionnaire on OAB (ICIq-OAB) survey16 and recruited for our comparative-fill oral hydration study.3 Following our previous published methodology,6,8 only participants who scored 0 (never) on question 5a (“Do you have to rush to the toilet to urinate?”) and ≤1 on all other questions were enrolled to ensure that participants had no evidence of OAB.
2.1 |. Study visits
The protocol involved completing two fill and void cycles (Fill 1 and Fill 2) on each of the three separate weekly visits (Visits A, B, and C) at the same time of day (Figure 1A). Study A and B were identical and Study C was performed without the use of ultrasound or BladderScan (Verathon Inc., Bothell, Washington) (except directly before and after each void to measure total volume and post-void residual [PVR]). Studies were performed either in morning slots (10 AM) or in afternoon slots (2 PM). Participants were instructed to be consistent with the food and drink intake for each visit to minimize variability in bladder filling. To ensure that subjects were not drastically changing their eating habits, their breakfast (for morning slots) or breakfast and lunch (for afternoon slots) on the study day were tracked in a food and beverage journal.
FIGURE 1.
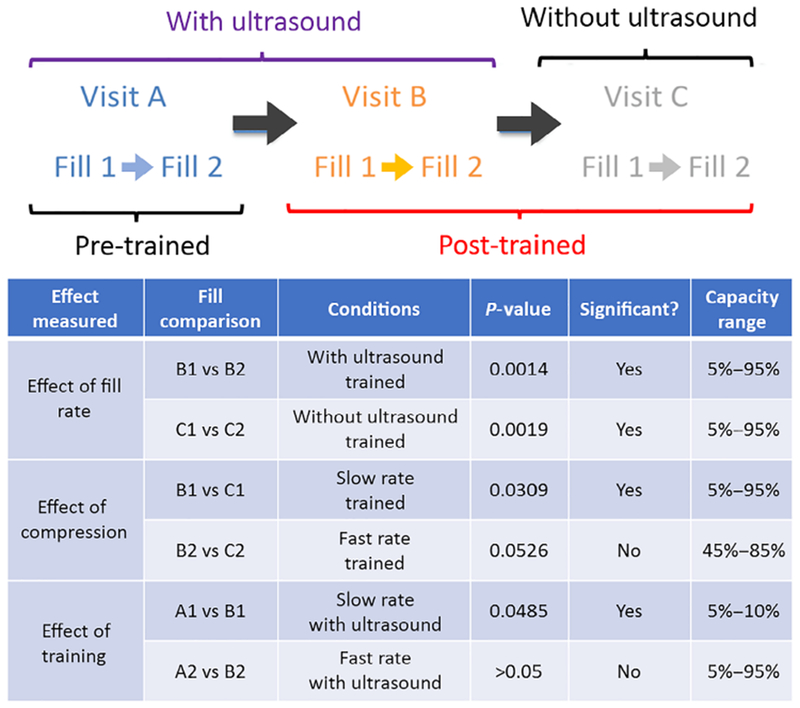
A, timeline of visits A, B, and C along with two fill–void cycles (fill 1 and 2). B, summary of measured effects and results
2.2 |. Training protocol
For the purpose of this study, training was defined as: (a) having received standardized education regarding the details of protocol and the use of the sensation meter; and (b) having undergone two complete fill–void cycles of the protocol. Standardized education involved participants clicking through a premade PowerPoint (Microsoft, Redmond, Washington) presentation that was shown once, just prior to the initiation of the first study (Visit A). During both the presentation and all studies, research personnel were available to answer questions. The presentation detailed the protocol requirements for participants to drink 2 L of Gatorade G2 as quickly as possible to induce a rapid diuresis as shown in other investigations.11 In addition, the standardized education presentation demonstrated the use of the sensation meter (Figure 2), which enables participants to record sensation on a tablet computer by sliding a bar from 0% (defined in the presentation as a completely empty bladder) to 100% (defined in the presentation as a completely full bladder). Participants were also instructed to click on radio buttons corresponding to “first sensation,” “first desire,” and “strong desire” as defined by the International Continence Society (ICS) and given a sheet with complete ICS definitions for these verbal sensory thresholds.17 However, verbal sensory threshold information was not included in this study.
FIGURE 2.

Sensation meter with start and stop buttons (top), slide bar interface (bottom), and verbal sensory threshold radio buttons (right)
The presentation also showed how the ultrasound probe and BladderScan (Verathon Inc., Bothell, Washington) would be applied to the lower abdomen at 5-minute intervals to record volumes, shapes, and micromotion. Participants were instructed that when they reached 100% sensation, the meter recording would be stopped, and they would be quickly escorted to the bathroom and allowed to void into graduated collection devices to measure voided volume. At the start of each visit, participants performed preliminary voids into graduated cylinders to measure voided volumes. Bladder volumes were then measured with both 3D ultrasound and BladderScan to measure PVR volumes. Hydration via consumption of 2 L Gatorade G2 was then initiated and the sensation meter started. At the conclusion of each visit, participants reported ease of device use and device understanding on a scale ranging from 0 (easy) to 10 (difficult). Participants were observed but not prompted. To determine the effects of training on bladder sensation, data were compared from Visit A (pretrained) and Visit B (post-trained).
2.3 |. Ultrasound
During the completion of two complete fill–void cycles, ultrasound images and BladderScan volumes were recorded at 5-minute intervals through all fills. Volumes were determined by taking the average of three BladderScan values to ensure precision and accuracy.18 To determine the effects of ultrasound probe pressure on bladder sensation, data from Visit B (post-trained, with ultrasound) were compared to Visit C (post-trained, without ultrasound).
2.4 |. Volume and fill rate analysis and sensation–capacity curves
Replace the sentence to: “Bladder capacities were calculated as voided volume plus post void residual measured by BladderScan®, and average fill rates were calculated as bladder capacity/fill duration. Because the bladder cannot be assumed to have a linear fill rate,6 BladderScan® volumes were used to generate real-time volume data during filling following our previously published methods.”6 Briefly, a continuous bladder volume curve was developed for the first fill for each individual participant by fitting a second-order polynomial to the BladderScan volume data for each 5% capacity increment. Because the volume cannot be less than zero, any negative portion of this volume curve was set to 0 mL. In addition, because the volume cannot decrease without voiding or leakage, if the curve was convex, the decreasing segment was replaced with a line from the initial volume to the vertex. To provide estimated volume curves for Visit C, for which only initial and final volume measurements were conducted, the coefficients from the curves for Visit B were linearly scaled to match the initial and final volumes for the corresponding fills from Visit C. All volume data were normalized to percentage capacity in order to compare curves between individuals. Area under the curve (AUC) analyses were used to compare sensation–capacity curves. The effects to be measured and compared are summarized in Figure 1B.
2.5 |. Statistical analysis
All data are reported as the mean ± SEM. Sensation–capacity curves were generated using mean values and compared using AUC analyses. Areas under the sensation–capacity curve were calculated for individual participants using the trapezoidal rule for specific capacity ranges. Data greater than 95% capacity were not used because all participants, by definition, reached 100% sensation at 100% capacity. All statistics were computed using Microsoft Excel (Redmond, WA), and differences were considered significant at two-tailed P < 0.05.
3 |. RESULTS
Ten participants (three male, seven female) completed all visits of the hydration protocol (60 total fill–void cycles). Participant characteristics included a mean age of 24.5 ± 1.1 years and mean body mass index of 24.3 ± 1.1 kg/m2. All participants were healthy and did not take any medications known to affect bladder function. Survey scores for ease of device use and device understanding were both 0.05 ± 0.05, demonstrating that the device was extremely easy to use and understand.
3.1 |. Effect of fill rate
Fill durations were significantly shorter for Fill 2 than Fill 1 for all three visits (79.9 ± 3.6 vs 45.7 ± 4.4 min for Fill 1 vs Fill 2 for all visits respectively; P < 0.0001). Curve fits of intermittent BladderScan data from Visits A and B used to estimate of bladder volume throughout filling had mean R2 values of 0.98 ± 0.01 and 0.97 ± 0.01 for Fill 1 and Fill 2, respectively. For the three visits, bladder capacities were greater for 25 of 30 (83.3%) Fill 2 compared with the immediately preceding Fill 1. Moreover, mean capacities were significantly greater for Fill 2 than Fill 1 (603 ± 34 vs 546 ± 30 mL respectively; P = 0.022). As a result, mean fill rates were significantly greater for Fill 2 than Fill 1 (15.3 ± 1.1 vs 7.2 ± 0.5 mL/min, respectively; P < 0.0001). Thus, Fill 1 may subsequently be called the “slow fill” and Fill 2 the “fast fill”. When comparing Fill 1 and Fill 2 in trained participants, there was a significant decrease in sensation (right shift) throughout filling (5% to 95% capacity) both with ultrasound (Figure 3A, Visit B) and without ultrasound (Figure 3B, Visit C).
FIGURE 3.
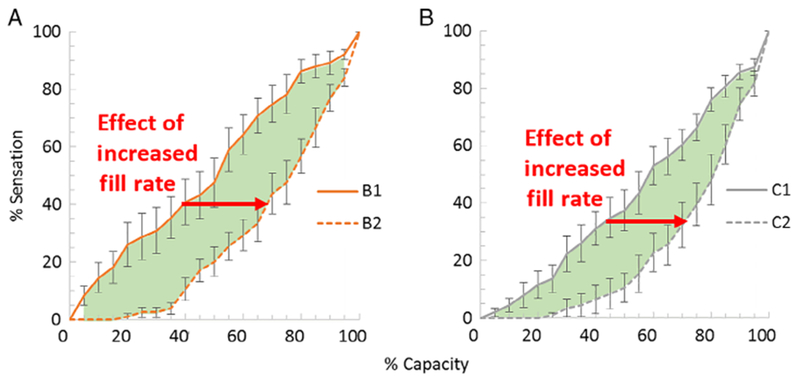
Effects of fill rate on bladder sensation–capacity curves A, with and B, without ultrasound. Sensation–capacity curves are shown for fill 1 (solid lines, slower filling) and fill 2 (dashed lines, faster filling). Increased fill rate led to decreased sensation (right shift) from 5% to 95% of capacity (P < 0.002; green-shaded regions; area under curve analysis; n = 10)
3.2 |. Effect of ultrasound probe pressure
During slower filling in Fill 1, there was a significant increase in sensation (left shift) throughout filling (5% to 95% capacity) when participants experienced incremental ultrasounds (Visit B) compared with when they did not (Visit C; Figure 4A). This demonstrates heightened sensation associated with ultrasound probe pressure. A similar but smaller trend in sensation (left shift) due ultrasound probe pressure was observed during faster filling in Fill 2, and this effect approached statistical significance from 45% to 85% of capacity (Figure 4B; P = 0.0526, n = 10).
FIGURE 4.

Effects of ultrasound probe pressure on bladder sensation–capacity curves at A, slower and B, faster fill rates. Sensation–capacity curves are shown for filling with (orange lines) and without (gray lines) ultrasound. A, ultrasound probe pressure led to increased sensation (left shift) from 5% to 95% of capacity during slower filling (P = 0.0309; green-shaded region; area under curve analysis; n = 10). B, a similar increase in sensation (left shift) due ultrasound probe pressure was observed during faster filling, and this effect approached statistical significance from 45% to 85% of capacity (P = 0.0526; yellow-shaded region; n = 10)
3.3 |. Effect of training
When comparing Fill 1 in pretrained (Visit A) and post-trained (Visit B) participants, higher sensation was reported at low volumes (5% to 10% capacity) when participants were untrained or inexperienced with the sensation meter (Figure 5A). However, there were no differences in sensation in Fill 2 between the pretrained and post-trained visits (Figure 5B).
FIGURE 5.

Effect of training on bladder sensation in Fill 1 (A, solid lines) and Fill 2 (B, dashed lines). Sensation–capacity curves are shown for the pretrained visit (blue lines) and the post-trained visit (orange lines). A, higher sensation was reported from 5% to 10% of capacity when participants were untrained or inexperienced with the sensation meter (P = 0.0485; green-shaded region; area under curve analysis; n = 10). B. Sensation–capacity curves for fill 2 were not different before and after training
3.4 |. Hydration protocol repeatability
An important finding of this study was the repeatability of the sensation–capacity curves for the hydration protocol with intermittent ultrasound (Figure 5B, Fills A2 and B2). Figure 6 shows sensation–capacity curves for all visits and fills compiled into one graph without standard error bars for clarity.
FIGURE 6.

Sensation–capacity curves for all visits and fills. Sensation–capacity curves during faster filling with ultrasound (dashed lines, A2 vs B2) were not different
4 |. DISCUSSION
The key findings of this investigation were that the comparative-fill oral hydration protocol with intermittent ultrasound was repeatable for multiple study visits (Figure 5B), that the experience of one fill with the sensation meter provided sufficient training (Figure 5A), and that both bladder filling rate and external bladder compression affect the sensation–capacity relationship (Figures 3–4). Overall, this study helped validate our non-invasive hydration protocol and suggests that a two-fill hydration protocol with ultrasound can show highly reproducible results if data from the second fill are used for analysis.
Training or experience with the sensation meter caused a decrease in sensation (right shift) at lower capacities during the Fill 1 of the first visit (A), but did not affect the second visit (B). Training may increase participants’ awareness of their own bladder sensation early in the first fill. In addition, a second fill–void cycle may have more constant fill rates as the speed of bladder filling increases.6 With a constant fill rate, an individual’s “awareness” during filling also increases, which may decrease variation in bladder sensations.19 Previous studies have suggested there is some “learning” effect as participants consciously evaluate their bladder sensations, further contributing to awareness and perceived sensations.10
Interestingly, the increased fill rate during the second fill of each visit caused a substantial decrease in sensation in all visits. In contrast, a previous study showed that in healthy participants there is an increase in bladder sensation (left shift in the sensation–capacity curve) when comparing Fill 1 to Fill 2;6 however, that study assumed linear filling during both fills. The use of ultrasound in the present study to intermittently measure volumes throughout filling likely permitted more accurate sensation–capacity curves. This assumption is supported by imaging data from the previous study that showed that the rate of filling increased throughout the first fill of the hydration protocol.6 The decrease in sensation and increase in bladder volumes observed with faster filling in the present study are consistent with previous studies. Robertson et al.15 compared ambulatory and conventional urodynamics and found that faster filling led to greater voided volumes in healthy volunteers, and Thuroff et al.20 found that the desire to void occurred at smaller volumes in telemetric studies during natural filling compared with conventional cystometry with faster filling in healthy men. Sorensen et al.21 performed a four-fill urodynamics study in which they varied the fill rate (60 or 120 mL/min) and participant posture (sitting or supine). These authors identified increased volume at first sensation and increased capacity in the fourth fill compared with the first fill in most groups, regardless of whether the fourth fill was faster or slower.21 This is consistent with a urodynamics repeatability study in healthy women by Gupta et al. that found that first sensation and first desire occurred at greater volumes during a second fill at the same rate of 50 mL/min.4 Together, these studies suggest that adaptation to repeated filling could have contributed to the decreased sensation in the faster fill of the present hydration study.
Ultrasound probe pressure caused an increase in sensation (left shift) throughout slower filling. This was expected because ultrasound probe pressure likely deforms the bladder into an inefficient shape, stretching the bladder wall and increasing bladder wall tension, and it is well-established that tension-sensitive bladder afferents are in series with detrusor smooth muscle.22,23 Indeed, according to the Law of Laplace, where wall tension is related to the radius of a fluid-filled vessel, any deviation from an unconstrained filling shape due to ultrasound probe pressure could create areas of heightened strain and lead to increased bladder sensation. In this regard, many prior studies have shown that bladder shape may be important in OAB.24 Glass et al.13 showed differences in bladder shape between individuals with and without OAB, and Atesci et al.25 recently demonstrated that changes in bladder shape may contribute to lower urinary tract symptoms in men, which “may be improved if modifiable factors including increased waist circumference and loosening of the urachus are corrected”. Likewise, Habteyes et al.26 demonstrated that during filling the wall stress of the bladder increases significantly during a load. Furthermore, Mutsumoto et al.27 showed an increase in patient-reported urgency in neuroexcitation using functional near-infrared spectroscopy of the brain and subject-reported urgency due to 5 seconds of manual abdominal compression.
By adding an external pressure to the bladder wall, there is an increase of pressures generated on the bladder that mimics an intra-abdominal force. Currently, obesity is associated with incontinence, which improves with weight loss, thought to be related to the “association between BMI and abdominal circumference with intra-abdominal and intravesical pressure”.28 In addition, changes in bladder sensation and pressure development may also be affected by intra-abdominal forces including rectal distension.29
A rise in intravesical pressures has been thought to contribute to stress incontinence by a chronic weakening of pelvic floor innervation and musculature.30 However, acutely on a biomechanical level, afferent fibers that terminate peripherally in the urinary bladder also respond to stimuli that include intravesical pressures to generate sensation. The activation of these nerves has been shown to stimulate micturition reflexes.31 Therefore, at higher capacities and sensations, there is more variation generated from the external pressure of the ultrasound probe. Ultimately, it is important to consider these aspects of bladder sensation development that contribute to the development of lower urinary tract symptoms and disorders of the bladder.31
This study had limitations, including the young age of participants with low BMI who also did not have any symptoms of OAB. However, the purpose of this repeatability study was to characterize the effects of three important variables on real-time bladder sensation that are present during oral hydration studies. The study is also limited by the small sample size. However, because each patient underwent three separate visits with two separate fills analyzed, there was a total of 60 complete fill and void cycles, yielding a robust dataset. Finally, the use of averaged data may not be applicable to every individual, and further studies with defined confidence intervals will be required to generate individualized sensation curve nomograms.
Future studies are needed to differentiate the effects of fill rate and adaptation to repeated filling during comparative-fill hydration studies. Ideally, randomization of the order of slow and fast filling would be helpful, but was not possible using the present hydration protocol in which slow filling precedes fast filling. In addition, studies are needed to elucidate the mechanisms responsible for the counter-intuitive decrease in sensation and increase in capacity during faster filling. Furthermore, abdominal compression could be used as a novel, non-invasive tool to manipulate and evaluate bladder sensation during hydration studies.
This validation study in healthy participants without OAB demonstrated the effects of sensation meter training, fill rate, and abdominal ultrasound probe pressure on real-time bladder sensation during accelerated oral hydration. The results indicate that lack of training or inexperience with the sensation meter only affects the first fill. In addition, ultrasound probe pressure significantly increased sensation during slower filling. Finally, faster filling decreased sensation throughout filling with and without simultaneous ultrasound. Most importantly, after training, the second fill of the oral hydration protocol with intermittent ultrasound was repeatable from the first to second visit. These data can be used as baseline for future investigations involving sensation patterns in individuals with OAB and other forms of voiding dysfunction. In addition, results from this investigation are necessary to clarify variables that may affect bladder sensation in the ongoing development of novel, non-invasive ultrasound-based bladder function metrics that could ultimately supplement or replace standard urodynamic studies.
ACKNOWLEDGMENTS
The study was funded by a grant from the United States National Institutes of Health (R01-DK 101719) and by the Virginia Common-wealth University School of Medicine Summer Research Fellowship Program.
Funding information
National Institute of Diabetes and Digestive and Kidney Diseases, Grant/Award Number: R01 DK101719; Virginia Commonwealth University School of Medicine, Grant/Award Number: Summer Research Fellowship Program
Footnotes
DISCLOSURE
No authors have any conflicts of interest with the study.
REFERENCES
- 1.Coyne KS, Sexton CC, Vats V, Thompson C, Kopp ZS, Milsom I. National community prevalence of overactive bladder in the United States stratified by sex and age. Urology. 2011;77:1081–1087. [DOI] [PubMed] [Google Scholar]
- 2.Pelman RS. Overview of overactive bladder, prostatitis, and lower urinary tract symptoms for the primary care physician. Rev Urol. 2004;6 (Suppl 1):S16–S23. [PMC free article] [PubMed] [Google Scholar]
- 3.Winters JC, Dmochowski RR, Goldman HB, et al. AUA/SUFU guidelines: urodynamics. http://www.auanet.org/education/guidelines/adult-urodynamics.cfm. Published 2012. Accessed 22 February 2019.
- 4.Gupta A, Defreitas G, Lemack GE. The reproducibility of urodynamic findings in healthy female volunteers: results of repeated studies in the same setting and after short-term follow-up. Neurourol Urodyn. 2004;23:311–316. [DOI] [PubMed] [Google Scholar]
- 5.Leitner L, Walter M, Sammer U, Knupfer SC, Mehnert U, Kessler TM. Urodynamic investigation: a valid tool to define normal lower urinary tract function? PLoS One. 2016;11:e0163847. [DOI] [PMC free article] [PubMed] [Google Scholar]
- 6.Nagle AS, Speich JE, De Wachter SG, et al. Non-invasive characterization of real-time bladder sensation using accelerated hydration and a novel sensation meter: an initial experience. Neurourol Urodyn. 2017; 36:1417–1426. [DOI] [PMC free article] [PubMed] [Google Scholar]
- 7.Heeringa R, van Koeveringe GA, Winkens B, van Kerrebroeck PE, de Wachter SG. Do patients with OAB experience bladder sensations in the same way as healthy volunteers? A focus group investigation. Neurourol Urodyn. 2012;31:521–525. [DOI] [PubMed] [Google Scholar]
- 8.Naimi HA, Nagle AS, Vinod NN, et al. An innovative, non-invasive sensation meter allows for a more comprehensive understanding of bladder sensation events: a prospective study in participants with normal bladder function. Neurourol Urodyn. 2019;38:208–214. [DOI] [PMC free article] [PubMed] [Google Scholar]
- 9.Heeringa R, de Wachter SG, van Kerrebroeck PE, van Koeveringe GA. Normal bladder sensations in healthy volunteers: a focus group investigation. Neurourol Urodyn. 2011;30:1350–1355. [DOI] [PubMed] [Google Scholar]
- 10.De Wachter SG, Heeringa R, Van Koeveringe GA, Winkens B, Van Kerrebroeck PE, Gillespie JI. “Focused introspection” during naturally increased diuresis: description and repeatability of a method to study bladder sensation non-invasively. Neurourol Urodyn. 2014;33: 502–506. [DOI] [PubMed] [Google Scholar]
- 11.Medina Lucena H, Tincello DG. Validation of a water-load protocol to define the pattern of bladder sensation. Int Urogynecol J. 2019;30: 767–772. [DOI] [PMC free article] [PubMed] [Google Scholar]
- 12.Nagle AS, Bernardo RJ, Varghese J, Carucci LR, Klausner AP, Speich JE. Comparison of 2D and 3D ultrasound methods to measure serial bladder volumes during filling: steps toward development of non-invasive ultrasound urodynamics. Bladder (San Franc). 2018;5: 1–7. [DOI] [PMC free article] [PubMed] [Google Scholar]
- 13.Glass Clark S, Nagle AS, Bernardo R, et al. Use of ultrasound urodynamics to identify differences in bladder shape between individuals with and without overactive bladder. Female Pelvic Med Reconstr Surg. 2018; 10.1097/SPV.0000000000000638. [DOI] [PMC free article] [PubMed] [Google Scholar]
- 14.Nagle AS, Klausner AP, Varghese J, et al. Quantification of bladder wall biomechanics during urodynamics: a methodologic investigation using ultrasound. J Biomech. 2017;61:232–241. [DOI] [PMC free article] [PubMed] [Google Scholar]
- 15.Robertson AS, Griffiths CJ, Ramsden PD, Neal DE. Bladder function in healthy volunteers: ambulatory monitoring and conventional urodynamic studies. Br J Urol. 1994;73:242–249. [DOI] [PubMed] [Google Scholar]
- 16.Abrams P, Avery K, Gardener N, Donovan J, Board IA. The international consultation on incontinence modular questionnaire: www.iciq.net. J Urol. 2006;175:1063–1066. [DOI] [PubMed] [Google Scholar]
- 17.Abrams P, Cardozo L, Fall M, et al. The standardisation of terminology of lower urinary tract function: report from the standardisation sub-committee of the international continence society. Neurourol Urodyn. 2002;21:167–178. [DOI] [PubMed] [Google Scholar]
- 18.Zhao L, Liao L, Gao L, et al. Effects of bladder shape on accuracy of measurement of bladder volume using portable ultrasound scanner and development of correction method. Neurourol Urodyn. 2018; 10.1097/SPV.0000000000000638. [DOI] [PubMed] [Google Scholar]
- 19.Eastham JE, Gillespie JI. The concept of peripheral modulation of bladder sensation. Organogenesis. 2013;9:224–233. [DOI] [PMC free article] [PubMed] [Google Scholar]
- 20.Thuroff JW, Jonas U, Frohneberg D, Petri E, Hohenfellner R. Telemetric urodynamic investigations in normal males. Urol Int. 1980;35: 427–434. [DOI] [PubMed] [Google Scholar]
- 21.Sorensen SS, Nielsen JB, Norgaard JP, Knudsen LM, Djurhuus JC. Changes in bladder volumes with repetition of water cystometry. Urol Res. 1984;12:205–208. [DOI] [PubMed] [Google Scholar]
- 22.De Wachter S Afferent signaling from the bladder: species differences evident from extracellular recordings of pelvic and hypogastric nerves. Neurourol Urodyn. 2011;30:647–652. [DOI] [PubMed] [Google Scholar]
- 23.Andersson KE. Detrusor myocyte activity and afferent signaling. Neurourol Urodyn. 2010;29:97–106. [DOI] [PubMed] [Google Scholar]
- 24.Damaser MS, Lehman SL. The effect of urinary bladder shape on its mechanics during filling. J Biomech. 1995;28:725–732. [DOI] [PubMed] [Google Scholar]
- 25.Atesci YZ, Aydogdu O, Karakose A, Pekedis M, Karal O, Senturk U. Does urinary bladder shape affect urinary flow rate in men with lower urinary tract symptoms? Sci World J. 2014;2014:846856. [DOI] [PMC free article] [PubMed] [Google Scholar]
- 26.Habteyes FG, Komari SO, Nagle AS, et al. Modeling the influence of acute changes in bladder elasticity on pressure and wall tension during filling. J Mech Behav Biomed Mater. 2017;71:192–200. [DOI] [PMC free article] [PubMed] [Google Scholar]
- 27.Matsumoto S, Ishikawa A, Kume H, Takeuchi T, Homma Y. Near infrared spectroscopy study of the central nervous activity during artificial changes in bladder sensation in men. Int J Urol. 2009;16:760–764. [DOI] [PubMed] [Google Scholar]
- 28.Lukacz ES, Sampselle C, Gray M, et al. A healthy bladder: a consensus statement. Int J Clin Pract. 2011;65:1026–1036. [DOI] [PMC free article] [PubMed] [Google Scholar]
- 29.De Wachter S, Wyndaele JJ. Impact of rectal distention on the results of evaluations of lower urinary tract sensation. J Urol. 2003;169: 1392–1394. [DOI] [PubMed] [Google Scholar]
- 30.Osborn DJ, Strain M, Gomelsky A, Rothschild J, Dmochowski R. Obesity and female stress urinary incontinence. Urology. 2013;82:759–763. [DOI] [PubMed] [Google Scholar]
- 31.Merrill L, Gonzalez EJ, Girard BM, Vizzard MA. Receptors, channels, and signalling in the urothelial sensory system in the bladder. Nat Rev Urol. 2016;13:193–204. [DOI] [PMC free article] [PubMed] [Google Scholar]