

ABSTRACT
Parkinson disease (PD) is an age-related neurodegenerative disorder associated with misfolded SNCA/α-synuclein accumulation in brain. Impaired catabolism of SNCA potentiates formation of its toxic oligomers. LRRK2 (leucine-rich repeat kinase-2) mutations predispose to familial and sporadic PD. Mutant LRRK2 perturbs chaperone-mediated-autophagy (CMA) to degrade SNCA. We showed greater age-dependent accumulation of oligomeric SNCA in striatum and cortex of aged LRRK2R1441G knockin (KI) mice, compared to age-matched wildtype (WT) by 53% and 31%, respectively. Lysosomal clustering and accumulation of CMA-specific LAMP2A and HSPA8/HSC70 proteins were observed in aged mutant striatum along with increased GAPDH (CMA substrate) by immunohistochemistry of dorsal striatum and flow cytometry of ventral midbrain cells. Using our new reporter protein clearance assay, mutant mouse embryonic fibroblasts (MEFs) expressing either SNCA or CMA recognition ‘KFERQ’-like motif conjugated with photoactivated-PAmCherry showed slower cellular clearance compared to WT by 28% and 34%, respectively. However, such difference was not observed after the ‘KFERQ’-motif was mutated. LRRK2 mutant MEFs exhibited lower lysosomal degradation than WT indicating lysosomal dysfunction. LAMP2A-knockdown reduced total lysosomal activity and clearance of ‘KFERQ’-substrate in WT but not in mutant MEFs, indicating impaired CMA in the latter. A CMA-specific activator, AR7, induced neuronal LAMP2A transcription and lysosomal activity in MEFs. AR7 also attenuated the progressive accumulation of both intracellular and extracellular SNCA oligomers in prolonged cultures of mutant cortical neurons (DIV21), indicating that oligomer accumulation can be suppressed by CMA activation. Activation of autophagic pathways to reduce aged-related accumulation of pathogenic SNCA oligomers is a viable disease-modifying therapeutic strategy for PD.
Abbreviations: 3-MA: 3-methyladenine; AR7: 7-chloro-3-(4-methylphenyl)-2H-1,4-benzoxazine; CMA: chaperone-mediated autophagy; CQ: chloroquine; CSF: cerebrospinal fluid; DDM: n-dodecyl β-D-maltoside; DIV: days in vitro; ELISA: enzyme-linked immunosorbent assay; FACS: fluorescence-activated cell sorting; GAPDH: glyceraldehyde-3-phosphate dehydrogenase; GWAS: genome-wide association studies; HSPA8/HSC70: heat shock protein 8; KFERQ: CMA recognition pentapeptide; KI: knockin; LAMP1: lysosomal-associated membrane protein 1; LAMP2A: lysosomal-associated membrane protein 2A; LDH: lactate dehydrogenase; LRRK2: leucine-rich repeat kinase 2; MEF: mouse embryonic fibroblast; NDUFS4: NADH:ubiquinone oxidoreductase core subunit S4; NE: novel epitope; PD: Parkinson disease; RARA/RARα: retinoic acid receptor, alpha; SNCA: synuclein, alpha; TUBB3/TUJ1: tubulin, beta 3 class III; WT: wild-type
KEYWORDS: Alpha-synuclein, chaperone-mediated autophagy, knockin mouse model, LRRK2, aging, oligomers, Parkinson disease, protein aggregation, protein degradation, therapeutic strategy
Introduction
Parkinson disease (PD) is characterized pathologically by abnormal deposits of SNCA/α-synuclein aggregates in brain and loss of dopaminergic neurons in the substantia nigra pars compacta (SNpc). Its etiology and pathogenesis are thought to involve a complex interplay of aging, genetic susceptibility and environmental factors. Aging is one of the most important risk factors. PD is rare before the age of 50 years, worldwide, but its prevalence increases to 1% among those aged 60 years or above worldwide [1]. Genetic susceptibility plays an important role, with over 25 genes linked to PD [2–4]. Many environmental factors have been implicated, including pesticide exposure. The relative contribution of genetic and environmental factors is different for each individual, giving rise to heterogeneity in clinical features and prognosis.
Genome-wide association studies (GWAS) have linked SNCA (synuclein, alpha) mutations to both familial and sporadic PD [5,6]. This gene encodes for SNCA, a small (14 kDa) protein widely expressed in the brain. It is enriched in presynaptic terminals where it regulates vesicle trafficking. Accumulation and propagation of misfolded SNCA in the brain is integral to the disease pathogenesis, suggesting that impaired cellular handling of this protein likely plays a key role in PD [7,8]. Indeed, SNCA was the first gene identified to cause familial PD. These mutations include missense and multiplication mutations that enhance the propensity of SNCA to aggregate and form abnormal protein structures including its toxic pre-fibrillar oligomeric species [9–11]. SNCA propagates to neighboring neurons, either as free-floating protein molecules or via extracellular vesicles (or exosomes), which then act as a template to seed further aggregation in other brain regions [12,13]. SNCA exists in a dynamic equilibrium amongst different conformations and oligomers [10], and the propensity for its aggregation may be reversed by reduction in monomeric SNCA levels which results in disaggregation of soluble oligomers [14]. SNCA is degraded via both the proteasome and autophagic pathways. Compounds which increase SNCA degradation may represent a therapeutic option to prevent synucleinopathies and slow down progression of PD [15].
Clearance of misfolded proteins and aggregates by chaperone-mediated autophagy (CMA) is essential for normal cellular function, especially in post-mitotic cells such as neurons which cannot dilute accumulated, damaged, and toxic intracellular components by cellular division [16–18]. CMA dysfunction has been described in PD [19–22]. CMA is a subtype of autophagy involving (i) cytosolic protein substrate recognition by the HSPA8/HSC70 (heat shock protein 8) [23], which targets the substrate to lysosomes, (ii) substrate binding and unfolding via LAMP2A (lysosomal membrane receptor type (2a), (iii) formation of a substrate translocation complex with membrane-bound LAMP2A, (iv) substrate degradation by intra-lysosomal enzymes, and (v) disassembly of the translocation complex and degradation of multimeric LAMP2A to be recycled [17,24,25]. The CMA-specific recognition motif (KFERQ) is present in about 30% of cytosolic proteins, including SNCA and LRRK2 (leucine-rich repeat kinase 2), and more proteins can become CMA substrates by post-translational modification upon cellular stress [26,27]. Autophagic activity to degrade aberrant proteins declines with age. This decline underpins the pathogenesis of many neurodegenerative diseases where abnormal protein aggregation occurs [28,29].
LRRK2 mutations are the most common cause of both familial and sporadic PD [2]. Patients with LRRK2-associated PD demonstrate clinical features indistinguishable from typical idiopathic cases. How LRRK2 mutations cause synucleinopathies in PD is still unclear. In our earlier work, we generated a knockin (KI) mouse colony carrying the homozygous LRRK2R1441G mutation [30]. LRRK2R1441G KI mice do not show overt PD symptoms under normal conditions but are more susceptible to external stress [30,31]. These features are similar to those in two other mutant LRRK2 KI mouse colonies of PD, i.e. LRRK2G2019S and LRRK2R1441C [32,33]. Recent studies have linked CMA and PD by showing that both SNCA and LRRK2 are substrates for CMA degradation [20,22,34]. The pathogenic or mutant forms of LRRK2 are thought to bind abnormally to CMA-specific lysosomal LAMP2A, thereby preventing their own degradation and the degradation of other CMA substrates, including SNCA [34,35].
In this study, we hypothesized that LRRK2 mutation impairs degradation of SNCA by partly affecting CMA processes in LRRK2 mutant mice, and such impairment may result in a progressive accumulation of toxic SNCA oligomers in the brain with age. We addressed the question of whether LRRK2 mutation carriers are more susceptible to SNCA accumulation in aging by elucidating the age-dependent changes in the levels of SNCA oligomers and various CMA-related lysosomal proteins in LRRK2R1441G KI mouse brains. We developed a unique fluorescence-based flow cytometry assay using mutant mouse embryonic fibroblasts (MEFs) to elucidate the effects of LRRK2 mutation on intracellular clearance of SNCA. A reference substrate peptide extracted from mouse RNase A (ribonuclease A) protein, which contains the ‘KFERQ’-like pentapeptide (CMA recognition motif), was used as a parallel reference for monitoring CMA degradation. RNase A is the first protein to be identified as a CMA substrate [36,37]. We found that both the total lysosomal activity and clearance of CMA-specific substrates were impaired in LRRK2R1441G KI cells. Furthermore, we treated mutant LRRK2 primary cortical neurons with a specific CMA activator to attenuate intracellular accumulation and extracellular release of SNCA oligomers as a proof of principle whether activation of CMA may be a viable therapeutic option in preventing oligomeric SNCA buildup in aging neurons.
Results
LRRK2R1441G mutation causes age-dependent accumulation of SNCA oligomers in brain
To address whether LRRK2 mutation increases the susceptibility of aging brains to SNCA accumulation, levels of oligomeric SNCA in striatal and cortical soluble lysates from LRRK2R1441G KI mice and their age-matched WT controls were compared using dot-blotting and SNCA oligomer-specific ELISA. To avoid confounding variations in genetic background, these mice were back-crossed with wildtype C57BL/6 mice for at least eight generations. All age-matched WT and KI mice were bred from littermates with identical genetic backgrounds, and they were housed under same husbandry condition.
We measured age-dependent changes in levels of total amyloid-like oligomers in soluble striatal lysates extracted from 3-, 12-, 15- and 18-month old mice by dot-blotting using ‘A11’ conformational antibody, which broadly recognizes all soluble amyloid-like oligomers, but not the monomeric form or mature fibers of SNCA [11,38,39]. We found a significant age-dependent increase in both total soluble SNCA [Age effect: F(3,52) = 12.51, p < 0.0001] and total amyloid-like oligomers in KI mice compared with those occurring in WT [Age effect: F(3,49) = 14.17, p < 0.0001] (Figure 1(a)(i) and (ii)). In younger mice (3- and 12-month old), no statistical significant difference in ‘A11’ oligomer levels between WT and KI mice was observed, but at 15 months a difference became apparent, reaching statistical significance at 18 months of age [Mutation effect: F(1,49) = 10.43, p < 0.01]; Interaction between mutation and age [F(3,49) = 3.556, p < 0.05] (Figure 1(a)(ii)). By using a growth curve model to predict the rate of increase of oligomer levels with age, the doubling time of amyloid oligomer formation in KI mice was predicted to be 15.3 months (95% CI = 10.4 to 29.13), as compared with a longer period of 32.6 months (95% CI = 18.39 to 143.9) for WT mice (Figure 1(a)(iii)). We found no statistical differences in amyloid-like oligomer levels in the CSF between WT and KI mice at both 3-month and 18-month of age (Figure S1).
Figure 1.
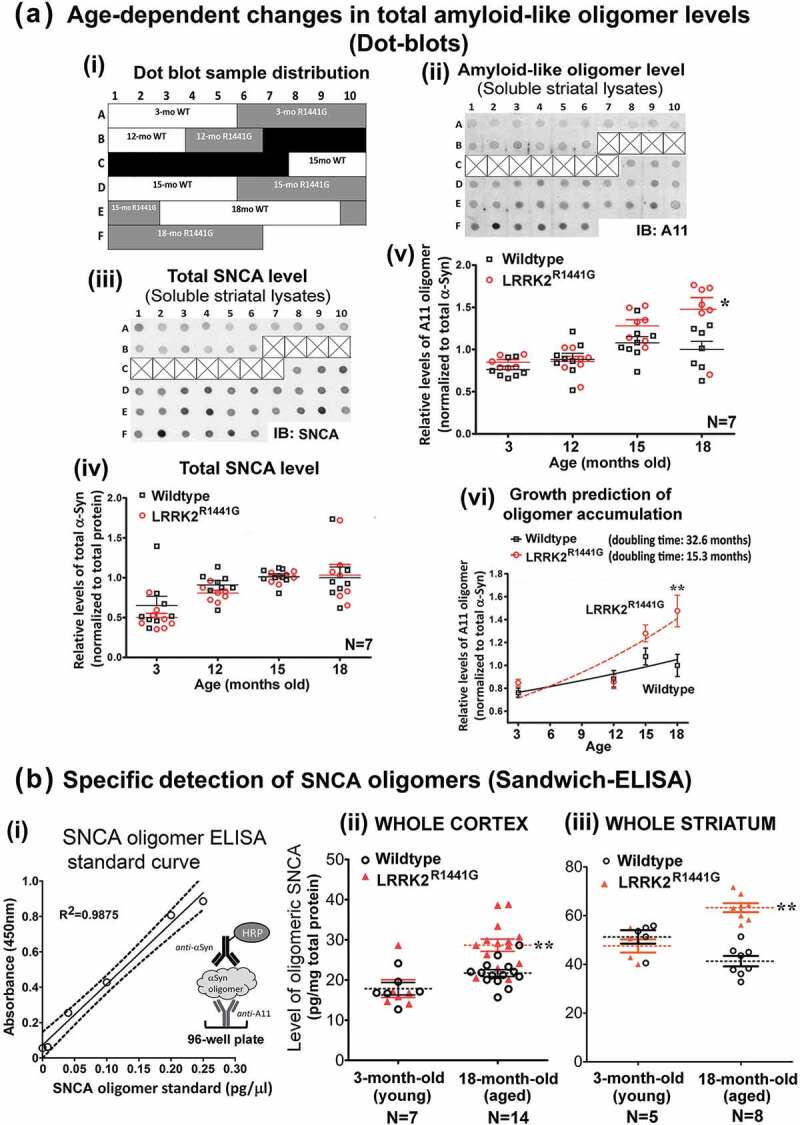
LRRK2R1441G KI mutation caused an age-dependent increase of SNCA oligomers in mouse brain striatum and cortex. (a) (i) Layout of example dot blots shown below, (ii) example of amyloid-like oligomer (‘A11’) dot blots, (iii) example of total SNCA dot blots, (iv) relative levels of total SNCA, (v) relative levels of amyloid-like oligomers in soluble striatal lysates extracted from LRRK2R1441G KI mice and their WT littermates at 3, 12, 15 and 18 months (N = 7). Each data point represents measurement of 1μg striatal lysate from each individual mouse. (vi) Predicted rate of increase of ‘A11’ oligomer levels with age in LRRK2 KI mice was significantly higher than that in WT mice as estimated by mathematical fitting of their corresponding growth curves. Predicted doubling time of oligomer formation in KI mice was 15.3 months (95% CI = 10.4 to 29.13), as compared with 32.6 months (95% CI = 18.39 to 143.9) for WT mice. (b) (i) SNCA oligomer ELISA standard curve. Levels of SNCA oligomer in (ii) striatal soluble lysates, and (iii) cortical soluble lysates from LRRK2R1441G KI mice and their age-matched WT controls determined by a sandwich-ELISA. Quantification of SNCA oligomer in samples was based on (i) a standard curve generated from purified recombinant SNCA oligomer standards (Figure S1). Data are expressed as mean ± S.E.M. Statistical significance at the level of *p < 0.05 and **p < 0.01, as compared to WT controls by post-hoc multiple comparison following two-way ANOVA.
To specifically detect SNCA oligomers in striatal and cortical soluble lysates from KI and WT mice, we performed SNCA oligomer-specific ELISA using ‘A11’ as capturing antibody followed by detection of SNCA oligomers by a polyclonal HRP-conjugated SNCA antibody (Figure 1(b)(i)). Quantification of SNCA oligomers in sample lysates was based on a standard curve (Figure 1(b)(i)) generated from serial dilutions of recombinant SNCA oligomers, which were column-purified from the product mixture formed by an in vitro dopamine-induced oligomerization reaction of monomeric SNCA (Figure S2). In young (3-month old) WT and KI mice, there were no significant difference in the levels of SNCA oligomers in soluble lysates of cortex and striatum (Cortex: 17.8 ± 1.6 pg/mg for WT vs. 17.9 ± 2.2 pg/mg for KI; Striatum: 51.3 ± 2.8 pg/mg for WT vs. 47.6 ± 2.7 pg/mg for KI) (Figure 1(b)(ii)). However, the levels of SNCA oligomers increased by 30.7% in cortex and 53.2% in striatum of aged (18-month old) KI mice, as compared to the levels in age-matched WT mice (Cortex: 21.7 ± 0.9 pg/mg for WT vs. 28.4 ± 1.4 pg/mg for KI; Striatum: 41.3 ± 2.2 pg/mg for WT vs. 63.3 ± 1.8 pg/mg for KI; all p < 0.01). In addition, accumulation of SNCA oligomers in aged KI mouse striatum was demonstrated by significantly more SNCA oligomer staining using a SNCA oligomer-specific antibody ‘Syn33’ as compared with that in their age-matched WT littermates (Figure 2(a)). Furthermore, immuno-staining against total SNCA also revealed more granular structures deposited in the striatum of aged KI mice (Figure 2(b)). In contrast to aged animals, there was no observable difference in the staining pattern and intensity of SNCA between young (3-month old) WT and KI mouse brains (Figure 2(b)). Collectively, our findings from both ELISA and immunohistochemistry illustrated greater deposition of SNCA granules and oligomer formation in LRRK2 KI mouse brains with aging.
Figure 2.
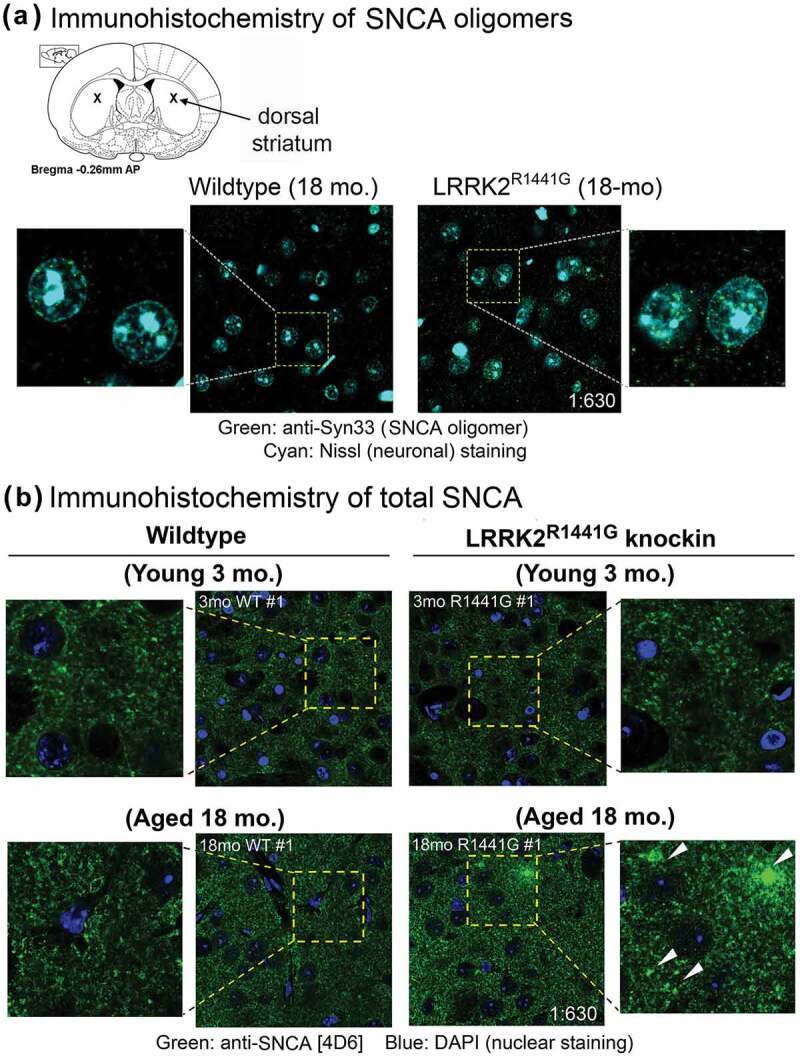
Immunohistochemistry to SNCA oligomers and granules in aged WT and LRRK2R1441G KI mouse striatum. (a) Accumulation of SNCA oligomers in aged (18-month old) mouse dorsal striatum was demonstrated by immunostaining using a SNCA oligomer-specific antibody (‘Syn33’; Merck Millipore™, ABN2265). Aged (18-month old) LRRK2R1441G KI striatum showed significantly more SNCA oligomer staining (green), as compared with that in age-matched WT littermates. Neuronal cell bodies were counterstained by NeuroTrace™ Nissl staining (cyan). (b) More SNCA-positive granules (green; arrowheads) were also seen in aged (18-month old) LRRK2R1441G KI mouse striatum as compared with those in age-matched WT littermates by immunostaining using anti-SNCA [4D6] monoclonal antibody (Abcam™, ab1903). There was no observable difference in the staining pattern and intensity of SNCA in young (3-month old) WT and KI brains, indicating that SNCA aggregation increased with age in LRRK2R1441G KI mice. Magnification: 1 × 630.
Abnormal clustering of lysosomes in LRRK2R1441G knockin mouse embryonic fibroblasts and the aged brain striatum
Different cellular conditions cause a different distribution of lysosomes in the cytoplasm [40]. Clustering of lysosomes at the perinuclear region is a characteristic cellular response reflecting impaired degradation of aberrant proteins [41]. We examined whether LRRK2 mutation affected the cellular lysosome morphology in mutant MEFs and aged KI mice. MEFs carrying LRRK2R1441G mutation, which were cultured under normal conditions, demonstrated more perinuclear clustering of lysosomes stained with lysosome markers, LAMP1 and LAMP2A, without observable differences in cell morphology and viability compared with WT MEFs (Figure 3(a,b)). Similar clustering of lysosomes was also observed in aged (18-month old) LRRK2 KI mouse striatum, but was rarely seen in age-matched WT mice (Figure 3(c)), suggesting lysosomal dysfunction in aged LRRK2 KI mouse brains.
Figure 3.
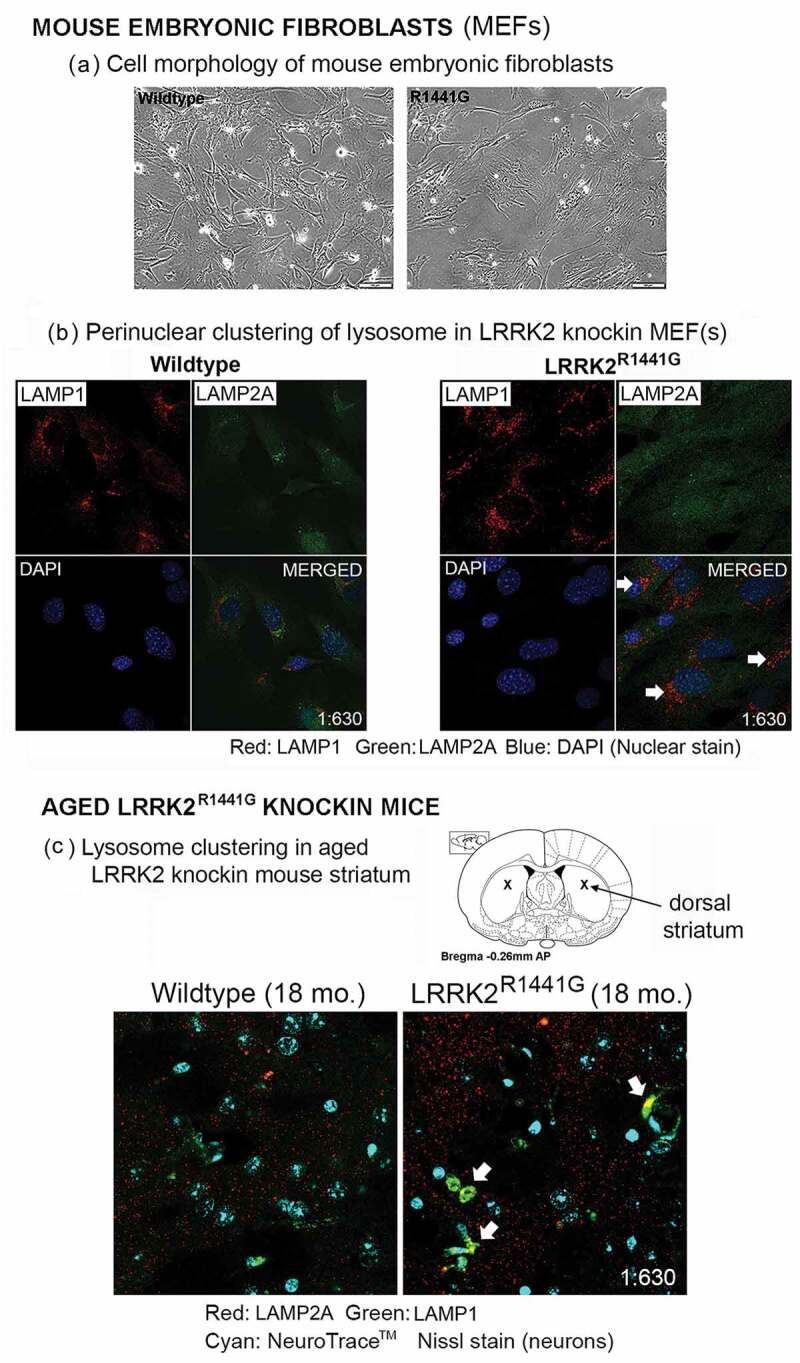
Perinuclear clustering of lysosomes associated with LRRK2R1441G KI mutation. (a) Cell morphology of littermate-matched WT and LRRK2R1441G KI mouse embryonic fibroblasts (MEFs). (b) Lysosomes were visualized by immunofluorescence staining of lysosome marker protein, LAMP1 (red) and CMA-specific LAMP2A (green). LRRK2R1441G KI mutant MEFs cultured under normal condition showed more clustering of lysosomes at around perinuclear region (arrows) without observable change in gross cell morphology and viability. (c) Representative confocal photomicrographs showing more clustering of lysosomes (arrows) in the dorsal striatum of aged (18-month old) LRRK2R1441G KI mice but only rarely found in age-matched WT controls, suggesting impaired cellular protein degradation in LRRK2 KI mouse brains. Neuronal cell bodies were counterstained by NeuroTrace™ Nissl staining (cyan). Magnification: 1 × 630.
Accumulation of CMA-specific lysosomal LAMP2A and HSPA8 in aged LRRK2R1441G KI mouse midbrain and striatum
Unlike LAMP1 which is a transmembrane marker protein expressed in all lysosomes, only those lysosomes which contain LAMP2A and HSPA8 are CMA-active [42]. Hence, the levels of membrane-bound LAMP2A and HSPA8 levels relative to LAMP1 reflect the number of CMA-active lysosomes. Given that lysosomal clustering was seen in LRRK2 KI cells, we determined whether accumulation of SNCA oligomers in aged KI murine brains was associated with perturbation of CMA-active lysosomes. We fractionated total tissue lysates from aged (18-month old) WT and KI mouse striatum and examined the relative amounts of membrane-bound and cytosolic LAMP2A and HSPA8 by western blotting. LAMP1 expression levels were similar between aged WT and KI mice. However, when compared with age-matched WT, aged KI mouse striatum had a significantly higher level of membranous LAMP2A (N = 11; p < 0.05) and HSPA8 (N = 11; p < 0.01) relative to LAMP1 (Figure 4(a)(i) and (ii)), indicating accumulation of LAMP2A- and HSPA8-containing complexes on the lysosomal membrane. In contrast, there was no difference in the levels of soluble LAMP2A and HSPA8 in the cytosol (N = 11) (Figure S3). To verify that CMA was perturbed in the LRRK2 KI mouse brains, we also measured the levels of GAPDH (a conventional CMA substrate) in these fractions. In the same striatal lysates where we found increased membranous LAMP2A and HSPA8, GAPDH levels were also significantly increased in both membrane (N = 6; p < 0.01) (Figure 4(a)(i) and (ii)) and cytosolic fractions (N = 11; p < 0.05) (Figure S3) of aged KI mice, suggesting CMA substrate accumulation due to impaired CMA.
Figure 4.
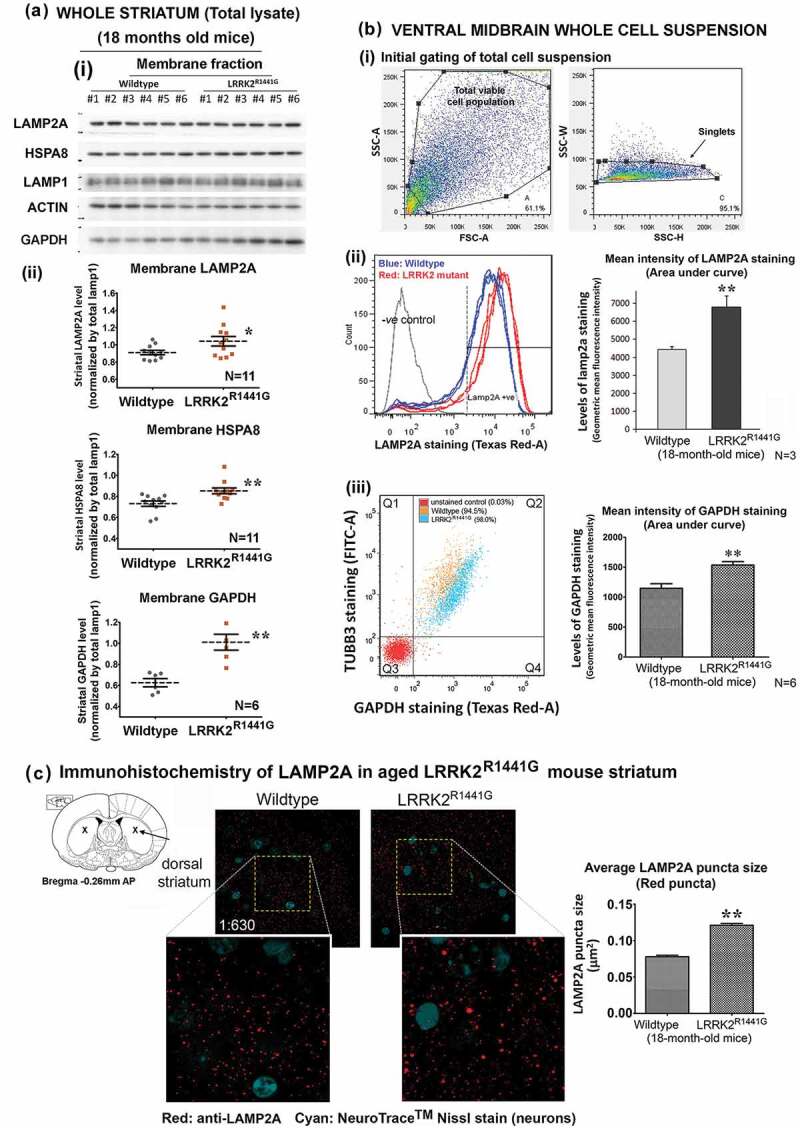
Increased levels of CMA-associated lysosomal LAMP2A, and HSPA8 protein in the striatum and ventral midbrain of aged LRRK2R1441G KI mice compared with those in age-matched WT mice. (a)(i) Whole mouse striatum was dissected and homogenized by sonication in cold PBS supplemented with a protease inhibitor cocktail (Sigma Aldrich™, 11836153001) to isolate the cytosolic fraction. The insoluble pellets consisting of total cellular membranous fraction were completely dissolved in 1% DDM (n-dodecyl-β-D-maltoside) for SDS-PAGE and western blotting, # indicates solubilized lysate from individual mice; (ii) Densitometry analysis of western blots showed that LAMP2A (N = 11), HSPA8 (N = 11) and a well-described CMA substrate, GAPDH (N = 6), were significantly increased in membranous fractions of mouse LRRK2R1441G KI striatum as compared to WT mice. (b) Freshly dissected ventral midbrains of aged WT and LRRK2R1441G KI mice were dissociated by papain to obtain single cell suspension, and were subsequently stained for LAMP2A and GAPDH using an excess amount of antibodies. (i and ii) Total cellular levels of LAMP2A in both WT and LRRK2R1441G KI mice were compared using flow cytometry based on the mean staining intensity (area under curve) of the protein. Ventral midbrain LAMP2A level in aged LRRK2R1441G KI mice was significantly higher as compared with that in their age-matched WT controls (N = 3). (iii) Relative amount of GAPDH in neurons was measured in flow cytometry after co-staining of GAPDH and neuronal marker protein TUBB3. The mean staining intensity (area under curve) of double-positive cell population (Q2) showed that GAPDH level was significantly higher in aged LRRK2R1441G KI mouse midbrain neurons (N = 6). Data are expressed as mean ± S.E.M. Statistical significance by unpaired t-test at the level of *p < 0.05 and **p < 0.01, as compared to WT controls. (c) Immunohistochemistry of LAMP2A in aged mouse striatum revealed abnormal lysosomal LAMP2A accumulation as shown in the form of bigger puncta (red) in LRRK2R1441G KI mice, suggesting perturbed CMA. Average puncta size calculation was based on random puncta images from aged WT and KI mouse striatum (N = 3), respectively. Statistical significance by unpaired Student’s t-test at the level of **p < 0.01, as compared to WT controls.
As our results of increased striatal membranous LAMP2A levels appeared contradictory to the belief that LAMP2A levels reflect CMA activity, we verified our findings by measuring the amounts of LAMP2A in ventral midbrain whole cell suspension freshly dissociated from KI and WT mice using flow cytometry. Briefly, the ventral midbrain region of both aged WT and KI mice were dissected and dissociated to obtain total viable cell suspensions (Figure 4(b)(i)). These cell suspensions were stained by an excess amount of anti-LAMP2A which then was conjugated with red fluorescence. The resultant fluorescent intensity in cell suspensions, which is proportional to the amount of total cellular LAMP2A, was gated and measured by flow cytometry (Figure 4(b)(i) and (ii)). Our results showed that the mean intensity of red fluorescence in KI cells was significantly greater than the mean intensity in WT cells by 54% (N = 3; p < 0.01), indicating that the amount of total cellular LAMP2A in aged LRRK2 KI ventral midbrain cells was significantly higher than WT mice (Figure 4(b)(ii)). In addition to LAMP2A, we determined the relative amount of GAPDH in the same cell suspensions by staining with excess amount of primary antibody against GAPDH. These cells were co-stained with a neuron-specific marker protein, TUBB3/TUJ1 (neuron-specific class III β-tubulin), which enabled differentiation of GAPDH staining in neurons from other cell types (double-positive cells gated in Q2; Figure 4(b)(iii)). Our results showed that the mean staining intensity of GAPDH was significantly higher in aged KI mouse midbrain neurons by 33.9% (N = 6; p < 0.01) as compared to WT cells (Figure 4(b)(iii)). This finding confirmed the increase of GAPDH levels found in the aged KI striatal membrane fractions by western blots (Figure 4(a)(ii)).
Furthermore, we performed immunohistochemistry to visualize accumulation of LAMP2A in aged KI mouse dorsal striatum. LAMP2A-positive lysosomes were found throughout the whole region in both neurons (Nissl-positive) and non-neuronal (Nissl-negative) cells. However, compared with that present in age-matched WT mice, KI striatum demonstrated abnormal accumulation of LAMP2A in the form of significantly larger puncta in KI mice (N = 3; p < 0.01), indicating LAMP2A aggregation on LRRK2 KI mouse brain lysosomes (Figure 4(c)).
Development of a photoactivatable fluorescence-based cell assay to determine the rate of cellular substrate protein clearance
Our observation of abnormal clustering of lysosomes, accumulation of membranous LAMP2A and HSPA8, and the CMA substrate GAPDH proteins in LRRK2 mutant mouse striatum suggested that cellular CMA-associated lysosomal degradation may be impaired in cells with the mutation. Since CMA contributes to endogenous SNCA degradation, we compared the rate of SNCA clearance in WT and LRRK2 KI cells. We developed a new cell-based assay using MEFs to monitor the rate of cellular clearance of two artificial substrate protein constructs, one encoding for full-length SNCA (pSIN-PAmCherry-SNCA-NE) and the other a 20-amino acid peptide segment from mouse ribonuclease A (RNase A) which consists of a CMA recognition motif – ‘KFERQ’ (pSIN-PAmCherry-KFERQ-NE). MEFs were isolated from littermates of either WT or LRRK2 KI mouse embryos, and were transduced with lentivirus to drive the cells to express either SNCA or ‘KFERQ’-peptide conjugated with photoactivatable PAmCherry and a protein tag designated as ‘NE’ (Figure 5(a)). ‘NE’ is a novel synthetic 18-amino-acid epitope tag for specific immuno-detection and quantification [43–45]. These transduced MEFs were FACS-sorted and selected in culture with puromycin to ensure stable expression of the target substrate protein. After transduction, expression of either, (i) PAmCherry-SNCA-NE (27 + 14 + 2 = 43 kDa) or (ii) PAmCherry-KFERQ-NE (27 + 1 + 2 = 30 kDa) protein in the total cell lysates were confirmed by western blots against mCherry, SNCA, and NE tag expression simultaneously (Figure 5(b)). Immunocytochemistry against NE tag also confirmed expression of PAmCherry-SNCA-NE protein in both WT and KI MEFs (Figure 5(c)).
Figure 5.
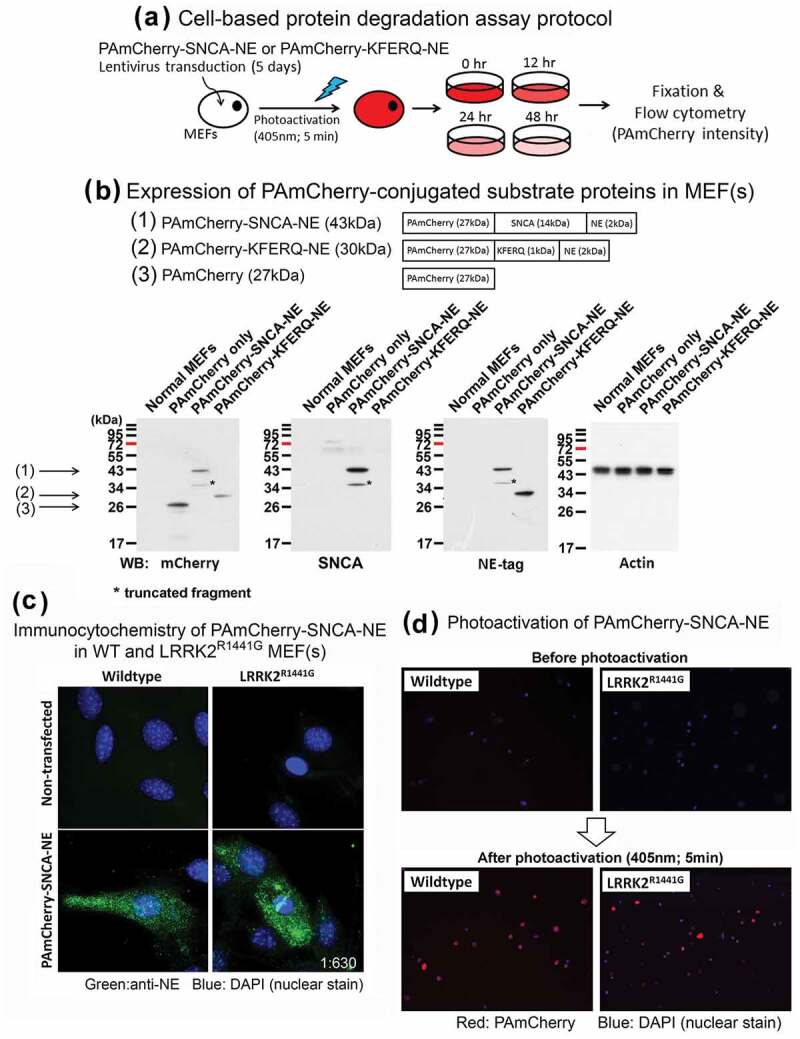
Development of a photoactivatable fluorescence-based cell culture model to determine rate of cellular clearance of SNCA and a CMA-specific KFERQ-peptide. (a) Wildtype or LRRK2R1441G KI mutant mouse embryonic fibroblasts (MEFs) were transduced with lentivirus for 5 days to express either full-length SNCA or KFERQ-peptide conjugated with photoactivatable PAmCherry protein and a novel protein tag ‘NE’ for detection. (b) Expression of correct target protein was confirmed in each MEF clones by western blotting based on verification of their corresponding protein size using antibodies against SNCA, mCherry, and NE. (c) PAmCherry-SNCA-NE protein expressed in both WT and LRRK2R1441G KI mutant MEF(s) was visualized by immunocytochemistry against NE tag (green); Magnification: 1 × 630. (d) MEF(s) expressing SNCA or KFERQ-peptide were exposed to UV-A (405 nm) for 5 min to induce mCherry fluorescence emission. Magnification: 1 × 40.
After confirming the expression of the target proteins with correct expected sizes (i.e. PAmCherry-SNCA-NE and PAmCherry-KFERQ-NE), these stably transduced MEFs were exposed under UV-A lamp (405 nm) for 5 min to induce photoactivation of PAmCherry-conjugated proteins. Cells prior to and after photoactivation were examined under fluorescent microscopy to monitor transduction efficiency. There were no observable fluorescent signals shown in all transduced cells before photoactivation (Figure 5(d)). However, these cells emitted intense red (i.e. PAmCherry) fluorescence immediately after photoactivation (i.e. t = 0) (Figure 5(d)), indicating expression of target PAmCherry-conjugated proteins (i.e. PAmCherry-SNCA-NE or PAmCherry-KFERQ-NE).
The initial fluorescence intensity after photoactivation reflects the basal level of substrate proteins for subsequent cellular degradation and clearance. As the photoactivated proteins were gradually metabolized by the cells, the levels of cellular fluorescence declined over time. This decline was quantified using flow cytometry. The initial intensity of photoactivated PAmCherry fluorescence increased significantly in both WT and KI MEFs after photoactivation (i.e. t = 0), as compared with their corresponding control cells before photoactivation (N = 7; all p < 0.01) (Figure S4). There was no significant difference in the initial fluorescence intensity between WT and KI MEFs expressing either PAmCherry-SNCA-NE or PAmCherry-KFERQ-NE (Figure S4).
We stably expressed PAmCherry-KFERQ-NE in MEFs as a CMA target substrate for monitoring cellular clearance in parallel with clearance of SNCA, which is also a known CMA substrate. To demonstrate that PAmCherry-KFERQ-NE is a valid reference CMA substrate, we performed co-immunoprecipitation experiments to demonstrate CMA substrate recognition by HSPA8. Results from immunoprecipitation studies showed that PAmCherry-KFERQ-NE protein was co-immunoprecipitated with HSPA8, indicating CMA substrate recognition by HSPA8 (Figure S5). Such binding with HSPA8 was not observed in cells expressing a non-CMA substrate, (PAmCherry-KFSDA-NE), where the CMA recognition motif was mutated (‘KFERQ’→”KFSDA”). These results indicate that ‘KFERQ’ pentapeptide in the PAmCherry-KFERQ-NE substrate protein sequence is critical for recognition by CMA-specific degradation.
Slower rate of cellular clearance of SNCA and CMA-specific substrate peptide in LRRK2R1441G mutant mouse embryonic fibroblasts
In order to address whether the accumulation of SNCA oligomer in aged KI mice was associated with impaired cellular protein degradation, we measured the rate of cellular clearance of SNCA using the photoactivatable fluorescence-based cell assay described above. Both WT and KI MEFs stably expressing either PAmCherry-SNCA-NE or PAmCherry-KFERQ-NE were fixed and collected immediately after photoactivation. After determining the basal levels of substrate protein, the mean intensities of PAmCherry fluorescence in each of the WT and KI cells was determined at different time points (0, 12, 24, 48 h) after photoactivation in order to establish the rate of cellular clearance of either PAmCherry-SNCA-NE (Figure 6(a)) or PAmCherry-KFERQ-NE (Figure 6(b)). The rate of total cellular clearance was expressed as a percentage of PAmCherry fluorescence intensity that remained in WT and KI MEFs compared to their respective basal levels at t = 0. Our results showed that the clearance rate of SNCA conjugates over 48 h in KI MEFs measured as percentage decline of fluorescence per hour in culture was significantly lower than WT [WT: −0.935% per hour (t1/2: 49.9 h) vs. KI: −0.671% per hour (t1/2: 73.6 h) [two-way ANOVA; F(1,24) = 17.93, p < 0.001]. Levels of photoactivated SNCA conjugates in KI MEFs were significantly higher than those which remained in WT cells at both 24 and 48 h (N = 5; all p < 0.01). Similarly, the clearance rate of ‘KFERQ’-peptide in KI MEFs was also significantly lower than the rate in WT (WT: −1.154 ± 0.086% per hour vs. KI: −0.759 ± 0.09% per hour) [two-way ANOVA; F(1,64) = 39.36, p < 0.001]. Similar to SNCA conjugates, levels of photoactivated ‘KFERQ’-peptide in KI MEFs were significantly higher than those which remained in WT cells at both 24 and 48 h (N = 8; all p < 0.01). Furthermore, similar clearance assays in WT and KI MEFs expressing PAmCherry-KFSDA-NE (mutated ‘KFERQ’ pentapeptide) showed that the clearance rate of this non-CMA substrate protein was similar between WT and KI cells (Figure 6(c)).
Figure 6.
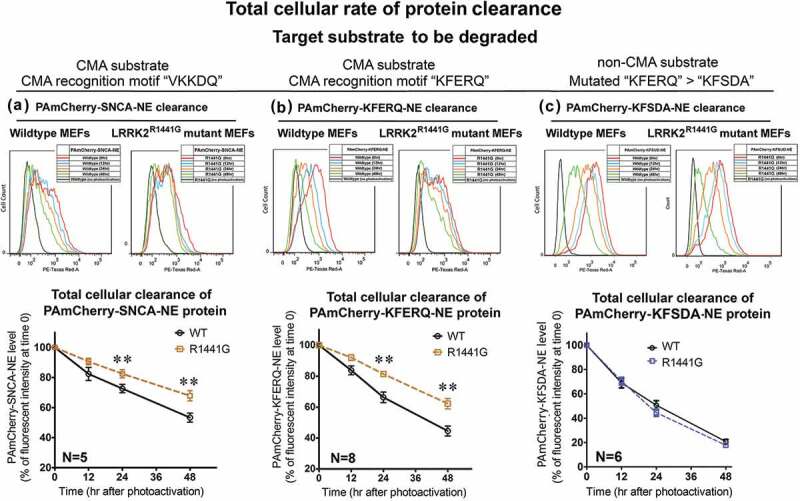
LRRK2R1441G KI mutant MEFs catabolize SNCA and ‘KFERQ’ substrate peptide more slowly because of impaired LAMP2A-mediated protein clearance. Representative flow cytometry intensity plots of photoactivated WT and LRRK2 KI MEFs harvested at different time points for (a) SNCA; (b) ‘KFERQ’ substrate peptide; and (c) ‘KFSDA’ (‘KFERQ’ mutant) substrate peptide. The rate of protein catabolism was expressed as time-dependent change in levels of PAmCherry fluorescence in both WT and mutant MEFs compared with the level at time t = 0. LRRK2R1441G KI mutant cells have a significantly lower rate of cellular protein clearance as compared with that of WT cells (N = 5–8). Data are expressed as mean ± S.E.M. **p < 0.01 represents statistical significance as compared to WT MEFs at the respective time points by post-hoc multiple comparisons after two-way ANOVA.
Lysosomal dysfunction and impairment in CMA-associated substrate degradation in LRRK2R1441G mutant mouse embryonic fibroblasts
We next addressed whether the lower rate of substrate clearance in LRRK2 KI cells was due to CMA impairment. Both WT and KI MEFs expressing ‘KFERQ’-peptide were transfected with siRNA(s) to mediate knockdown of LAMP2A expression. After 72-h transfection of siRNA(s), total cellular LAMP2A levels as determined by western blots were significantly reduced in both WT (N = 4; p < 0.01) and KI cells (N = 4; p < 0.05), as compared to their corresponding control cells transfected with scrambled control siRNA (Figure 7(a)). After LAMP2A knockdown, the cells were photoactivated and their rates of substrate clearance were determined by percentage decline of fluorescence per hour in culture over 48 h by the same method as described above. LAMP2A knockdown in WT cells caused a significant decrease in the clearance rate of PAmCherry-KFERQ-NE [WT with LAMP2A knockdown: −1.065% per hour (t1/2: 44.7 h) vs. WT without LAMP2A knockdown: −1.3425% per hour (t1/2: 35.8 h)] (N = 4; p < 0.01). However, LAMP2A knockdown in LRRK2 KI cells did not cause significant difference in the substrate clearance rate [KI with LAMP2A knockdown: −0.858% per hour (t1/2: 52.9 h) vs. KI without LAMP2A knockdown: −0.815% per hour (t1/2: 59.5 h)], indicating that LAMP2A-mediated protein degradation was lacking in LRRK2 KI cells (Figure 7(b)).
Figure 7.
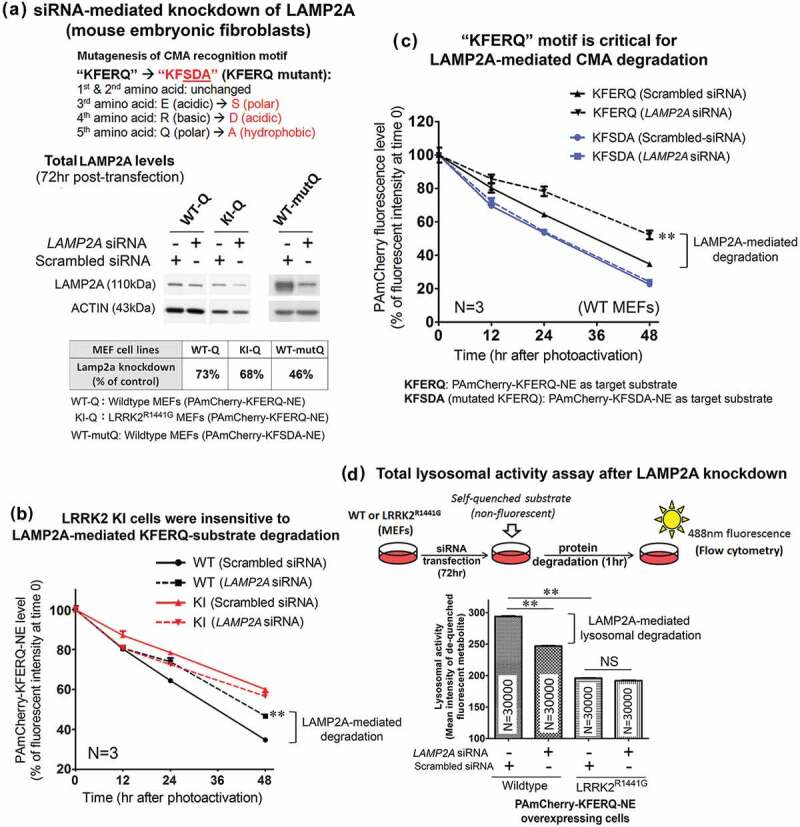
LAMP2A-specific CMA protein degradation was not observed in LRRK2R1441G KI mutant MEF(s). (a) Total cellular LAMP2A protein expression was knocked down by transfection of siRNA(s) for 72 h and confirmed by western blots. (b) The clearance rate of CMA-specific KFERQ substrate peptide was significantly decreased in WT MEFs after LAMP2A knockdown (N = 4; p < 0.01). However, similar decrease was not observed in KI MEFs after LAMP2A knockdown, indicating that CMA-specific protein degradation was impaired in LRRK2 mutant cells. (c) LAMP2A knockdown in WT MEFs caused a significant decrease in ‘KFERQ’ substrate clearance as compared with its corresponding control cells transfected with scrambled negative siRNA (N = 4; p < 0.01). Such LAMP2A knockdown-induced decrease was not observed when ‘KFERQ’ recognition motif was mutated (i.e. ‘KFSDA’). Data are expressed as mean ± S.E.M. Statistical significance was calculated by post-hoc multiple comparisons after two-way ANOVA at the level of **p < 0.01 as compared to its corresponding group transfected with scrambled siRNA (N = 3). (d) Total lysosomal activity was measured by an enzymatic assay kit based on degradation of a self-quenched lysosomal substrate followed by flow cytometry. Lysosomal activity in WT MEFs was significantly higher than in LRRK2R1441G KI mutant cells. LAMP2A knockdown significantly decreased total lysosomal activity in WT MEF(s), but not in LRRK2R1441G KI mutant cells. Data are expressed as mean ± S.E.M. Statistical significance was calculated by unpaired Student’s t-test at the level of **p < 0.01 between two comparing groups. ‘NS’ indicates no statistical significance between the two designated groups.
After having shown by co-immunoprecipitation that ‘KFERQ’ pentapeptide in the PAmCherry-KFERQ-NE substrate protein sequence is critical for recognition by CMA-specific degradation (Figure S5), we then determined whether mutation of ‘KFERQ’ to abolish the CMA recognition motif would affect the rate of clearance in WT MEFs expressing this mutant PAmCherry-KFSDA-NE substrate protein. After ‘KFERQ’ was mutated, LAMP2A knockdown did not affect the rate of substrate clearance (Figure 7(c)), indicating that LAMP2A was involved in ‘KFERQ’ substrate clearance.
To verify that lysosomal degradation of CMA substrate was impaired in LRRK2 KI MEF(s), we employed a second independent flow cytometry method to measure changes in total lysosomal degradation activity in WT and KI MEFs after LAMP2A knockdown. This assay is based on measurements of fluorescence emitted after degradation of a self-quenched lysosomal substrate in the cells followed by flow cytometry. We compared the total lysosomal activity between WT and KI cells under normal condition. We showed that LRRK2 KI MEFs exhibited significantly lower lysosomal activity than the WT cells. Defective lysosomal activity in KI MEFs was shown by comparing WT (column 1) and KI (column 3) cells under normal condition (↓33.3%; p < 0.01 by unpaired Student’s t-test) (Figure 7(d)). Since this observed decrease in total lysosomal activity in LRRK2 KI cells may not only be due to CMA impairment, we performed siRNA transfection to knockdown LAMP2A expression in order to assess the contribution of CMA-specific degradation relative to total lysosomal degradation. Knockdown of LAMP2A expression in WT cells caused a significant decrease (↓16.0%; p < 0.01 by unpaired t-test) in total lysosomal activity, indicating that such percentage decrease was contributed by LAMP2A-specific CMA. In contrast to WT cells, LAMP2A knockdown in LRRK2 KI cells did not have a significant effect on the overall lysosomal activity (Figure 7(d)).
To address whether the decrease in fluorescence of PAmCherry-KFERQ-NE was due to lysosomal degradation, we performed clearance assays on WT and KI MEFs treated with two lysosomal inhibitors, bafilomycin A1 or CQ (chloroquine). The relative contribution of lysosomal degradation in WT and KI cells was determined by decrease in percentage substrate clearance after lysosomal inhibition at 48 h after photoactivation (bafilomycin A1: N = 3; all p < 0.01; CQ: N = 4; all p < 0.01 by post-hoc comparisons after two-way ANOVA) (Figure 8(a,b)). In agreement with the lower lysosomal activity in KI cells as assayed above, we consistently observed a lower relative contribution of lysosomal degradation to overall protein degradation in KI than WT MEFs after independent treatment with two lysosomal inhibitors: bafilomycin A1-sensitive lysosomal degradation: WT (29%) vs KI (17%); CQ-sensitive lysosomal degradation: WT (41%) vs KI (29%) (Figure 8(a,b)). Furthermore, we also compared the contribution of macroautophagy on substrate clearance in WT and KI MEFs. There was no significant difference in the contribution of macroautophagy on ‘KFERQ’ substrate degradation between WT and KI MEFs after treatment with macroautophagy inhibitor, 3-MA (3-methyladenine) [3-MA-sensitive degradation: WT (24%) vs KI (22%); N = 4] (Figure S6).
Figure 8.
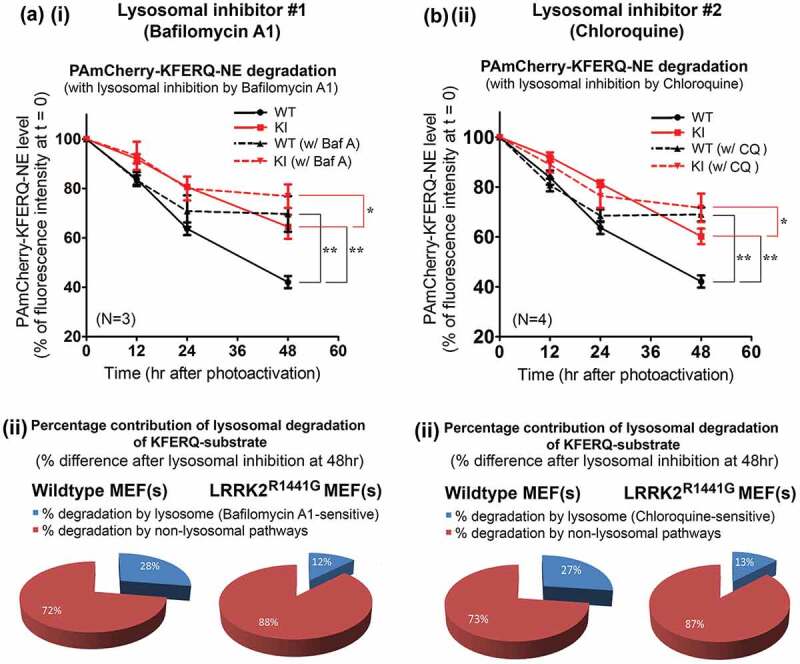
Lower relative contribution of lysosomal degradation of ‘KFERQ’-like substrate (as a percentage of total cellular protein clearance) in LRRK2R1441G KI MEFs. Representative flow cytometry intensity plots of photoactivated WT and KI MEFs collected at different time points after treated with either (a) (i and ii) bafilomycin A1 (100 nM) or (b) (i and ii) chloroquine (CQ; 20 μM) to determine specific reduction in overall clearance due to lysosomal inhibition. The time-dependent clearance of ‘KFERQ’-substrates in both WT and KI MEFs with and without lysosomal inhibition were determined as compared with their corresponding levels of PAmCherry at t = 0, expressed as a percentage. The relative contribution of lysosomal degradation in the overall substrate clearance was determined by the percentage difference between the inhibitor-treated and its corresponding untreated control cells at 48 h. Data are expressed as mean ± S.E.M. **p < 0.01 and *p < 0.05 represent statistical significance between two designated groups at 48 h by post-hoc multiple comparisons after two-way ANOVA.
Reduced lysosomal activity in LRRK2R1441G mutant mouse embryonic fibroblasts can be modulated by specific CMA activator
AR7 [7-Chloro-3-(4-methylphenyl)-2H-1,4-benzoxazine] is an atypical RARA/RARα (retinoic acid receptor, alpha) antagonist which was shown to specifically activate CMA activity [46]. We first verified its effect to induce CMA by treating both WT and KI MEFs stably expressing photoactivated PAmCherry-KFERQ-NE with AR7 (0.25 μM) in normal complete culture medium for 16 h (Figure 9(a)(i)). The PAmCherry-KFERQ-NE protein in both untreated WT and KI control cells as seen after photoactivation was expressed throughout the cytoplasm without obvious visible puncta formation. AR7 treatment for 16 h caused puncta formation in both WT and KI MEFs (Figure 9(a)(ii)). Formation of intracellular puncta carrying PAmCherry fluorescence indicates transport of substrate into lysosomes upon CMA activation. We observed similar puncta formation in parallel groups of cells following serum withdrawal (Figure 9(a)(ii)), which is well-known cellular event indicating CMA activation [47].
Figure 9.
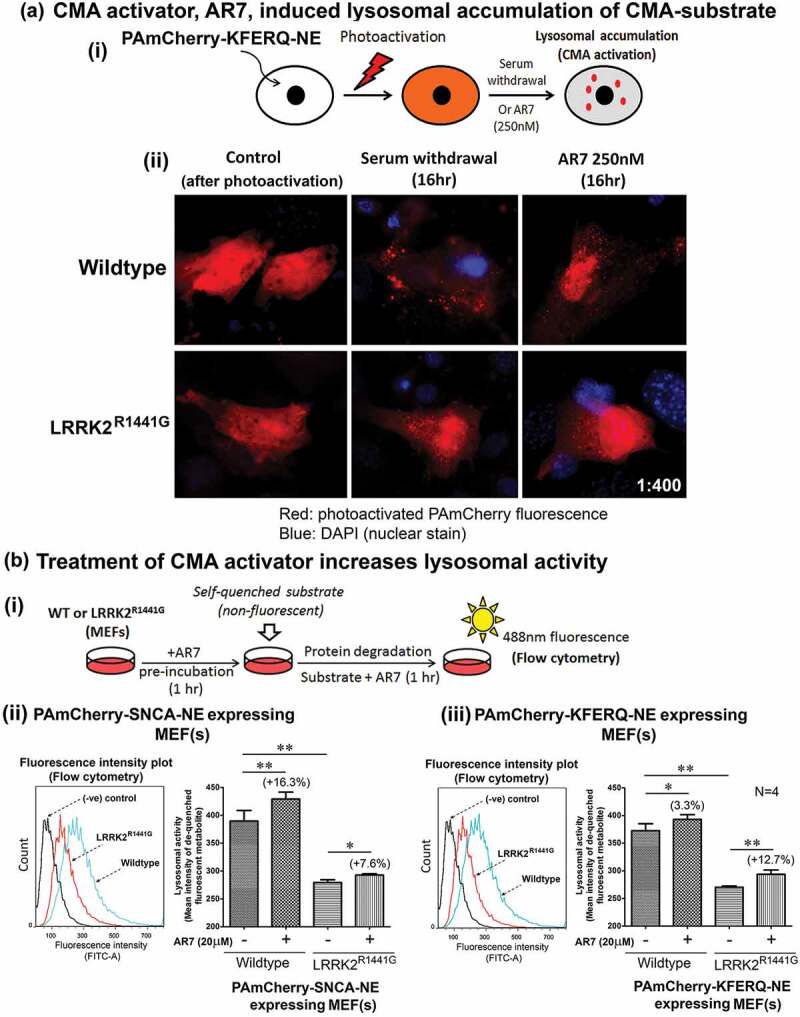
Treatment with RARA antagonist, AR7, increased lysosomal activity in WT and LRRK2R1441G KI mutant MEFs. (a) Treatment of CMA activator, AR7 (RARA antagonist) induced lysosomal accumulation (as visualized in form of puncta) of CMA substrate in MEFs. WT and KI MEFs stably expressing PAmCherry-KFERQ-NE were treated with AR7 for 16 h in complete culture medium. In parallel control groups, MEFs were cultured in serum-free medium (i.e. serum deprivation/starvation), which is known to induce CMA. Cells were photoactivated after treatment and observed under fluorescence microscopy for puncta (arrowheads) formation. (b) (i) Pre-incubation of CMA activator, AR7 (20 μM), significantly increased the total lysosomal activity in both WT and LRRK2R1441G KI mutant MEFs expressing either (ii) SNCA or (iii) KFERQ-peptide, as compared with their corresponding untreated groups (N = 4). LRRK2R1441G KI MEF(s) have lower overall lysosomal degradation activity as compared with that of WT controls. Data are expressed as mean ± S.E.M. Statistical significance at *p < 0.05 and **p < 0.01 between two designated groups by unpaired Student’s t-test.
As we found defective lysosomal activity in LRRK2 KI cells, we explored whether AR7 treatment could increase lysosomal activity (Figure 9(b)(i)). WT and KI MEF(s) expressing either PAmCherry-SNCA-NE (Figure 9(b)(ii)) or PAmCherry-KFERQ-NE (Figure 9(b)(iii)) were pre-incubated with AR7 (20 μM) for 1 h before the self-quenched lysosomal substrate was added into the culture medium. Fluorescence emitted by de-quenched substrate as a result of lysosomal degradation after AR7 treatment in both WT and KI MEFs was significantly higher than their corresponding untreated control cells (N = 4; all p < 0.05), indicating that AR7 treatment increased cellular lysosomal activity in both WT and KI cells (Figure 9(b)(ii) and (iii)).
Treatment with specific CMA activator attenuated intracellular and extracellular accumulation of SNCA oligomers in LRRK2R1441G KI primary neurons
We found that increased SNCA oligomer levels in aged LRRK2R1441G KI mouse brains were associated with abnormal lysosomal morphology and slower rate of cellular clearance of SNCA. We also found that lysosomal degradation of CMA substrate was impaired in LRRK2 KI cells. Therefore, we explored whether activation of CMA in prolonged culture of primary cortical neurons could prevent the buildup of SNCA oligomers. Matured primary cortical neurons (DIV9) from both WT and KI mice were treated with graded doses of AR7 (0, 10, 20 μM) twice over 21 days (i.e. at DIV9 and DIV14) under normal culture condition (Figure 10(a)). Cell morphology of both WT and KI cells over 21 days of culture were similar after AR7 treatment at 20 μM (Figure 10(a)(i)) without causing significant neuronal cell death as shown by LDH (lactate dehydrogenase) release assay (Figure S7). To determine the levels of SNCA oligomer in both WT and KI neurons at DIV9, 14 and 21, cells treated with AR7 were freshly sonicated in cold PBS with protease inhibitors to extract total soluble SNCA oligomers. The conditioned media at each corresponding time points were collected in parallel. Using our oligomer-specific ELISA, the levels of SNCA oligomer in both vehicle-treated WT and KI cultures increased gradually from DIV9 to DIV21 (WTDIV9: 0.084 ± 0.01 pg/μg total protein; WTDIV14: 0.1218 ± 0.01 pg/μg total protein; WTDIV21: 0.1578 ± 0.02 pg/μg total protein; KIDIV9: 0.1818 ± 0.04 pg/μg total protein; KIDIV14: 0.2185 ± 0.05 pg/μg total protein; KIDIV21: 0.2698 ± 0.09 pg/μg total protein) (Figure 10(a)(ii)). Similar increases in SNCA oligomer were observed in their corresponding extracellular conditioned media (N = 3; all p < 0.05) (Figure 10(a)(iii)). Furthermore, the intracellular oligomer levels in KI neurons were significantly higher than those in WT at all three time points from DIV9 to DIV21 by 216%, 179%, and 171%, respectively (N = 5; all p < 0.05; post-hoc multiple comparison after two-way ANOVA) (Figure 10(a)(ii)). These results in cultured primary neurons were consistent with increased SNCA oligomer levels found in our aged mutant LRRK2 mouse striatum (Figures 1(a) and 2).
Figure 10.

Treatment of CMA activator AR7 dose-dependently reduced intracellular and extracellular SNCA oligomer levels in LRRK2R1441G KI mutant primary cortical neurons. (a) (i) Primary cortical neurons (DIV9) from WT and LRRK2R1441G KI mutant mice were cultured with or without AR7 at 0, 10, or 20 μM. (i) Treatment of AR7 in primary cortical neurons from DIV9 to DIV21 did not cause severe cell morphological changes, and cytotoxicity (Figure S7). (ii-iii) Total cell lysates and the corresponding conditioned media were collected at different time points (DIV9, 14, and 21) to measure the levels of SNCA oligomer by ELISA. LRRK2R1441G KI primary neurons have significantly higher level of SNCA oligomers than WT neurons at all time points. Treatment of AR7 significantly prevented accumulation of both intracellular and extracellular SNCA oligomers in LRRK2R1441G KI primary neurons. Data are expressed as mean ± S.E.M. Statistical significance is shown by post-hoc multiple comparison following two-way ANOVA at the level of *p < 0.05 and **p < 0.01, as compared to WT controls at its corresponding time points; and #p < 0.05 and ##p < 0.01 as compared to untreated KI controls at its corresponding time point. (b) (i) Total cellular levels of SNCA, LAMP2A and HSPA8 at different time points (DIV9, 14, and 21) were determined by western blots. There was no significant difference in the levels of (ii) total SNCA between WT and KI neurons. Treatment of AR7 significantly reduced total intracellular SNCA in both WT and LRRK2R1441G KI neurons, as compared to their corresponding vehicle-treated control groups (N = 4). AR7 treatment in 24 h dose-dependently induced (iii) Lamp2a mRNA expression in both WT and KI cells (N = 3). However, no significant change in levels of total cellular (iv) LAMP2A and (v) HSPA8 protein was observed in both WT and KI cultures with AR7 treatment at DIV21. Statistical significance is shown at the level of *p < 0.05 and **p < 0.01, as compared to their corresponding vehicle-treated control groups by post-hoc multiple comparison following two-way ANOVA.
To investigate if CMA activation could reduce accumulation of SNCA oligomers in KI neurons, we treated both WT and KI neurons twice with two different doses (10 and 20 μM in 0.01% DMSO) of AR7 and measured their corresponding changes in SNCA oligomer levels over 21 days in culture. AR7 was added into the culture medium at both DIV9 and DIV14 to ensure that sufficient amounts of active AR7 remained in the medium over the entire period of treatment. In KI primary neurons, AR7 treatment significantly reduced intra- and extracellular SNCA oligomer levels in a dose-dependent manner. In particular, at DIV21, the amount of intracellular oligomers in KI neurons treated with AR7 (at 20 μM) were markedly reduced by 44% compared to vehicle-treated KI (N = 5; p < 0.05) to levels that were comparable to those in vehicle-treated WT at DIV21 (Figure 10(a)(ii)). Similar reduction of oligomer levels were observed in extracellular conditioned media of KI cultures, where the amount of extracellular SNCA oligomers in AR7-treated (20 μM) KI neurons approached those observed in vehicle-treated WT culture media (N = 3; p < 0.05) (Figure 10(a)(iii)). These findings demonstrated that prolonged culture with AR7 can significantly attenuate intra- and extracellular accumulation of SNCA oligomers in LRRK2 KI neurons. In contrast to KI neurons, we observed a different response to AR7 treatment in WT neurons. As compared with the vehicle-treated WT neurons, AR7 treatments did not cause significant reduction in the intracellular levels of SNCA oligomer (Figure 10(a)(ii)). In particular, WT cells treated with AR7 at higher dose of 20 μM showed an unexpected increase in levels of SNCA oligomer compared with vehicle-treated control neurons at DIV21 (N = 7; p < 0.01; Mann-Whitney non-parametric analysis and unpaired Student’s t test).
We also measured the corresponding change in the levels of total SNCA and two CMA-specific proteins, LAMP2A and HSPA8, in these AR7 treated cultures by western blots. In both WT and KI vehicle-treated neurons, total intracellular SNCA levels gradually increased from DIV9 to DIV21, although there was no significant difference between WT and KI cells over 21 days of cultures (Figure 10(b)(ii)). Initial dose of 20 μM AR7 administered on DIV9 did not affect the total SNCA levels in both WT and KI cultures as measured on DIV14. However, after second dose of AR7 given at DIV14, we observed a significant decrease in the total SNCA levels compared with the levels in their corresponding vehicle-treated control groups at DIV21 in both WT (N = 4; p < 0.01) and KI (N = 4; p < 0.05) cultures. Although AR7 treatment (10, 20 μM) in both WT and KI cells for 24 h dose-dependently induced Lamp2a mRNA expression (N = 3) (Figure 10(b)(iii)), we did not observe sustained elevation of cellular LAMP2A and HSPA8 protein levels after prolonged culture of both WT and KI cultures with AR7 treatment at DIV21, as compared to their corresponding vehicle-treated control groups (Figure 10(b)).
Discussion
The results of this study on LRRK2R1441G KI mice allowed us to present several strands of evidence concerning the mechanism of synucleinopathy in PD. These highlight the role of CMA in this pathological process. We have shown that with age SNCA oligomers accumulated in greater quantities in brains of mutant LRRK2R1441G KI mice compared with levels in age-matched WT control mice. We also demonstrated a greater accumulation of SNCA oligomers in prolonged culture of primary cortical neurons from LRRK2R1441G KI mice compared with that in WT neurons. Treatment of these KI neurons with a specific CMA activator induced Lamp2a gene transcription and attenuated accumulation of both intracellular and extracellular SNCA oligomers. In particular, we have shown that CMA was perturbed in aged LRRK2R1441G mutant mice. We demonstrated dysfunction in overall intracellular protein clearance in LRRK2 KI cells. We used MEFs derived from WT and KI mice to measure the overall intracellular clearance of SNCA conjugated with a photoactivated fluorescent reporter protein. In parallel, we measured clearance of ‘KFERQ’-like peptide (protein segment of mouse RNase A) which consists of the consensus recognition motif for CMA degradation as a reference substrate protein for comparison with SNCA. The overall cellular clearance of both SNCA and ‘KFERQ’-like conjugate in LRRK2 KI mutant cells were significantly lower as compared with the clearance in WT cells. This was associated with lower contribution of lysosomal degradation in LRRK2 KI cells as compared with that in WT cells. Although both SNCA and ‘KFERQ’-containing protein are known CMA substrates, these may well be degraded by multiple degradation pathways. Therefore, we determined whether defective protein clearance in LRRK2 KI cells was associated with lysosomal dysfunction. An enzymatic assay based on degradation of a lysosome-specific substrate showed that LRRK2 KI cells have significantly lower total lysosomal activity. We also found abnormal lysosome clustering in both KI MEFs and aged mouse striatum, suggesting defective lysosomal protein degradation. Furthermore, we determined how defective protein clearance in KI cells correlated with CMA. The lack of response in LRRK2 KI cells after Lamp2a knockdown suggested pre-existing CMA impairment in LRRK2 KI cells.
Previously we have demonstrated the relevance and use of our LRRK2R1441G KI mouse as an animal model of PD [30,31,48]. Unlike most human carriers of LRRK2 mutations, who are heterozygous, we used KI mice carrying a homozygous mutation to accentuate the genetic risk. The advantage of this model is that the KI mutation is integrated into a known locus in the mouse genome, and the variant LRRK2 protein is expressed at normal physiological levels (developmentally and anatomically) under the control of its native promoter. This model more closely mimics the situation in human PD patients carrying LRRK2 mutations [30–33] in contrast to the knockout (with no LRRK2 expression) and transgenic models (with abnormally high LRRK2 expression) in which their conditions are not found in LRRK2-associated PD patients.. Although these KI mice have no overt parkinsonian phenotype, they have impaired neurotransmission following stimulated dopamine release [33] and increased vulnerability to reserpine-induced striatal dopamine depletion, resulting in presynaptic dysfunction and locomotor deficits with impaired recovery [30]. More recently, we also showed that these KI mice have significantly reduced NDUFS4 (component of mitochondrial Complex-I) and are more susceptible to locomotor deficits after chronic (over half of the mice’s lifespan) exposure to sub-lethal oral doses of the mitochondrial toxin rotenone (organic pesticide used in experimental toxic model of PD) [31]. These subtle nigrostriatal synaptic vulnerabilities observed in our KI mice recapitulate some of the earliest pathogenic features of PD. Thus, our LRRK2 KI mouse represents a useful model to explore age-dependent pathogenic events and potential therapies.
SNCA exists in a dynamic equilibrium among different conformations and oligomers [10]. Although endogenous SNCA predominantly exists as unfolded monomers in the central nervous system [49], destabilization of the protein as a result of post-translational modifications such as oxidation and phosphorylation is thought to potentiate protein misfolding and formation of toxic prefibrillar oligomeric SNCA [50]. A growing body of evidence suggests that these soluble oligomeric species, rather than the insoluble fibrils in the Lewy bodies, are responsible for neurotoxicity [9,11,51]. SNCA is capable of forming native membrane-associated oligomers to permeabilize lipid bilayers of cell membranes causing calcium influx and apoptosis [52,53]. Furthermore, these oligomers have been shown to impair protein degradation [54] and cause dysfunction of mitochondria and endoplasmic reticulum [55–57]. These effects are detrimental to cellular structure and function, and contribute to neuronal cell death in PD.
Previously we have shown that there was no difference in total levels of SNCA in the striata of our LRRK2R1441G KI mice compared with WT littermates [30]. Similarly, this lack of difference has also been observed in another LRRK2 knockin mouse model with the G2019S mutation [32,58]. In this study we found that levels of SNCA oligomers in striata of our aged KI mice were significantly higher and the doubling times were predicted to be considerably shorter than those in WT animals. From these results, it is clear that total cellular SNCA levels do not accurately track underlying pathological changes in PD. It is technically challenging to quantify oligomeric species of SNCA without being confounded by its monomeric form. We used a conformation antibody ‘A11’ in the initial step of ELISA to capture total amyloid-like oligomers [38] (including SNCA oligomers) instead of direct detection of SNCA oligomer by another specific antibody called ‘Syn33’ [59], because ‘A11’ antibody can detect a wider spectrum of amyloid-like oligomers. In the second phase of the assay SNCA oligomers were specifically detected by the use of a polyclonal antibody against total SNCA. This sandwich-ELISA minimizes the detection of monomeric SNCA, and more accurately quantifies the accumulation of oligomers, thus allowing better tracking of pathophysiological changes and therapeutic efficacy of any new agents to be tested.
Using this SNCA oligomer-specific ELISA, we found a significantly greater age-dependent increase in SNCA oligomer levels in both the striatum and cortex of aged KI compared with WT mice. In addition to ELISA measurements, immunohistochemistry of dorsal striatum from aged KI mice using specific antibody against SNCA oligomer (‘Syn33’) [59] also revealed significantly more accumulation of these oligomers as compared with their occurrence in age-matched WT mice. These findings indicate that LRRK2R1441G mutation together with aging potentiated SNCA oligomer accumulation in the brain. Our results are consistent with findings that oligomeric SNCA is elevated in human brain homogenates from PD and Lewy body disease compared with normal controls [19,60]. Although there are reports of increased CSF oligomeric SNCA levels in pre-symptomatic human mutant LRRK2 carriers [61–63], we did not detect any differences in the levels of amyloid-like oligomers in CSF of either young or aged KI mice compared to age-matched WT, despite our careful attempts to exclude confounding factors such as contamination of CSF samples by presence of hemoglobin which contain large stores of SNCA. The reasons for such a discrepancy with humans are unclear. The levels of SNCA oligomers in the striata of young 3-month-old WT and KI mice were similar, indicating that aging is a crucial factor which drives a time-dependent buildup of oligomers in LRRK2 KI mouse brains. Nevertheless, quite how age influences the brain is a topic of considerable debate. Numerous hypotheses have been proposed including oxidative stress, mitochondrial dysfunction and excitotoxicity. These processes may affect SNCA equilibrium independently or in combination with aging in PD.
We detected an age-dependent accumulation of SNCA oligomers in the brain of aged LRRK2 KI mice, and as a consequence we explored whether such accumulation was due to impaired lysosomal degradation of the protein. Abnormal clustering of lysosomes was observed in LRRK2 KI mouse striatum as well as in the mutant MEF(s) derived from these mice. Clustering of lysosomes at the cellular perinuclear region is a well-described cell response implicating impaired aberrant protein degradation [40]. Lysosomal dysfunction is shown not only to underlie various lysosome storage disorders but also to be present in PD [64]. Our observation suggested that LRRK2R1441G mutation may affect normal lysosomal trafficking and function in the brain. In our substrate clearance assays on WT and KI MEFs treated with lysosomal inhibitors, we compared the relative contribution of lysosomal degradation in these cells. Our results consistently showed a lower relative contribution of substrate degradation by lysosomes (as a percentage of total protein degradation) in KI by an approximate 14–16% as compared to WT. Our findings are in agreement with other reports which showed that altered GTPase activity of mutant LRRK2 affects lysosomal trafficking [65], and similar perinuclear lysosome clustering in a mutant (LRRK2G2019S) homology to human LRRK2 in Drosophila [66].
CMA is a subtype of the lysosome-autophagy pathway which degrades and recycles selective cytosolic protein substrates under cellular stress [67]. The process starts from initial substrate recognition by cytosolic HSPA8, binding and unfolding via LAMP2A on the lysosomal membrane, substrate translocation, disassembly of the translocation complex, and finally substrate degradation inside the lysosomes [17,24,25]. Collective evidence shows that substrate binding to LAMP2A represents the rate-limiting step of CMA activity, and changes in the abundance of active LAMP2A and distribution of CMA-active lysosomes can affect CMA activity [42]. LRRK2 mutations have been shown to inhibit CMA activity [35]. Therefore, it has been hypothesized that LAMP2A level would be reduced proportionally to the degree of impairment of CMA activity in LRRK2 mutant cells. However, to our surprise, we found that membrane-bound LAMP2A and HSPA8 levels in the striatum were higher in the aged LRRK2 KI mice as compared to the age-matched WT. We verified such findings by quantifying cellular LAMP2A levels in dissociated ventral midbrain cell suspension from these aged KI mice using flow cytometry, which also showed higher levels of total cellular LAMP2A. Moreover, visualization of LAMP2A-positive lysosomes by confocal imaging in aged KI mice striatum also showed significantly larger puncta stains than those observed in aged-matched WT mice, indicating abnormal accumulation of LAMP2A on the lysosomes. Similar observations were made in a previous study which showed that cells expressing mutated LRRK2 exhibited twice the amount of LAMP2A than in normal cells, and yet they demonstrated decreased CMA activity despite the increased LAMP2A levels [35]. In our aged KI mice, we also found a higher level of GAPDH (a recognized CMA substrate [16,20]) than that in WT mice, which supports our findings that CMA was impaired in the aged KI mice. In contrast, there was no difference in the levels of soluble LAMP2A and HSPA8 in the cytosol, suggesting that LRRK2 mutation only affects these proteins on the lysosomal membrane, whereas supply of free unbound LAMP2A and substrate recognition by HSPA8 in the cytosol are unlikely to be affected. To explore how CMA was affected by these changes, we determined the rate of cellular clearance of CMA substrates and lysosomal activity in these LRRK2 mutant cells.
Assaying protein degradation activity by CMA in vivo is difficult because CMA activity is constantly affected by other degradation pathways such as the ubiquitin-proteasome system and macroautophagy [68]. Administration of a specific antagonist to one pathway may potentially affect the others through cellular compensatory mechanisms. For example, prolonged blockage of macroautophagy leads to upregulation of CMA [69]. Assessment of CMA activity typically relies on measuring proteolysis of exogenously supplied radiolabeled CMA substrates, e.g. GAPDH, into freshly purified lysosomes in vitro. However, variations in the integrity and purity of isolated lysosomes can confound the measurement of CMA activity. Furthermore, previous reports have shown that mutated LRRK2 protein inhibited CMA activity by binding abnormally with LAMP2A on the surface of lysosomes [35]. This binding may be inadvertently abolished during the stringent washing steps involved in lysosome isolation and purification. As a result, the effect of LRRK2 mutation on CMA activity may not be accurately reflected. To address these concerns, we developed an alternative assay to measure protein clearance in live cells engineered to express target substrate proteins (e.g. SNCA) conjugated with a photoactivatable fluorescent reporter protein (i.e. PAmCherry) which are readily degraded by CMA [70].
In order to determine the rate of degradation of SNCA in LRRK2 KI cells, we developed a stable MEFs culture engineered to express a photoactivatable PAmCherry protein conjugated with full length SNCA and a novel synthetic epitope tag called ‘NE’ for detection and quantification [43–45]. The photoactivatable PAmCherry-SNCA-NE protein does not emit fluorescence until activated by UV-A. Thus, the decline in fluorescence levels after photoactivation can be monitored and quantified at different time points using flow cytometry. Although SNCA contains a ‘KFERQ’-like pentapeptide (i.e. ‘VKKDQ’) for CMA-specific degradation, it is possible that this protein may be degraded via alternative non-CMA pathways [71]. Therefore, we developed another expression construct encoding for a reference substrate protein which includes the consensus CMA-specific recognition motif (i.e. ‘KFERQ’) as parallel comparison with SNCA for CMA degradation. This cell-based assay has the advantage of being easily modifiable to study degradation of any other target proteins of interest. We found that MEFs derived from our LRRK2 KI mice degraded both SNCA and the ‘KFERQ’-like peptide at significantly lower rates compared to MEFs from WT. Similar clearance assays on WT and LRRK2 KI MEFs expressing a non-CMA substrate, PAmCherry-KFSDA-NE (‘KFERQ’ mutated to ”KFSDA”), showed similar rate of substrate clearance (Figure 6(c)). These findings demonstrated the involvement of CMA in the overall clearance of both PAmCherry-KFERQ-NE (Figure 6(b)) and SNCA (Figure 6(a)), and that CMA dysfunction contributed to slower degradation of PAmCherry-KFERQ-NE and SNCA in KI cells. Immunoprecipitation results showed that PAmCherry-KFERQ-NE protein was co-immunoprecipitated with HSPA8, indicating that specific CMA substrate recognition by HSPA8. Conversely, such binding with HSPA8 was not observed in cells expressing a non-CMA substrate, PAmCherry-KFSDA-NE, where the CMA recognition motif was mutated. These results confirmed that PAmCherry-KFERQ-NE is a valid CMA reference substrate in which ‘KFERQ’ pentapeptide in the protein sequence is critical for the recognition by HSPA8 in CMA-specific degradation.
Cells with the LRRK2 mutation have lower rate of CMA substrate degradation and that levels of LAMP2A do not necessarily reflect CMA activity in cells with the mutation. We verified our findings by comparing the lysosomal activities between WT and KI MEFs based on degradation of a self-quenched lysosomal substrate into cultures. Consistent with our PAmCherry clearance assay results, LRRK2 KI MEFs showed significantly lower lysosomal activity as compared with WT cells. Knockdown of LAMP2A expression in WT MEFs resulted in significant 16% and 20% reduction in the overall clearance rate as determined in both PAmCherry clearance and lysosomal activity assays, respectively. Unlike the WT cells, reduction in substrate clearance in LRRK2 KI cells after LAMP2A knockdown was not observed, suggesting pre-existing CMA impairment in the KI cells. This difference after LAMP2A knockdown in WT cells appeared to be similar to the level of difference in the lysosomal degradation between WT and KI cells (i.e. 14–16% in Figure 8(a,b)), suggesting that lysosomal dysfunction in LRRK2 KI cells was partly due to CMA impairment. Although the relative amount of about 16% that CMA contributes to overall protein degradation appears small, it is significant considering the remaining 84% non-CMA contribution comes from other protein degradation pathways not covered in this study. Furthermore, in humans, a relatively small but significant impairment in a specific protein degradation pathway such as CMA will have a large cumulative adverse impact on the buildup of toxic misfolded SNCA. PD is known to have a long pre-symptomatic and clinical phases stretching over many years in which the insidious accumulation of misfolded SNCA occurs. Recent evidence suggests that mutant forms of LRRK2, including both LRRK2G2019S and LRRK2R1441G, bind abnormally to lysosomal LAMP2A with higher affinity than native LRRK2 and cause accumulation of high-molecular-weight LAMP2A-containing multimeric complexes. It was suggested that this could hinder substrate unfolding and translocation, prevent disassembly and degradation of the substrate translocation complex, and this ultimately adversely affects the degradation of LRRK2 and other CMA substrates [34,35]. In summary, our results demonstrate a much faster oligomer accumulation in our aged LRRK2 KI mouse brains and a much longer half-life of SNCA as measured by PAmCherry-SNCA-NE clearance assay in the mutant MEFs. We also demonstrate that knocking down the level of LAMP2A by siRNA(s) causes a reduction in the rate of SNCA clearance only in WT MEFs. Thus, CMA makes a significant contribution to SNCA degradation in WT MEFs, but not in LRRK2 KI MEFs because of pre-existing impairment in CMA in the latter. We believe that a similarly reduction of CMA activity in human PD patients with LRRK2 mutation is a major contributor to the buildup of SNCA oligomers in their brains.
The therapeutic options to modulate CMA are very limited. Prolonged starvation has been one of the most common stimuli to activate CMA [47]. Recent reports have shown that disruption of RARA signaling has a stimulatory effect on CMA, but can lead to concomitant inhibition of macroautophagy [46,72]. Cuervo and Gavathiotis et al. developed various RARA antagonists; one in particular, AR7, enhanced CMA activity without affecting macroautophagy [46]. We verified the effects of AR7 on CMA activation using WT and KI MEFs expressing photoactivated PAmCherry-KFERQ-NE, and showed the formation of intracellular puncta carrying PAmCherry fluorescence which was also observed in parallel groups of cells after serum withdrawal, a known activator of CMA. When the lysosomal activity of these cells was measured after treatment with AR7 and we found that incubation with AR7 for only two hours was sufficient to cause a significant increase in lysosomal activity, indicating that AR7 can stimulate protein degradation in both mutant and WT cells.
Long-term culture of mouse primary neurons is useful to explore cellular mechanisms of aging and to test the efficacy of various therapeutic agents [73]. Previous studies have shown that mouse primary cortical neuron cultures remain stable and healthy for at least 60 days in vitro [74]. Since we found that the SNCA oligomer levels in KI primary neurons gradually increased over prolonged culture over 21 days in vitro and remained significantly higher than the levels in WT cultures, we determined whether treatment with CMA activator AR7 could be beneficial to reduce the formation of SNCA oligomers during prolonged culture. AR7 has been shown to activate CMA in normal mouse fibroblasts by increasing the availability of LAMP2A on the lysosomes [46]. Firstly, we addressed the effects of AR7 on CMA activation in our primary neuronal cell model. We showed that AR7 had an effect on CMA as we observed an immediate increase in Lamp2a mRNA level upon addition of AR7 to cell cultures at 24 hours. However, we did not find significant difference in total cellular LAMP2A protein levels in both WT and KI AR7-treated neurons after 21 days of prolonged culture compared with their vehicle-treated neurons. It is possible that increased LAMP2A transcription induced by AR7 was offset by increased lysosomal degradation of LAMP2A along with its CMA substrates (including SNCA), resulting in no observable net increase in LAMP2A protein levels in AR7-treated cells at DIV21.
AR7 was administered into cell cultures at two time points: DIV9 and DIV14. The beneficial effect of AR7 to attenuate oligomer accumulation was observed in KI neurons at DIV14, with an even greater reduction observed at DIV21 after an additional dose of AR7 given at DIV14. Both neuronal lysates and extracellular conditioned media showed a dose-dependent reduction of SNCA oligomer levels down to levels seen in vehicle-treated WT at the corresponding time points. However, unlike KI neurons, WT cells treated with the lower dose of 10 μM AR7 did not show any changes in the levels of total intracellular SNCA oligomers. Treatment at higher dose of 20 μM even showed an unexpected increase in oligomer levels compared with their corresponding vehicle-treated neurons at DIV21. The reason for such increase in oligomeric levels in AR7-treated WT cells is unclear. It may be due to yet unknown effects of AR7 on RARA/RARα signaling in normal neurons, although we did not see significant cell death in WT cultures after 21 days of AR7 treatment. A previous study showed that activation of RARA by specific agonists can induce proteasome-dependent protein degradation in monkey kidney cells [75]. It is possible that AR7, being a RARA antagonist [46], may perturb the physiological cellular protein degradation processes in normal WT cells. The reduction in oligomeric SNCA by AR7 is paralleled by a significant reduction of total intracellular SNCA in both WT and KI neurons at DIV21 after two doses of AR7. Such a reduction would benefit the cells by minimizing the tendency for the protein to aggregate into toxic oligomers. The efficacy of AR7 in reducing SNCA oligomer accumulation in LRRK2 KI primary neurons indicates its ability to overcome the inhibitory effects of mutated LRRK2 on CMA-mediated SNCA clearance.
In conclusion, we report findings in our mutant LRRK2R1441G KI mouse model of Parkinson disease that the pathogenic mutation together with aging resulted in age-dependent accumulation of SNCA oligomers in both striatum and cortex. Such accumulation was associated with abnormal perinuclear clustering of lysosomes, and abnormal accumulation of CMA-specific LAMP2A and HSPA8 together with a recognized CMA substrate, GAPDH, in mutant brains. Using a photoactivatable fluorescence-based cellular substrate clearance assay and a total intracellular lysosomal activity assay, we found impaired cellular clearance of SNCA as well as a consensus CMA substrate peptide – ‘KFERQ’ in LRRK2 KI cells, suggesting that accumulation of SNCA oligomers in aged mutant brains was in part due to impaired CMA protein clearance. Current available therapies of PD are neither curative nor protective, and are associated with side-effects and loss of efficacy over time. New passive immunotherapies based on antibody-mediated clearance of pre-existing SNCA aggregates have shown some promise in various experimental PD models. However, these treatment methods have their own challenges including antibody specificity and induction of inflammatory autoimmunity [76–78]. SNCA is degraded via multiple pathways. However, when SNCA aggregates to form higher molecular weight species, lysosomes play a more dominant role than proteasomes in their degradation [79]. Because SNCA accumulation is a slow process in human PD, there exists a long window of opportunity to enhance protein clearance in neurons and hence reduce the likelihood of toxic protein aggregation and propagation. CMA activation to prevent the buildup of SNCA oligomers in neurons with age may be a viable therapeutic strategy in PD.
Materials and methods
Animals
A C57BL/6 mouse colony with complete homozygous knockin of pathogenic LRRK2R1441G KI mutation (‘R1441G’ mutation in the ROC GTPase domain of LRRK2) has been described previously [30,31]. These mutant mice were back-crossed with wildtype C57BL/6 for eight generations, and maintained under pure C57BL/6N mouse background. All mice were housed in the Laboratory Animal Unit, University of Hong Kong which has accreditation through the Association for Assessment and Accreditation of Laboratory Animal Care International (AAALAC), under standard conditions (12-h light/dark cycle) with unrestricted access to food and water. The procedure of experimental use of animals was approved by the Institutional Animal Care and Use Committee.
Generation and culture of mouse embryonic fibroblasts (MEFs)
Littermate matched WT and homozygous LRRK2R1441G KI mouse embryonic fibroblasts (MEFs) were isolated from mouse embryos at day E12.5 resulting from crosses between heterozygous LRRK2R1441G/WT mice based on our previously described protocol [48]. All MEFs were cultured in Dulbecco’s Modified Eagle Medium (DMEM; ThermoFisher™ Scientific, 10569-010) containing 10% FBS (GE Healthcare HyClone™, SH30071.03), 100 units/ml penicillin, 100 μg/mL streptomycin (ThermoFisher™ Scientific, 15140-122), non-essential amino acids (ThermoFisher™ Scientific, 11140-050). The genotype of individual MEF clones was confirmed by Sanger sequencing.
Preparation of mouse primary cortical neurons and treatments
Mouse cortical neuron culture isolated from either WT or LRRK2R1441G KI mutant mice was prepared based on previous protocol [80]. Briefly, whole brain from E15 mouse embryos was transferred into cold Hanks Balanced Salt Solution (HBSS; ThermoFisher™ Scientific, 14025-076) with glucose. The frontal and occipital parts of the cortex were removed to unroll the hemisphere. Blocks of neocortex, obtained after eliminating hippocampus and white matter, were maintained in HBSS supplemented with glucose and dissociated using Papain Dissociation System (Worthington Biochemical Corporation, LK003150) at 37°C. After dissociation, the cell suspension was filtered through a nylon mesh (70 microns). Cells were seeded on poly-L-lysine (Sigma Aldrich™, P4832) coated dishes. Isolated neuronal cells were cultured in Neurobasal medium (ThermoFisher™ Scientific, 21103049) with 2% B-27 supplement (ThermoFisher™ Scientific; 17504044) and 1% Glutamax-I (ThermoFisher™ Scientific; 35050-061). To investigate whether treatment with AR7 [7-Chloro-3-(4-methylphenyl)-2H-1,4-benzoxazine; Sigma Aldrich™, SML0921] can modulate SNCA oligomer levels, Matured primary cortical neurons (DIV9) were cultured under normal culture conditions with or without AR7 (0, 10, 20 μM) for up to 21 days in culture (DIV21). AR7 dissolved in cell-culture grade DMSO (Sigma Aldrich™, D2650) was added into the culture medium on DIV9 and DIV14 at designated concentrations. The conditioned medium and the total cell lysates were extracted on DIV9, 14, and 21 for western blots and SNCA oligomer ELISA analyses.
Cloning of lentiviral expression constructs
To develop WT and LRRK2R1441G KI mutant MEFs to stably express photoactivatable PAmCherry-SNCA-NE or PAmCherry-KFERQ-NE using lentivirus, PAmCherry1 gene was amplified by PCR from pPAmCherry1-N1 plasmid, a gift from Vladislav Verkhusha (Addgene™ plasmid, 31928) [70], as template to generate an insert including EcoRI at the 5ʹ end and NheI-PmeI at the 3ʹ-end. This cDNA insert of PAmCherry1 was then sub-cloned into a lentiviral backbone plasmid pSIN4-EF2-IRES-Pur derived from a gift from James Thomson (Addgene™ plasmid, 16580) [81] to construct pSIN4-PAmCherry plasmid. The oligonucleotides sequences are as followed: Forward: 5ʹ- GGAATTCGCCACCATGGTGAGCAAG-3ʹ; and Reverse: 5ʹ-AGCTTTGTTTAAACTTAGCTAGCCTTGTACAGCTCGTCCATGCCG-3ʹ. The pSIN4-PAmCherry-SNCA-NE plasmid was constructed by inserting the cDNA fragment of mouse conjugated with a protein tag ‘NE’ into the NheI and PmeI sites of pSIN4-PAmCherry-SNCA plasmid using the following oligonucleotides. ‘NE’ is a novel 18-amino-acid epitope tag we developed to facilitate specific protein detection by a monoclonal NE antibody [44–46] (Versitech Ltd. Hong Kong; http://www.versitech.hku.hk/reagents/ne/). Forward: 5ʹ-CTAGCTAGCGATGTGTTCATGAAAGGACT-3ʹ and Reverse: 5ʹ-CGCCGTTTAAACTTAGCTTTCGTTATCATCATAGC-3ʹ. For pSIN4-PAmCherry-KFERQ-NE plasmid, the encoding sequence of a 20-amino acid segment of mouse RNase A protein containing ‘KFERQ’-like pentapeptide (KESRAKKFQRQHMDSDSSPS) was conjugated with NE tag, and was inserted into the NheI and PmeI sites of pSIN4-PAmCherry plasmid using the following oligonucleotides: Forward: 5ʹ- CTAGCTAGCAAGGAATCCCGGGCCAAGAAAT-3ʹ and Reverse: 5ʹ- CGCCGTTTAAACTTAGCTTTCGTTATCATCATAGC-3ʹ. To generate lentivirus expressing either PAmCherry-SNCA-NE or PAmCherry-KFERQ-NE, corresponding plasmids were co-transfected with helper plasmids in 293T cells using Lipofectamine3000™ (ThermoFisher™ Scientific, L3000-015) for 3 days. Virus-containing media were collected and filtered before transduction of either WT or LRRK2R1441G KI MEFs to induce expression of target proteins. Cells after photoactivation were observed under fluorescent microscope to determine transduction efficiency.
Mutagenesis of CMA recognition motif in ‘KFERQ’-like substrate conjugates
To demonstrate the involvement of CMA recognition motif (i.e. ‘KFERQ’-like pentapeptide) as a reference substrate used in the cellular protein clearance assay, mutagenesis of the CMA recognition motif in PAmCherry-KFERQ-NE was performed by GeneChem (Shanghai, China), based on altering the physical properties of amino acids in the targeting motif as referenced from Orenstein & Cuervo [82]. Briefly, the CMA recognition motif (5ʹ-AAATTCCAgCggCAg-3) was mutated to 5ʹ-AAATTCAgCgATgCT-3”, and sub-cloned into pSIN4-PAmCherry plasmid. The resultant changes in individual amino acid were listed as the following: ‘KFERQ’ → ‘KFSDA’ (‘KFERQ’ mutant): 1st & 2nd amino acid: unchanged; 3rd amino acid: E (acidic) → S (polar); 4th amino acid: R (basic) → D (acidic); 5th amino acid: Q (polar) → A (hydrophobic). Resultant plasmid was co-transfected with helper plasmids in 293T cells to generate lentivirus. Virus-containing media were collected and filtered before transduction of either WT or LRRK2R1441G KI MEFs to induce expression of PAmCherry-KFSDA-NE protein.
Mouse brain cell fractionation and western blotting
WT and LRRK2R1441G KI mutant mouse striatum and cortex were freshly dissected and homogenized by sonication in cold PBS supplemented with protease inhibitor cocktail (Roche, 11873580001). Homogenates were briefly centrifuged for 5 min at 720 × g to remove fatty tissues and nuclei. The resultant supernatants containing cellular organelles were further clarified by centrifugation at 4°C for 15 min at 12,000 × g. The cytosolic fractions were collected from the resultant supernatants, whereas the insoluble membranous fractions were resuspended and washed twice in cold PBS before being completely dissolved in 1% DDM (n-dodecyl-ß-D-maltoside; Sigma Aldrich™, D4641). Sample protein concentration was determined by the Bradford assay. For western blotting, samples of equal amount of protein were diluted in sample buffer (62.5 mM Tris, pH 6.8, 100 mM DTT, 2% SDS, 10% glycerol, and 0.002% bromophenol blue), electrophoresed in 12% SDS-polyacrylamide gels, then transferred onto PVDF membranes. Resulting blots were blocked with 5% non-fat skimmed milk (Bio-Rad, 170-6404) in TBS (25 mM Tris, 3 mM KCl, 140 mM NaCl; USB® Corporation, 75892) and probed with a rabbit polyclonal antibody against LAMP2A (Abcam™, ab18528); monoclonal antibody against HSPA8/HSC70 (Abcam™, ab19136); monoclonal antibody against LAMP1 (Abcam™, 25245); monoclonal antibody against GAPDH (ImmunoWay Biotechnology Company, YM3029) and monoclonal antibody against ACTIN (Cell Signaling Technology, 4970). For chemiluminescence detection, blots were incubated with HRP-conjugated secondary antibodies (goat anti-rabbit immunoglobulin/HRP, Agilent DAKO™, P0448; rabbit anti-mouse immunoglobulin/HRP, Agilent DAKO™, P0260; rabbit anti-rat IgG (H + L) HRP, ThermoFisher Scientific™, 61-9520), followed by ECL substrate detection. Immunoblots were quantified by computerized scanning densitometry using ImageJ software.
Preparation of purified recombinant SNCA oligomers
For the preparation of SNCA oligomers, purified recombinant monomeric SNCA protein (50 μM) dissolved in 0.1 M PBS (phosphate buffered saline) at pH 7.4 (ThermoFisher Scientific™, 10010031) (Figure S2(i)) was mixed with freshly prepared dopamine hydrochloride (Sigma Aldrich™, H8502) at 200 μM to induce oligomer formation according to previous literature [83]. The reaction solution was incubated at 37°C with vigorous agitation for 24 h protected from direct light to allow oligomerization (Figure S2(ii)). The oligomeric SNCA fraction was isolated from the monomeric SNCA by size-exclusion column (Superdex™ 200 10/300 GL; GE Healthcare™, 17-5175-01) (Figure S2(iii)). The eluted fractions containing high-molecular-weight SNCA were concentrated by Amicon™ centrifuge filters (<10 kD), quantified and verified by its immunoreactivity against ‘A11’ oligomeric antibody (ThermoFisher™ Scientific, AHB0052) in western blotting (Figure S2(ii)). The purified oligomeric SNCA was freshly diluted in PBS and used as standards in the SNCA oligomer sandwich-ELISA.
Quantification of SNCA oligomer levels by sandwich-ELISA and dot-blotting
The levels of soluble oligomeric and total SNCA in mouse striatum and cortex, cell culture lysates, and conditioned medium of primary cortical neurons were measured by sandwich-ELISA and dot-blotting. For sandwich-ELISA to quantify the level of SNCA oligomers, 96-well microtiter plate was coated with an excessive amount of ‘A11’ conformational antibody (0.1 μg/well; ThermoFisher Scientific™, AHB0052) in 100 mM bicarbonate/carbonate buffer at 4°C overnight. This antibody has been shown to recognize soluble amyloid-like oligomers but not monomeric or mature fibers of SNCA [38,39,61]. The coated plate was blocked by 5% non-fat dry milk in 1× TBST (25 mM Tris, 0.15 M NaCl, 0.05% Tween-20, pH 7.5; Pierce™, 28360) for 1 h at RT. Soluble lysates (1 μg) or undiluted conditioned medium were incubated at 37°C for 2 h to allow capture of soluble oligomers. Serial dilutions of purified recombinant SNCA oligomers (0, 0.008, 0.04, 0.1, 0.2, 0.25 pg/μl) were incubated in separate wells to generate a standard curve for sample quantification. Plates were incubated with 1:5000 HRP-conjugated polyclonal antibody against SNCA (Bioss™ USA, bs-0009R-HRP) at 37°C for 1 h. After subsequent washes, TMB substrate (ThermoFisher Scientific™, N301) was added and incubated in the dark at 37°C for 15–30 min for color development. After addition of sulphuric acid (0.1M, 1: 1 v/v), the optical density (OD) of each well at 450 nm was measured using a microplate reader. Quantification of total intracellular SNCA oligomer levels in PBS-soluble lysates were based on the linear standard curve generated from purified recombinant SNCA oligomer standards (Figure 1(b)(i)).
For dot-blotting, striatal lysates (1 μg per dot) were spotted onto PVDF membrane using a narrow-mouth pipette tip, and air dried. The resultant blot was incubated with ‘A11’ conformational antibody (1:1000) after blocked by 5% non-fat dry milk in TBST for 1 h at RT. After subsequent washes, the blot was incubated with 1:8000 anti-rabbit HRP-conjugated secondary antibody (goat anti-rabbit immunoglobulin/HRP, Agilent DAKO™, P0448), then developed with ECL reagent for chemiluminescence detection. The relative amount of ‘A11’ oligomers in samples was quantified by computerized scanning densitometry using ImageJ software.
Measurements of total cellular LAMP2A and GAPDH (CMA-substrate) levels in mouse ventral midbrain in flow cytometry
Aged 18-month old WT and LRRK2R1441G KI mutant mouse ventral midbrains were freshly dissected and dissociated by papain dissociation system (Worthington Biochemical Corporation, LK003182) at 37°C with gentle agitation. Cells were passed through nylon mesh (70 micron) to obtain single cell suspension, and were fixed with 4% PFA (paraformaldehyde; Affymetrix Incorporation, 19943) at RT for 10 min. The total number of cells in suspension was counted using hemocytometer. A total of 1,000,000 cells in suspension were incubated with 0.15% Triton-X at RT for additional 10 min to partially permeabilize the cell membrane. Afterward, cells were blocked by 5% BSA (Affymetrix Incorporation, 10857) with 2% normal goat serum for 45 min before incubated with excess amount of primary polyclonal antibody against LAMP2A (Abcam™, ab18528; 1.5 μg antibody in 250 μl) in dilution buffer containing 2.5% BSA and 1% serum for overnight at 4°C. After subsequent washes and centrifugation, cells were further incubated with secondary antibody conjugated with Alexa Fluor® 594 (ThermoFisher Scientific™, A11072) for 30 min at RT protected from light. After final washes, cell pellets were resuspended in PBS supplemented with 0.5% BSA and analyzed by flow cytometry for red fluorescence intensity levels. The relative amount of GAPDH in neurons was measured by flow cytometry after co-staining of GAPDH (ImmunoWay Biotechnology Company, YM3029) and neuronal marker protein TUBB3 (BioLegend, MRB-435P) following the same staining procedure as described above. The amount of cellular LAMP2A and GAPDH in each sample was determined as the mean staining intensity (area under curve) as measured by LSR Fortessa cell analyzer [Becton Dickinson (BD) Biosciences].
Rate of cellular SNCA protein clearance by flow cytometry
To assess the efficiency of intracellular SNCA clearance, MEFs stably expressing either PAmCherry-SNCA-NE or PAmCherry-KFERQ-NE were photoactivated under UV-A (405 nm) for 10 min before flow cytometry measurements. We stably expressed PAmCherry-KFERQ-NE protein, which includes a consensus CMA recognition motif (i.e. ‘KFERQ’) in the protein sequence, as a reference substrate in parallel with SNCA for CMA degradation. Specific substrate degradation by CMA was assessed by the resultant changes in PAmCherry-KFERQ-NE clearance at 48 h under LAMP2A knockdown condition in both WT and LRRK2 KI MEFs. To determine the relative contribution of lysosomal degradation, MEFs stably expressing PAmCherry-KFERQ-NE were treated with either bafilomycin A1 (Tocris Bioscience™, 1334) at 100 nM or CQ (Sigma Aldrich™, C6628) at 20 μM to determine specific reduction in overall clearance due to lysosomal degradation (0, 12, 24, 48 h).
The presence of red fluorescence emitted by photoactivated PAmCherry was confirmed under microscope after photoactivation. The initial level of red fluorescence (t = 0) and the levels in each group at 12, 24, 48 h post-photoactivation were measured by flow cytometry (PE-Texas Red channel) (Figure 5(a)). The rates of SNCA clearance of both WT and LRRK2R1441G KI mutant MEFs were determined as total fluorescent signal compared with their corresponding levels of PAmCherry at t = 0, expressed as a percentage. Endogenous PAmCherry-conjugated substrate proteins which were newly synthesized by the cells after photoactivation did not emit fluorescence. The presence of these newly synthesized proteins inside the cells would not confound the flow cytometry protein clearance assay.
Knockdown of LAMP2A expression to determine CMA-specific protein degradation
In order to determine the functional role of CMA in the overall cellular protein degradation in WT and LRRK2R1441G KI mutant MEFs, mouse Lamp2a mRNA expression in these cells were knocked down by transfection of a mixture of three validated siRNA oligonucleotides (100 nM) [29] using Lipofectamine RNAiMAX™ (ThermoFisher Scientific™, 13778-075) for 72 h. A non-targeting scrambled siRNA (Silencer® Select Negative Control siRNA; ThermoFisher Scientific™, 4390843) was used to assess non-specific confounding effects after transfection. The sequences of the regions targeted by the three siRNA(s) in the exon 8a of the LAMP2A gene were 5ʹ-GACTGCAGTGCAGATGAAG-3ʹ, 5ʹ-CTGCAATCTGATTGATTA-3ʹ, and 5ʹ-TAAACACTGCTTGACCACC-3ʹ, corresponding to bases 1198-1216, 1331-1359, and 1678-1700 [29]. Percentage knockdown of LAMP2A protein expression after siRNA transfection was determined by western blotting.
Measurement of total cellular lysosomal activity
Total lysosomal protein degradation activity was determined using a commercial lysosomal activity assay kit (BioVision™ Incorporation, K448), followed by flow cytometry. Briefly, cells were seeded in 24-well plates at 60% confluence one day before the experiments, and were refreshed by fresh complete medium 1 h before experiment. A lysosomal-specific self-quenched substrate diluted in conditioned medium supplemented with 0.5% FBS was added into the cell medium and incubated for an additional 1 h. This substrate, acting as endocytic cargo, was taken up by cells and was degraded by endo-lysosomal vesicles. After substrate incubation, cells were washed with PBS, then trypsinized, and immediately fixed in 4% PFA. The intracellular fluorescence intensity, emitted by the de-quenched substrate in lysosomes, was measured and quantified by flow cytometry. The activity in WT cells was compared with that in LRRK2R1441G KI cells using unpaired Student’s t-test.
Visualization of SNCA oligomers/aggregates in mouse brains
Mice under anesthesia were perfused with cold PBS followed by 4% PFA. Whole brain was removed and post-fixed in 4% PFA at 4°C overnight according to our previous protocol [31]. After dehydration, clearing, paraffin infiltration and embedding, the whole striatum were sectioned coronally at 8 micron thickness. Paraffin tissues sections after antigen retrieval were blocked by TBS containing 5% normal serum and 5% BSA for 1 h at room temperature. Accumulation of SNCA aggregates and its oligomers in aged WT and LRRK2R1441G KI mutant mouse brains were detected by immunohistochemistry using either a rabbit polyclonal SNCA oligomer-specific ‘Syn33’ antibody (Merck Millipore™, ABN2265) or a mouse monoclonal antibody against total SNCA (4D6; Abcam™, ab1903). After subsequent incubation with F(ab’)2-goat anti-mouse IgG (H + L) cross-adsorbed Alexa Fluor® 594 secondary antibodies (ThermoFisher Scientific™, A-11020), stained slides were counter-stained either by NeuroTrace™ 435/455 blue-fluorescent Nissl stain (ThermoFisher Scientific™, N21479). Afterward, slides were incubated with 0.1% Sudan Black B (Sigma Aldrich™, 199664) dissolved in 70% ethanol for 5 min. to remove tissue auto-fluorescence. Fluorescent confocal photomicrographs were obtained using a Carl Zeiss LSM710 (Germany) laser scanning confocal microscope with a Plan Apochromat 63 × 1.4NA oil immersion objective. Images were collected with Z step size at 2.0 μm thickness and analyzed by ImageJ software.
Intracellular localization of lysosomes
In order to visualize the intracellular localization of lysosomes, WT and mutant LRRK2 MEFs cultured under normal condition were rinsed with cold PBS and fixed by 4% PFA at room temperature for 10 min. For both MEFs and brain sections, endogenous peroxidase activity was blocked by 3% H2O2. After subsequent blocking, slides were either incubated with a rat monoclonal antibody against LAMP1 (Abcam™, ab25245) at 4°C overnight for visualization of total lysosomes, or a human monoclonal antibody against LAMP2A (Abcam™, ab213294) for CMA-specific lysosomes. After subsequent washes using TBST, slides were further incubated with either anti-rat secondary antibody conjugated with Alexa Fluor® 546 or 488 (ThermoFisher Scientific™, goat anti-rat IgG (H + L) cross-adsorbed Alexa Fluor® 546, A-11081; goat anti-rat IgG (H + L) cross-adsorbed Alexa Fluor® 488, A-11006) or a goat PE-conjugated anti-human IgG Fc secondary antibody (eBioscience™, 12-4998-82). Stained slides were counter-stained either by NeuroTrace™ 435/455 blue-fluorescent Nissl stain (ThermoFisher Scientific™, N21479) for neurons, or DAPI stain for total cell nuclei. Afterward, slides were incubated with 0.1% Sudan Black B and then mounted with ProLong™ Diamond anti-fade mountant (ThermoFisher Scientific™, P36961) before photographed under confocal microscope. Estimation of the LAMP2A puncta size was performed by ‘Green and Red Puncta Colocalization Macro’ developed for ImageJ software application (D. J. Swiwarski modified by R.K. Dagda). This macro has been validated for analyzing autophagic flux [84]. Briefly, full size confocal images (Magnification: 1 × 630; 2048 × 2048 pixels per image corresponding to actually area of 18211 µm2) with LAMP2A staining from striatal area of aged WT or KI mice were subjected to auto-threshold adjustment based on the macro script default parameters to remove non-specific background fluorescence. The resultant images were fed into algorithm of puncta analysis. Puncta counts and individual puncta area were measured. The average size of LAMP2A puncta in each animal was expressed in μm2.
Quantitative real-time-PCR of LAMP2A gene expression
Total RNA was extracted using RNeasy® Mini kit (Qiagen™, 74104) according to the manufacturer’s instruction. Briefly, primary neuronal cells after treatments were rinsed with cooled PBS. Buffer RLT (350 μl) was added to each well of the 24-well plate to lyse the cells. The lysates were collected and immediately frozen in liquid nitrogen. After all samples were collected, these lysates were thawed on ice and 350 μl of 70% ethanol was added to each homogenized lysate. The mixture was transferred to the RNeasy spin column, centrifuged, and washed by Buffer RW1 and Buffer RPE. The RNA was eluted in 50 μl of DNase/RNase free water after centrifugation. Total RNA concentration was determined by Nanodrop™ Spectrophotometer 2000 (ThermoFisher Scientific™). The synthesis of cDNA from 0.2 μg of RNA was performed using PrimeScript® RT master mix according to manufacturer’s protocol (TaKaRa Bio USA Incorporation, RR036B). The reaction was incubated at 37°C for 15 min followed by 85°C for 5 s. After the reverse transcription reaction, qPCR was used to quantify the expression of LAMP2A and ACTIN mRNA. Specific primers were used for detection of LAMP2A (forward: 5ʹ-AGGTGCTTTCTGTGTCTAGAGCGT-3ʹ; reverse: 5ʹ-AGAATAAGTACTCCTCCCAGAGCTGC-3ʹ) and ACTIN (forward: 5ʹ-AAGGACTCCTATGTGGGTGACGA-3ʹ; reverse: 5ʹ-ATCTTCTCCATGTCGTCCCAGTTG-3ʹ). The following reaction condition was performed: 10 min at 95°C, followed by 40 cycles of 95°C for 15 s and 60°C for 1 min, and melting curve of 95°C for 15 s and 60°C for 1 min. StepOnePlus™ Real-Time PCR System (ThermoFisher Scientific™, USA) was used to perform the real-time PCR reaction and the data were analyzed by StepOne™ Software v2.3 (ThermoFisher Scientific™, USA) using the comparative CT method (2−ΔΔCT method) [85].
Statistical methods
All experiments were repeated in more than five independent trials. Data are expressed as mean ± standard error mean (S.E.M.). Statistical difference between two independent groups was either assessed by one-way ANOVA followed by the post hoc Bonferroni multiple comparisons test or direct comparison using Mann-Whitney non-parametric analysis and unpaired Student’s t-test, using GraphPad™ PRISM software (GraphPad Inc., CA). Interaction between multiple groups and factors (e.g. interaction between age and mutation effect) was assessed by two-way ANOVA. Differences are considered significant at a level of p < 0.05.
Funding Statement
This work was supported by Tai Hung Fai Charitable Foundation - Edwin S H Leong Research Programme for Parkinson's Disease; The Henry G. Leong Endowed Professorship in Neurology; JABBS Charity; and Health and Medical Research Fund (HK) [05161856].
Acknowledgments
This study was primarily funded by the Tai Hung Fai Charitable Foundation - Edwin S H Leong Research Programme for Parkinson’s Disease, and Henry G. Leong Endowed Professorship in Neurology (SLH). This project was also partly funded by Health and Medical Research Fund (HMRF) (Project no. 05161856), Food and Health Bureau, Hong Kong S.A.R. DBR acknowledges the financial support of the JABBS charity. The authors acknowledge the technical assistance from the University Faculty Core Facility on confocal imaging and flow cytometry.
Disclosure statement
No potential conflict of interest was reported by the authors.
Supplementary material
Supplemental data for this article can be accessed here.
References
- [1].de Lau LM, Breteler MM.. Epidemiology of Parkinson’s disease. Lancet Neurol. 2006;5(6):525–535. [DOI] [PubMed] [Google Scholar]
- [2].Lesage S, Brice A.. Parkinson‘s disease: from monogenic forms to genetic susceptibility factors. Hum Mol Genet. 2009;18(R1):R48–R59. [DOI] [PubMed] [Google Scholar]
- [3].Lin MK, Farrer MJ. Genetics and genomics of Parkinson‘s disease. Genome Med. 2014;6(6):48. [DOI] [PMC free article] [PubMed] [Google Scholar]
- [4].Verstraeten A, Theuns J, Van Broeckhoven C. Progress in unraveling the genetic etiology of Parkinson disease in a genomic era. Trends Genet. 2015;31(3):140–149. [DOI] [PubMed] [Google Scholar]
- [5].Satake W, Nakabayashi Y, Mizuta I, et al. Genome-wide association study identifies common variants at four loci as genetic risk factors for Parkinson’s disease. Nat Genet. 2009;41:1303–1307. [DOI] [PubMed] [Google Scholar]
- [6].Simón-Sánchez J, Schulte C, Bras JM, et al. Genome-wide association study reveals genetic risk underlying Parkinson’s disease. Nat Genet. 2009;41:1308–1312. [DOI] [PMC free article] [PubMed] [Google Scholar]
- [7].Spillantini MG, Schmidt ML, Lee VM, et al. Alpha-synuclein in Lewy bodies. Nature. 1997;388:839–840. [DOI] [PubMed] [Google Scholar]
- [8].Roberts HL, Brown DR. Seeking a mechanism for the toxicity of oligomeric α-synuclein. Biomolecules. 2015;5:282–305. [DOI] [PMC free article] [PubMed] [Google Scholar]
- [9].Lashuel HA, Overk CR, Oueslati A, et al. The many faces of α-synuclein: from structure and toxicity to therapeutic target. Nat Rev Neurosci. 2013;14:38–48. [DOI] [PMC free article] [PubMed] [Google Scholar]
- [10].Brucale M, Sandal M, Di Maio S, et al. Pathogenic mutations shift the equilibria of alpha-synuclein single molecules towards structured conformers. Chembiochem. 2009;10:176–183. [DOI] [PubMed] [Google Scholar]
- [11].Winner B, Jappelli R, Maji SK, et al. In vivo demonstration that alpha-synuclein oligomers are toxic. Proc Natl Acad Sci USA. 2011;108(10):4194–4199. [DOI] [PMC free article] [PubMed] [Google Scholar]
- [12].Desplats P, Lee HJ, Bae EJ, et al. Inclusion formation and neuronal cell death through neuron-to-neuron transmission of alpha-synuclein. Proc Natl Acad Sci USA. 2009;106(31):13010–13015. [DOI] [PMC free article] [PubMed] [Google Scholar]
- [13].Danzer KM, Kranich LR, Ruf WP, et al. Exosomal cell-to-cell transmission of alpha synuclein oligomers. Mol Neurodegener. 2012;7:42. [DOI] [PMC free article] [PubMed] [Google Scholar]
- [14].Cremades N, Cohen SI, Deas E, et al. Direct observation of the interconversion of normal and toxic forms of α-synuclein. Cell. 2012;149:1048–1059. [DOI] [PMC free article] [PubMed] [Google Scholar]
- [15].Dehay B, Bourdenx M, Gorry P, et al. Targeting α-synuclein for treatment of Parkinson‘s disease: mechanistic and therapeutic considerations. Lancet Neurol. 2015;14(8):855–866. [DOI] [PMC free article] [PubMed] [Google Scholar]
- [16].Kaushik S, Cuervo AM. Chaperone-mediated autophagy: a unique way to enter the lysosome world. Trends Cell Biol. 2012;22(8):407–417. [DOI] [PMC free article] [PubMed] [Google Scholar]
- [17].Martinez-Vicente M. Autophagy in neurodegenerative diseases: from pathogenic dysfunction to therapeutic modulation. Semin Cell Dev Biol. 2015;40:115–126. [DOI] [PubMed] [Google Scholar]
- [18].Settembre C, Fraldi A, Medina DL, et al. Signals from the lysosome: a control centre for cellular clearance and energy metabolism. Nat Rev Mol Cell Biol. 2013;14(5):283–296. [DOI] [PMC free article] [PubMed] [Google Scholar]
- [19].Alvarez-Erviti L, Rodriguez-Oroz MC, Cooper JM, et al. Chaperone-mediated autophagy markers in Parkinson disease brains. Arch Neurol. 2010;67(12):1464–1472. [DOI] [PubMed] [Google Scholar]
- [20].Cuervo AM, Stefanis L, Fredenburg R, et al. Impaired degradation of mutant alpha-synuclein by chaperone-mediated autophagy. Science. 2004;305:1292–1295. [DOI] [PubMed] [Google Scholar]
- [21].Dehay B, Bove J, Rodriguez-Muela N, et al. Pathogenic lysosomal depletion in Parkinson’s disease. J Neurosci. 2010;30(37):12535–12544. [DOI] [PMC free article] [PubMed] [Google Scholar]
- [22].Xilouri M, Brekk OR, Kirik D, et al. LAMP2A as a therapeutic target in Parkinson’s disease. Autophagy. 2013;9(12):2166–2168. [DOI] [PubMed] [Google Scholar]
- [23].Chiang HL, Terlecky S, Plant C, et al. A role for a 70-kilodalton heat shock protein in lysosomal degradation of intracellular proteins. Science. 1989;246:382–385. [DOI] [PubMed] [Google Scholar]
- [24].Bandyopadhyay U, Kaushik S, Varticovski L, et al. The chaperone-mediated autophagy receptor organizes in dynamic protein complexes at the lysosomal membrane. Mol Cell Biol. 2008;28:5747–5763. [DOI] [PMC free article] [PubMed] [Google Scholar]
- [25].Zhang H, Duan C, Yang H. Defective autophagy in Parkinson‘s disease: lessons from genetics. Mol Neurobiol. 2015;51(1):89–104. [DOI] [PubMed] [Google Scholar]
- [26].Chiang HL, Dice JF. Peptide sequences that target proteins for enhanced degradation during serum withdrawal. J Biol Chem. 1988;263(14):6797–6805. [PubMed] [Google Scholar]
- [27].Dice JF. Peptide sequences that target cytosolic proteins for lysosomal proteolysis. Trends Biochem Sci. 1990;15:305–309. [DOI] [PubMed] [Google Scholar]
- [28].Kiffin R, Kaushik S, Zeng M, et al. Altered dynamics of the lysosomal receptor for chaperone-mediated autophagy with age. J Cell Sci. 2007;120(Pt 5):782–791. [DOI] [PubMed] [Google Scholar]
- [29].Massey AC, Kaushik S, Sovak G, et al. Consequences of the selective blockage of chaperone-mediated autophagy. Proc Natl Acad Sci USA. 2006;103(15):5805–5810. [DOI] [PMC free article] [PubMed] [Google Scholar]
- [30].Liu HF, Lu S, Ho PW, et al. LRRK2 R1441G mice are more liable to dopamine depletion and locomotor inactivity. Ann Clin Transl Neurol. 2014;1:199–208. [DOI] [PMC free article] [PubMed] [Google Scholar]
- [31].Liu HF, Ho PWL, Leung GC, et al. Combined LRRK2 mutation, aging and chronic low dose oral rotenone as a model of Parkinson’s disease. Sci Rep. 2017;7:40887. [DOI] [PMC free article] [PubMed] [Google Scholar]
- [32].Yue M, Hinkle KM, Davies P, et al. Progressive dopaminergic alterations and mitochondrial abnormalities in LRRK2 G2019S knock-in mice. Neurobiol Dis. 2015;78:172–195. [DOI] [PMC free article] [PubMed] [Google Scholar]
- [33].Tong Y, Pisani A, Martella G, et al. R1441C mutation in LRRK2 impairs dopaminergic neurotransmission in mice. Proc Natl Acad Sci USA. 2009;106(34):14622–14627. [DOI] [PMC free article] [PubMed] [Google Scholar]
- [34].Cuervo AM, Wong E. Chaperone-mediated autophagy: roles in disease and aging. Cell Res. 2014;24(1):92–104. [DOI] [PMC free article] [PubMed] [Google Scholar]
- [35].Orenstein SJ, Kuo SH, Tasset I, et al. Interplay of LRRK2 with chaperone-mediated autophagy. Nat Neurosci. 2013;16:394–406. [DOI] [PMC free article] [PubMed] [Google Scholar]
- [36].Terlecky SR, Dice JF. Polypeptide import and degradation by isolated lysosomes. J Biol Chem. 1993;268(31):23490–23495. [PubMed] [Google Scholar]
- [37].Cuervo AM, Terlecky SR, Dice JF, et al. Selective binding and uptake of ribonuclease A and glyceraldehyde-3-phosphate dehydrogenase by isolated rat liver lysosomes. J Biol Chem. 1994;269:26374–26380. [PubMed] [Google Scholar]
- [38].Kayed R, Head E, Thompson JL, et al. Common structure of soluble amyloid oligomers implies common mechanism of pathogenesis. Science. 2003;300:486–489. [DOI] [PubMed] [Google Scholar]
- [39].Rockenstein E, Nuber S, Overk CR, et al. Accumulation of oligomer-prone α-synuclein exacerbates synaptic and neuronal degeneration in vivo. Brain. 2014;137(Pt 5):1496–1513. [DOI] [PMC free article] [PubMed] [Google Scholar] [Retracted]
- [40].Pu J, Guardia CM, Keren-Kaplan T, et al. Mechanisms and functions of lysosome positioning. J Cell Sci. 2016;129(23):4329–4339. [DOI] [PMC free article] [PubMed] [Google Scholar]
- [41].Zaarur N, Meriin AB, Bejarano E, et al. Proteasome failure promotes positioning of lysosomes around the aggresome via local block of microtubule-dependent transport. Mol Cell Biol. 2014;34(7):1336–1348. [DOI] [PMC free article] [PubMed] [Google Scholar]
- [42].Cuervo AM, Dice JF. Regulation of lamp2a levels in the lysosomal membrane. Traffic. 2000;1(7):570–583. [DOI] [PubMed] [Google Scholar]
- [43].Ho PWL, Tse ZHM, Liu HF, et al. Assessment of cellular estrogenic activity based on estrogen receptor-mediated reduction of soluble-form catechol-O-methyltransferase (COMT) expression in an ELISA-based system. PLoS One. 2013;8(9):e74065. [DOI] [PMC free article] [PubMed] [Google Scholar]
- [44].Tse HF, Ho JC, Choi SW, et al. Patient-specific induced-pluripotent stem cells-derived cardiomyocytes recapitulate the pathogenic phenotypes of dilated cardiomyopathy due to a novel DES mutation identified by whole exome sequencing. Hum Mol Genet. 2013;22(7):1395–1403. [DOI] [PubMed] [Google Scholar]
- [45].Xu EG, Ho PWL, Tse Z, et al. Revealing ecological risks of priority endocrine disrupting chemicals in four marine protected areas in Hong Kong through an integrative approach. Environ Pollut. 2016;215:103–112. [DOI] [PubMed] [Google Scholar]
- [46].Anguiano J, Garner TP, Mahalingam M, et al. Chemical modulation of chaperone-mediated autophagy by retinoic acid derivatives. Nat Chem Biol. 2013;9(6):374–382. [DOI] [PMC free article] [PubMed] [Google Scholar]
- [47].Cuervo AM, Knecht E, Terlecky SR, et al. Activation of a selective pathway of lysosomal proteolysis in rat liver by prolonged starvation. Am J Physiol. 1995;269(5 Pt 1):C1200–C1208. [DOI] [PubMed] [Google Scholar]
- [48].Ito G, Katsemonova K, Tonelli F, et al. Phos-tag analysis of Rab10 phosphorylation by LRRK2: a powerful assay for assessing kinase function and inhibitors. Biochem J. 2016;73(17):2671–2685. [DOI] [PMC free article] [PubMed] [Google Scholar]
- [49].Fauvet B, Mbefo MK, Fares MB, et al. α-Synuclein in central nervous system and from erythrocytes, mammalian cells, and Escherichia coli exists predominantly as disordered monomer. J Biol Chem. 2012;287(19):15345–15364. [DOI] [PMC free article] [PubMed] [Google Scholar]
- [50].Theillet FX, Binolfi A, Bekei B, et al. Structural disorder of monomeric α-synuclein persists in mammalian cells. Nature. 2016;530(7588):45–50. [DOI] [PubMed] [Google Scholar]
- [51].Xu J, Kao SY, Lee FJ, et al. Dopamine-dependent neurotoxicity of alpha-synuclein: a mechanism for selective neurodegeneration in Parkinson disease. Nat Med. 2002;8(6):600–606. [DOI] [PubMed] [Google Scholar]
- [52].Danzer KM, Haasen D, Karow AR, et al. Different species of alpha-synuclein oligomers induce calcium influx and seeding. J Neurosci. 2007;27:9220–9232. [DOI] [PMC free article] [PubMed] [Google Scholar]
- [53].van Rooijen BD, Claessens MM, Subramaniam V. Membrane interactions of oligomeric alpha-synuclein: potential role in Parkinson‘s disease. Curr Protein Pept Sci. 2010;11(5):334–342. [DOI] [PubMed] [Google Scholar]
- [54].Xilouri M, Brekk OR, Stefanis L. α-Synuclein and protein degradation systems: a reciprocal relationship. Mol Neurobiol. 2013;47(2):537–551. [DOI] [PubMed] [Google Scholar]
- [55].Ingelsson M. Alpha-synuclein oligomers-neurotoxic molecules in Parkinson’s disease and other Lewy body disorders. Front Neurosci. 2016;10:408. [DOI] [PMC free article] [PubMed] [Google Scholar]
- [56].Cooper AA, Gitler AD, Cashikar A, et al. Alpha-synuclein blocks ER-Golgi traffic and Rab1 rescues neuron loss in Parkinson‘s models. Science. 2006;313(5785):324–328. [DOI] [PMC free article] [PubMed] [Google Scholar]
- [57].Luth ES, Stavrovskaya IG, Bartels T, et al. Soluble, prefibrillar α-synuclein oligomers promote complex I-dependent, Ca2+-induced mitochondrial dysfunction. J Biol Chem. 2014;289(31):21490–21507. [DOI] [PMC free article] [PubMed] [Google Scholar]
- [58].Longo F, Mercatelli D, Novello S, et al. Age-dependent dopamine transporter dysfunction and Serine129 phospho-α-synuclein overload in G2019S LRRK2 mice. Acta Neuropathol Commun. 2017;5(1):22. [DOI] [PMC free article] [PubMed] [Google Scholar]
- [59].Sengupta U, Guerrero-Muñoz MJ, Castillo-Carranza DL, et al. Pathological interface between oligomeric alpha-synuclein and tau in synucleinopathies. Biol Psychiatry. 2015;78(10):672–683. [DOI] [PubMed] [Google Scholar]
- [60].Galvin JE, Lee VM, Trojanowski JQ. Synucleinopathies: clinical and pathological implications. Arch Neurol. 2001;58(2):186–190. [DOI] [PubMed] [Google Scholar]
- [61].Aasly JO, Johansen KK, Brønstad G, et al. Elevated levels of cerebrospinal fluid α-synuclein oligomers in healthy asymptomatic LRRK2 mutation carriers. Front Aging Neurosci. 2014;25:248. [DOI] [PMC free article] [PubMed] [Google Scholar]
- [62].Park MJ, Cheon SM, Bae HR, et al. Elevated levels of α-synuclein oligomer in the cerebrospinal fluid of drug-naïve patients with Parkinson’s disease. J Clin Neurol. 2011;7:215–222. [DOI] [PMC free article] [PubMed] [Google Scholar]
- [63].Tokuda T, Qureshi MM, Ardah MT, et al. Detection of elevated levels of α-synuclein oligomers in CSF from patients with Parkinson disease. Neurology. 2010;75(20):1766–1772. [DOI] [PubMed] [Google Scholar]
- [64].Moors T, Paciotti S, Chiasserini D, et al. Lysosomal dysfunction and α-synuclein aggregation in Parkinson’s disease: diagnostic links. Mov Disord. 2016;31(6):791–801. [DOI] [PubMed] [Google Scholar]
- [65].Cookson MR. Cellular functions of LRRK2 implicate vesicular trafficking pathways in Parkinson‘s disease. Biochem Soc Trans. 2016;44(6):1603–1610. [DOI] [PubMed] [Google Scholar]
- [66].Dodson MW, Zhang T, Jiang C, et al. Roles of the Drosophila LRRK2 homolog in Rab7-dependent lysosomal positioning. Hum Mol Genet. 2012;21(6):1350–1363. [DOI] [PMC free article] [PubMed] [Google Scholar]
- [67].Arias E, Cuervo AM. Chaperone-mediated autophagy in protein quality control. Curr Opin Cell Biol. 2011;23(2):184–189. [DOI] [PMC free article] [PubMed] [Google Scholar]
- [68].Patel B, Cuervo AM. Methods to study chaperone-mediated autophagy. Methods. 2015;75:133–140. [DOI] [PMC free article] [PubMed] [Google Scholar]
- [69].Kaushik S, Massey AC, Mizushima N, et al. Constitutive activation of chaperone-mediated autophagy in cells with impaired macroautophagy. Mol Biol Cell. 2008;19(5):2179–2192. [DOI] [PMC free article] [PubMed] [Google Scholar]
- [70].Subach FV, Patterson GH, Manley S, et al. Photoactivatable mCherry for high-resolution two-color fluorescence microscopy. Nat Methods. 2009;6(2):153–159. [DOI] [PMC free article] [PubMed] [Google Scholar]
- [71].Webb JL, Ravikumar B, Atkins J, et al. Alpha-Synuclein is degraded by both autophagy and the proteasome. J Biol Chem. 2003;278(27):25009–25013. [DOI] [PubMed] [Google Scholar]
- [72].Rajawat Y, Hilioti Z, Bossis I. Retinoic acid induces autophagosome maturation through redistribution of the cation-independent mannose-6-phosphate receptor. Antioxid Redox Signal. 2011;14(11):2165–2177. [DOI] [PubMed] [Google Scholar]
- [73].Bigagli E, Luceri C, Scartabelli T, et al. Long-term neuroglial cocultures as a brain aging model: hallmarks of senescence, microRNA expression profiles, and comparison with in vivo models. J Gerontol A Biol Sci Med Sci. 2016;71(1):50–60. [DOI] [PubMed] [Google Scholar]
- [74].Lesuisse C, Martin LJ. Long-term culture of mouse cortical neurons as a model for neuronal development, aging, and death. J Neurobiol. 2002;51(1):9–23. [DOI] [PubMed] [Google Scholar]
- [75].Zhu J, Gianni M, Kopf E, et al. Retinoic acid induces proteasome-dependent degradation of retinoic acid receptor α (RARα) and oncogenic RARα fusion proteins. Proc Natl Acad Sci U S A. 1999;96(26):14807–14812. [DOI] [PMC free article] [PubMed] [Google Scholar]
- [76].Bae EJ, Lee HJ, Rockenstein E, et al. Antibody-aided clearance of extracellular α-synuclein prevents cell-to-cell aggregate transmission. J Neurosci. 2012;32(39):13454–13469. [DOI] [PMC free article] [PubMed] [Google Scholar]
- [77].Tran HT, Chung CH, Iba M, et al. Α-synuclein immunotherapy blocks uptake and templated propagation of misfolded α-synuclein and neurodegeneration. Cell Rep. 2014;7(6):2054–2065. [DOI] [PMC free article] [PubMed] [Google Scholar]
- [78].Lindström V, Fagerqvist T, Nordström E, et al. Immunotherapy targeting α-synuclein protofibrils reduced pathology in (Thy-1)-h[A30P] α-synuclein mice. Neurobiol Dis. 2014;69:134–143. [DOI] [PubMed] [Google Scholar]
- [79].Lee HJ, Khoshaghideh F, Patel S, et al. Clearance of alpha-synuclein oligomeric intermediates via the lysosomal degradation pathway. J Neurosci. 2004;24(8):1888–1896. [DOI] [PMC free article] [PubMed] [Google Scholar]
- [80].Facci L, Skaper SD. Culture of rodent cortical and hippocampal neurons. Methods Mol Biol. 2012;846:49–56. [DOI] [PubMed] [Google Scholar]
- [81].Yu J, Vodyanik MA, Smuga-Otto K, et al. Induced pluripotent stem cell lines derived from human somatic cells. Science. 2007;318(5858):1917–1920. [DOI] [PubMed] [Google Scholar]
- [82].Orenstein SJ, Cuervo AM. Chaperone-mediated autophagy: molecular mechanisms and physiological relevance. Semin Cell Dev Biol. 2010;21(7):719–726. [DOI] [PMC free article] [PubMed] [Google Scholar]
- [83].Lee HJ, Baek SM, Ho DH, et al. Dopamine promotes formation and secretion of non-fibrillar alpha-synuclein oligomers. Exp Mol Med. 2011;43:216–222. [DOI] [PMC free article] [PubMed] [Google Scholar]
- [84].Pampliega O, Orhon I, Patel B, et al. Functional interaction between autophagy and ciliogenesis. Nature. 2013;502(7470):194–200. [DOI] [PMC free article] [PubMed] [Google Scholar]
- [85].Schmittgen TD, Livak KJ. Analyzing real-time PCR data by the comparative C(T) method. Nat Protoc. 2008;3(6):1101–1108. [DOI] [PubMed] [Google Scholar]
Associated Data
This section collects any data citations, data availability statements, or supplementary materials included in this article.